| Param | Original file | Final file |
|---|---|---|
| Filename | modeM0/AS1A09_131T01_9000004702_32353cztM0_level2.evt | modeM0/AS1A09_131T01_9000004702_32353cztM0_level2_quad_clean.evt |
| Size (bytes) | 606,312,000 | 129,957,120 |
| Size | 578.2 MB | 123.9 MB |
| Events in quadrant A | 3,239,697 | 898,873 |
| Events in quadrant B | 5,393,254 | 905,104 |
| Events in quadrant C | 4,252,453 | 864,858 |
| Events in quadrant D | 5,061,492 | 838,107 |
| Mode M0 | |||
|---|---|---|---|
| Quadrant | BADHDUFLAG | Total packets | Discarded packets |
| A | 0 | 13635 | 2 |
| B | 0 | 20651 | 1 |
| C | 0 | 16914 | 1 |
| D | 0 | 19177 | 1 |
| Mode SS | |||
|---|---|---|---|
| Quadrant | BADHDUFLAG | Total packets | Discarded packets |
| A | 0 | 124 | 0 |
| B | 0 | 124 | 0 |
| C | 0 | 124 | 0 |
| D | 0 | 124 | 0 |
| Mode M9 | |||
|---|---|---|---|
| Quadrant | BADHDUFLAG | Total packets | Discarded packets |
| A | 0 | 13 | 0 |
| B | 0 | 13 | 0 |
| C | 0 | 13 | 0 |
| D | 0 | 13 | 0 |
| Quadrant | Total seconds | Saturated seconds | Saturation percentage |
|---|---|---|---|
| A | 6149 | 28 | 0.455359% |
| B | 6149 | 224 | 3.642869% |
| C | 6149 | 438 | 7.123109% |
| D | 6149 | 331 | 5.382989% |
Noise dominated data is calculated using 1-second bins in cleaned event files. If a bin has >2000 counts, and if more than 50% of those come from <1% of pixels, then it is considered to be noise-dominated and hence unusable.
| Quadrant | # 1 sec bins | Bins with >0 counts | Bins with >2000 counts | High rate bins dominated by noise | Noise dominated (total time) | Noise dominated (detector-on time) | Marked lightcurve |
|---|---|---|---|---|---|---|---|
| A | 7454 | 6150 | 0 | 0 | 0.00% | 0.00% | 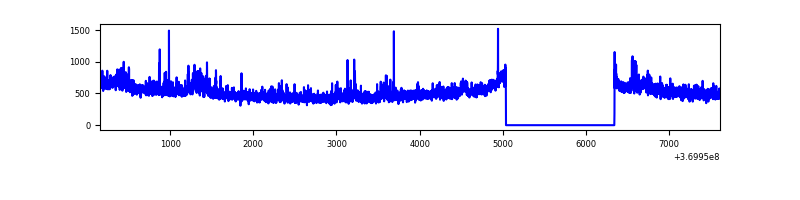 |
| B | 7454 | 6150 | 77 | 77 | 1.03% | 1.25% | 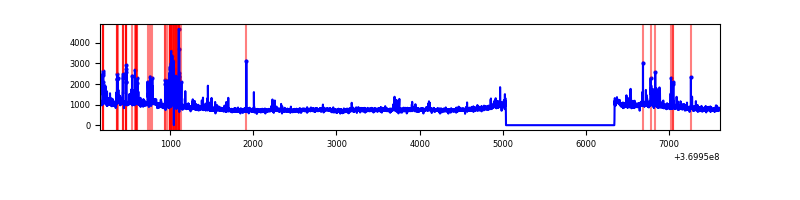 |
| C | 7454 | 6150 | 61 | 61 | 0.82% | 0.99% |  |
| D | 7454 | 6150 | 225 | 225 | 3.02% | 3.66% | 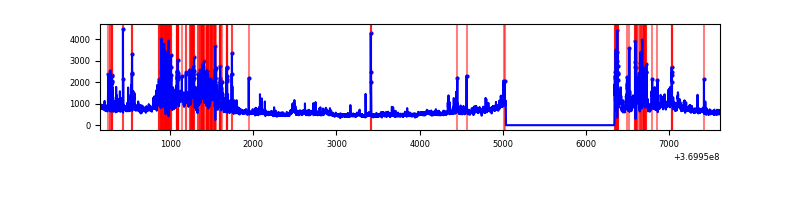 |
Top three noisy pixels from each quadrant. If the there are fewer than three noisy pixels in the level2.evt file, extra rows are filled as -1
| Pixel properties | Quadrant properties | ||||||
|---|---|---|---|---|---|---|---|
| Quadrant | DetID | PixID | Counts | Sigma | Mean | Median | Sigma |
| A | 12 | 189 | 206205 | 1328.87 | 778 | 764 | 154.6 |
| A | 13 | 6 | 16230 | 100.04 | 778 | 764 | 154.6 |
| A | 13 | 254 | 12678 | 77.06 | 778 | 764 | 154.6 |
| B | 6 | 159 | 1883112 | 13128.1 | 775 | 756 | 143.4 |
| B | 5 | 172 | 270975 | 1884.59 | 775 | 756 | 143.4 |
| B | 0 | 245 | 37173 | 253.98 | 775 | 756 | 143.4 |
| C | 0 | 10 | 775948 | 4549.37 | 741 | 745 | 170.4 |
| C | 3 | 233 | 187984 | 1098.83 | 741 | 745 | 170.4 |
| C | 14 | 238 | 184582 | 1078.87 | 741 | 745 | 170.4 |
| D | 8 | 195 | 1079997 | 6161.16 | 747 | 730 | 175.2 |
| D | 13 | 249 | 334210 | 1903.72 | 747 | 730 | 175.2 |
| D | 7 | 38 | 283999 | 1617.08 | 747 | 730 | 175.2 |
Histogram calculated using DETX and DETY for each event in the final _common_clean file
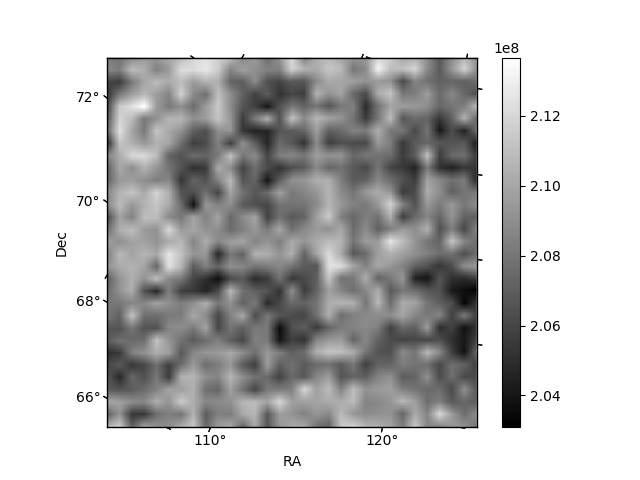
| Quadrant A | 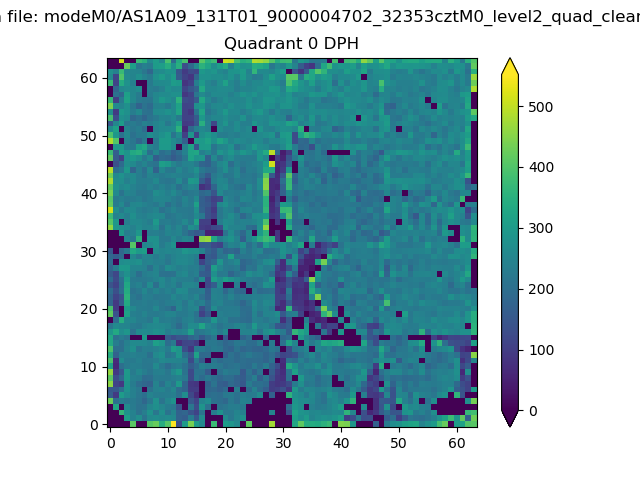 |
 |
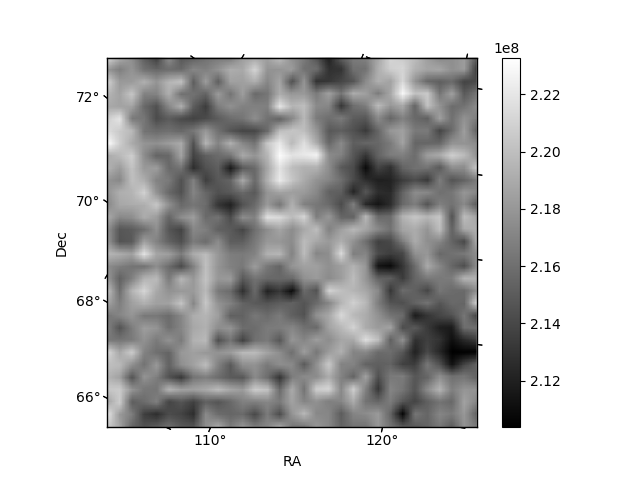
Quadrant B |
|---|---|---|---|
| Quadrant D | 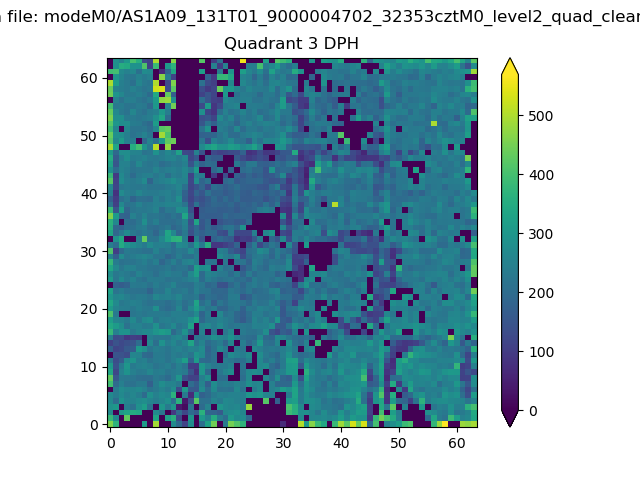 |
 |
Quadrant C |
| Plot type | Count rate plots | Images |
|---|---|---|
| Comparison with Poisson distribution Blue bars denote a histogram of data divided into 1 sec bins. Red curve is a Poisson curve with rate = median count rate of data. |
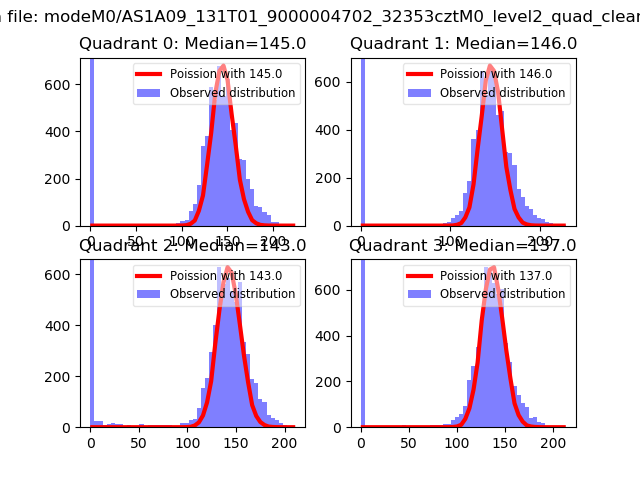 |
 |
| Quadrant-wise count rates Data is divided into 100 sec bins |
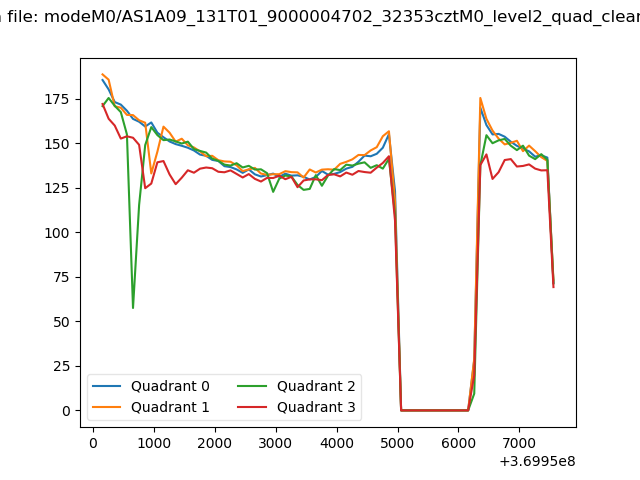 |
|
| Module-wise count rates for Quadrant A Data is divided into 100 sec bins |
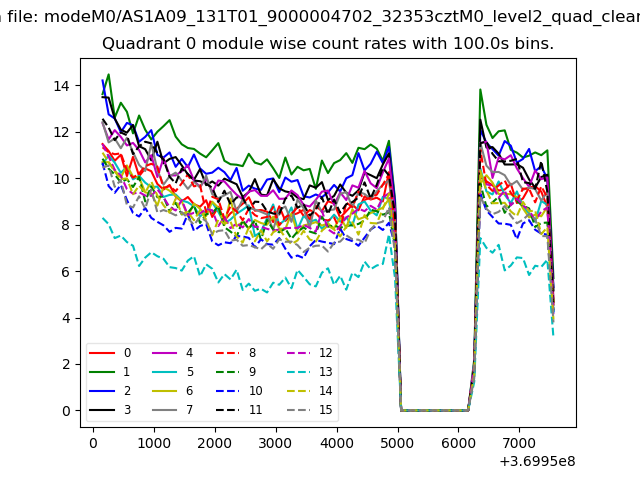 |
 |
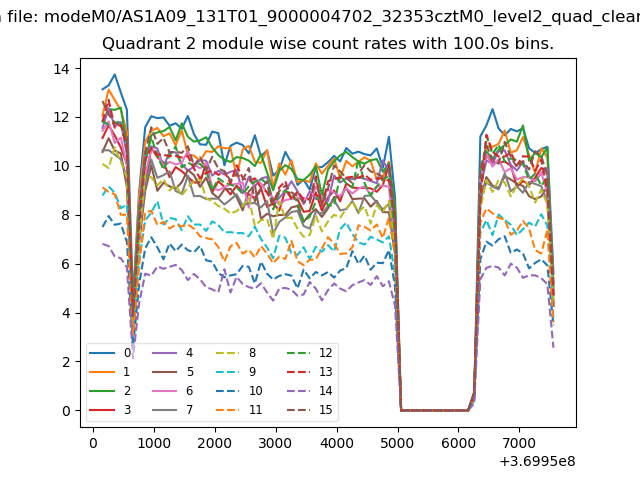
| Module-wise count rates for Quadrant B Data is divided into 100 sec bins |
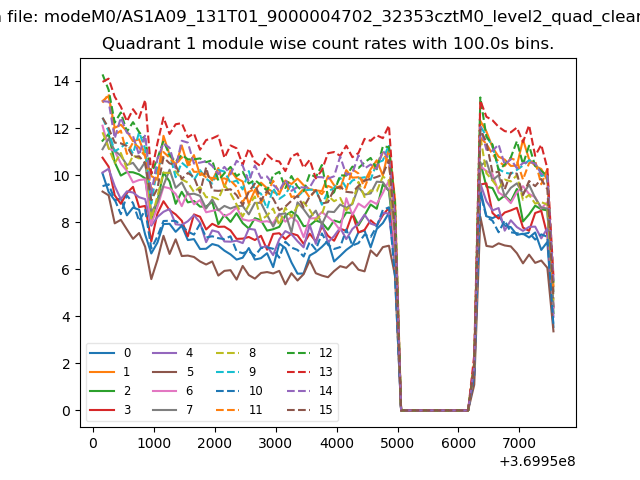 |
 |
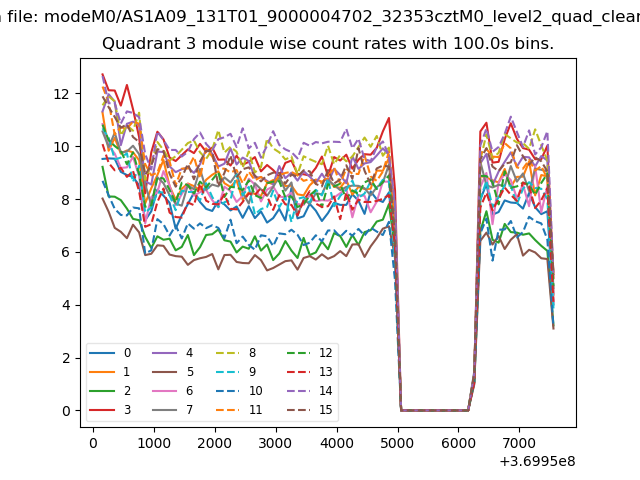
| Module-wise count rates for Quadrant C Data is divided into 100 sec bins |
 |
 |
| Module-wise count rates for Quadrant D Data is divided into 100 sec bins |
 |
 |
| Parameter | Plot |
|---|---|
| CZT HV Monitor | 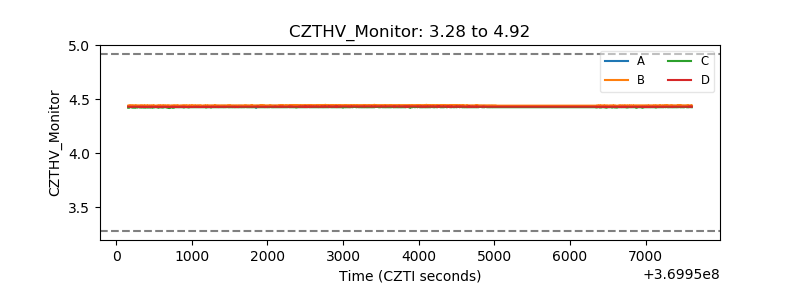 |
| D_VDD | 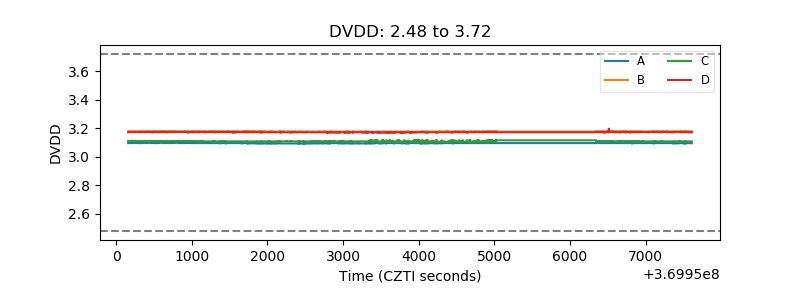 |
| Temperature 1 | 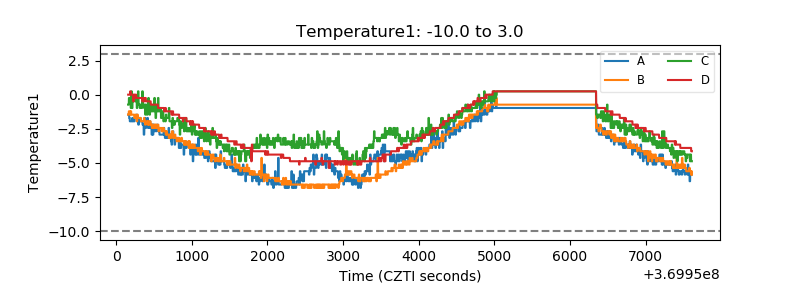 |
| Veto HV Monitor |  |
| Veto LLD | 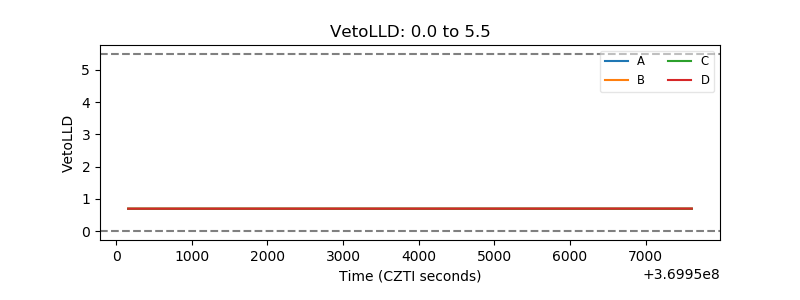 |
| Alpha Counter | 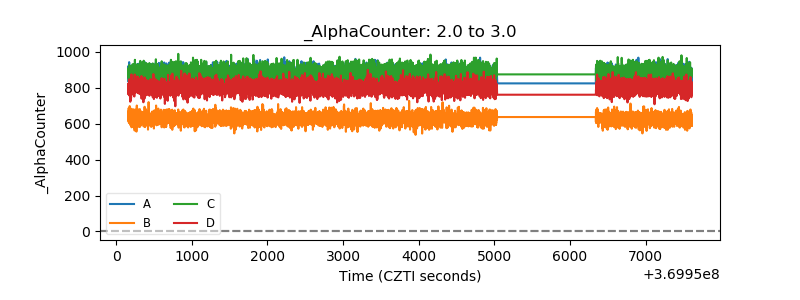 |
| _CPM_Rate | 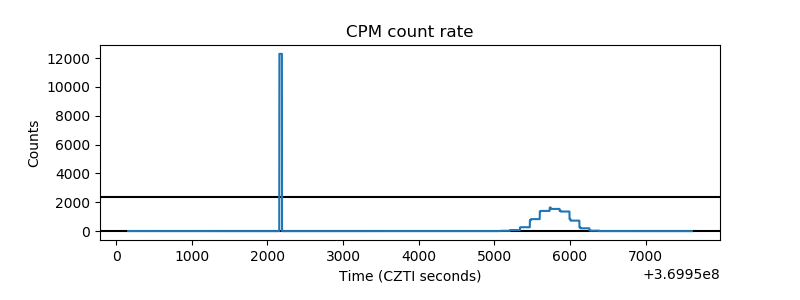 |
| CZT Counter | 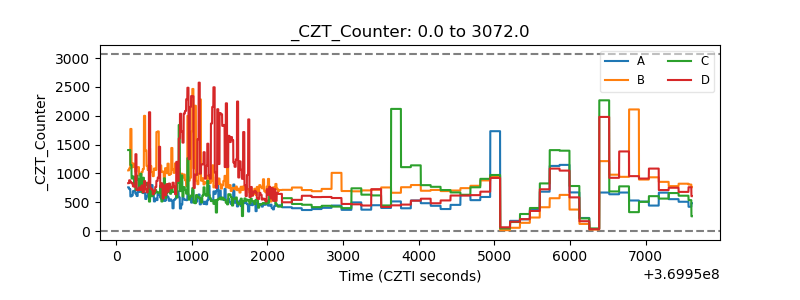 |
| +2.5 Volts monitor |  |
| +5 Volts monitor |  |
| _ROLL_ROT | 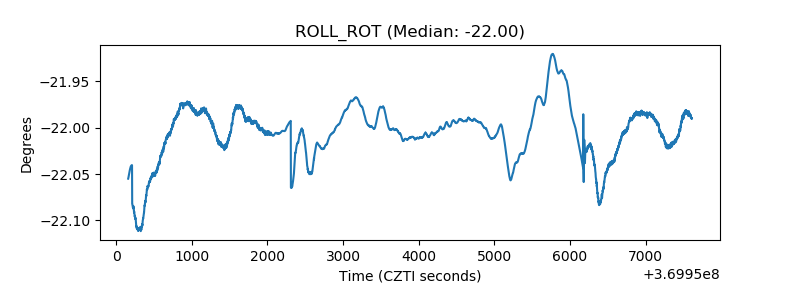 |
| _Roll_DEC | 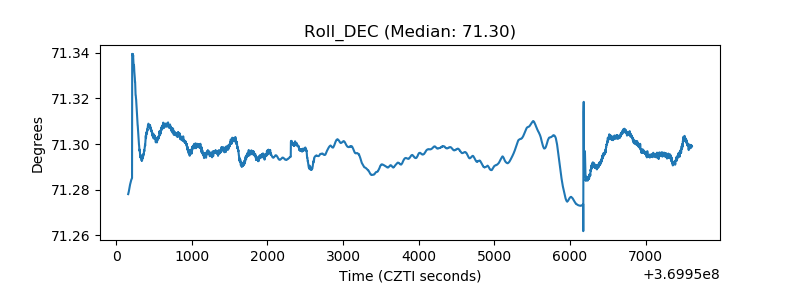 |
| _Roll_RA | 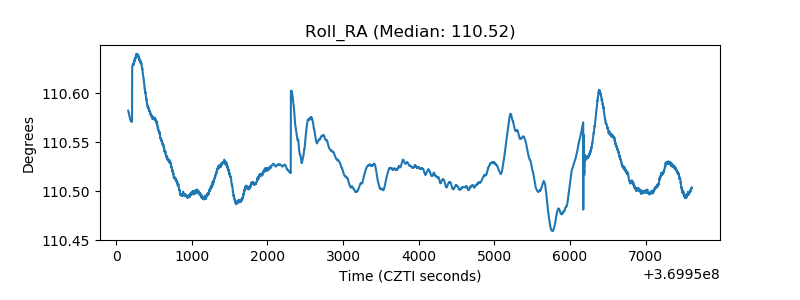 |
| Veto Counter | 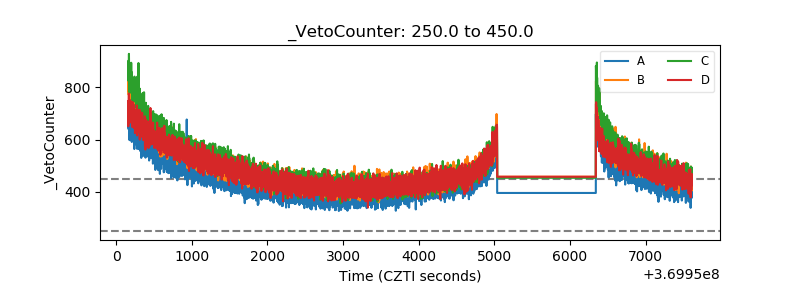 |