| Param | Original file | Final file |
|---|---|---|
| Filename | modeM0/AS1A09_131T01_9000004702_32354cztM0_level2.evt | modeM0/AS1A09_131T01_9000004702_32354cztM0_level2_quad_clean.evt |
| Size (bytes) | 613,154,880 | 130,521,600 |
| Size | 584.8 MB | 124.5 MB |
| Events in quadrant A | 3,246,741 | 894,147 |
| Events in quadrant B | 6,266,408 | 871,907 |
| Events in quadrant C | 3,592,284 | 884,545 |
| Events in quadrant D | 5,019,562 | 844,079 |
| Mode M0 | |||
|---|---|---|---|
| Quadrant | BADHDUFLAG | Total packets | Discarded packets |
| A | 0 | 13953 | 3 |
| B | 0 | 23423 | 2 |
| C | 0 | 14975 | 2 |
| D | 0 | 19549 | 2 |
| Mode SS | |||
|---|---|---|---|
| Quadrant | BADHDUFLAG | Total packets | Discarded packets |
| A | 0 | 134 | 0 |
| B | 0 | 134 | 0 |
| C | 0 | 134 | 0 |
| D | 0 | 134 | 0 |
| Mode M9 | |||
|---|---|---|---|
| Quadrant | BADHDUFLAG | Total packets | Discarded packets |
| A | 0 | 14 | 0 |
| B | 0 | 14 | 0 |
| C | 0 | 14 | 0 |
| D | 0 | 15 | 0 |
| Quadrant | Total seconds | Saturated seconds | Saturation percentage |
|---|---|---|---|
| A | 6571 | 44 | 0.669609% |
| B | 6571 | 614 | 9.344088% |
| C | 6571 | 231 | 3.515447% |
| D | 6571 | 202 | 3.074114% |
Noise dominated data is calculated using 1-second bins in cleaned event files. If a bin has >2000 counts, and if more than 50% of those come from <1% of pixels, then it is considered to be noise-dominated and hence unusable.
| Quadrant | # 1 sec bins | Bins with >0 counts | Bins with >2000 counts | High rate bins dominated by noise | Noise dominated (total time) | Noise dominated (detector-on time) | Marked lightcurve |
|---|---|---|---|---|---|---|---|
| A | 7571 | 6572 | 1 | 1 | 0.01% | 0.02% | 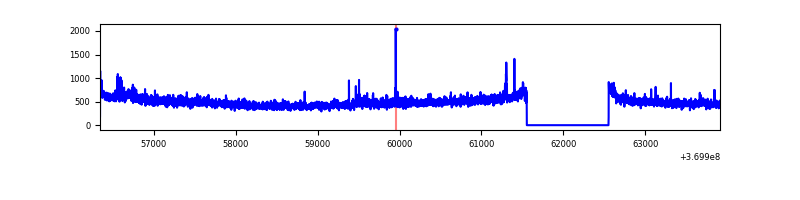 |
| B | 7571 | 6572 | 291 | 291 | 3.84% | 4.43% | 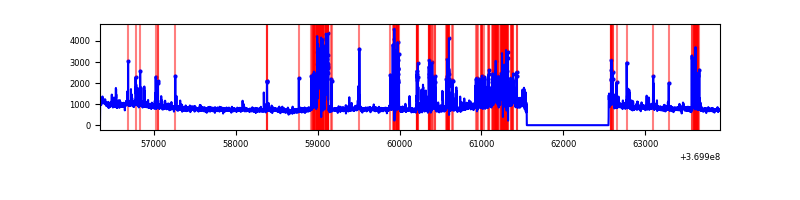 |
| C | 7571 | 6572 | 42 | 42 | 0.55% | 0.64% | 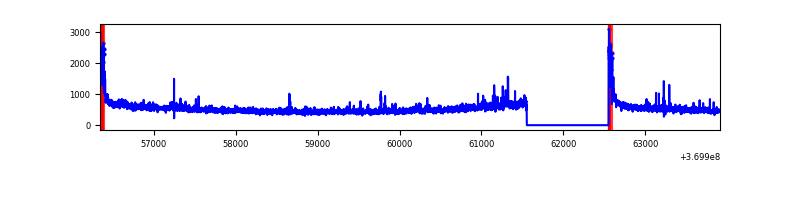 |
| D | 7571 | 6572 | 75 | 75 | 0.99% | 1.14% | 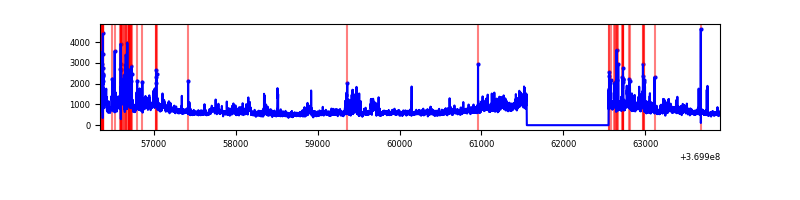 |
Top three noisy pixels from each quadrant. If the there are fewer than three noisy pixels in the level2.evt file, extra rows are filled as -1
| Pixel properties | Quadrant properties | ||||||
|---|---|---|---|---|---|---|---|
| Quadrant | DetID | PixID | Counts | Sigma | Mean | Median | Sigma |
| A | 12 | 189 | 93718 | 582.23 | 799 | 783 | 159.6 |
| A | 15 | 174 | 41455 | 254.81 | 799 | 783 | 159.6 |
| A | 13 | 6 | 23695 | 143.54 | 799 | 783 | 159.6 |
| B | 6 | 159 | 1890617 | 13147.7 | 775 | 756 | 143.7 |
| B | 10 | 245 | 785087 | 5456.57 | 775 | 756 | 143.7 |
| B | 5 | 172 | 280779 | 1948.11 | 775 | 756 | 143.7 |
| C | 0 | 10 | 146580 | 814.94 | 776 | 780 | 178.9 |
| C | 14 | 238 | 141122 | 784.43 | 776 | 780 | 178.9 |
| C | 3 | 233 | 101901 | 565.21 | 776 | 780 | 178.9 |
| D | 8 | 195 | 1319715 | 7235.33 | 769 | 750 | 182.3 |
| D | 12 | 218 | 148746 | 811.85 | 769 | 750 | 182.3 |
| D | 14 | 52 | 126754 | 691.21 | 769 | 750 | 182.3 |
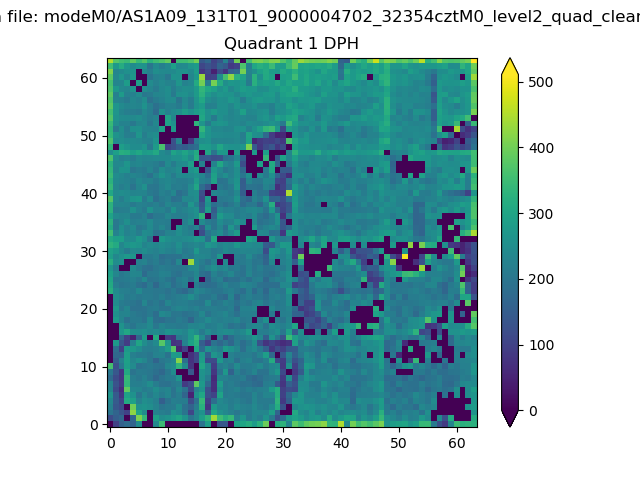
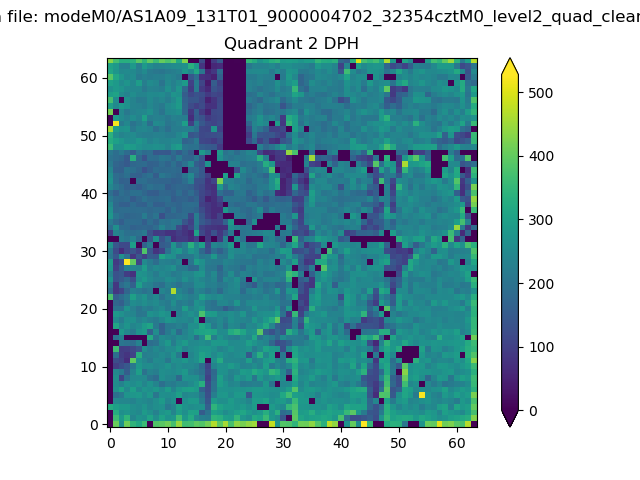
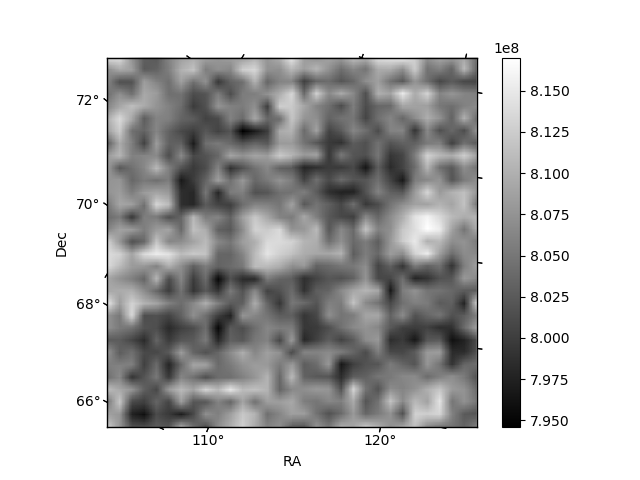
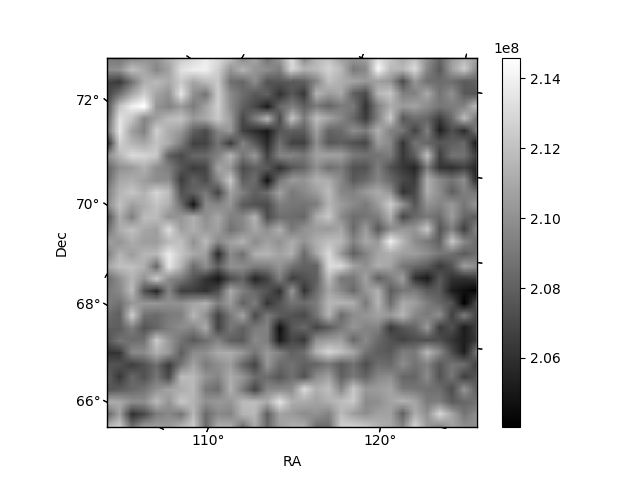
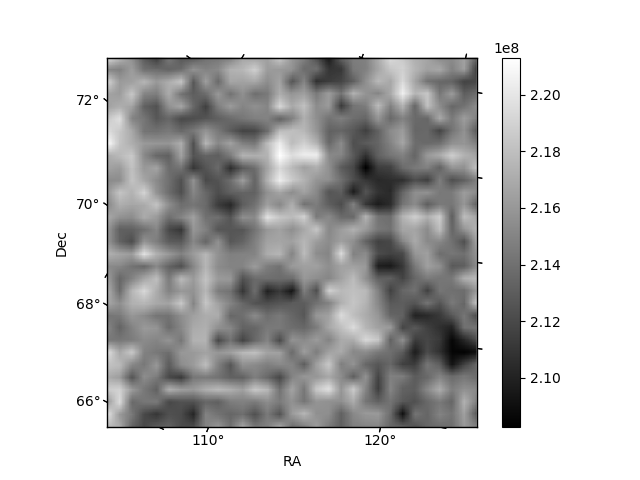
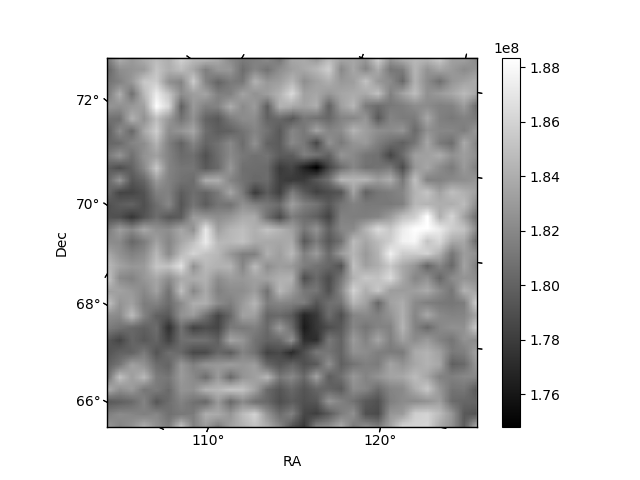
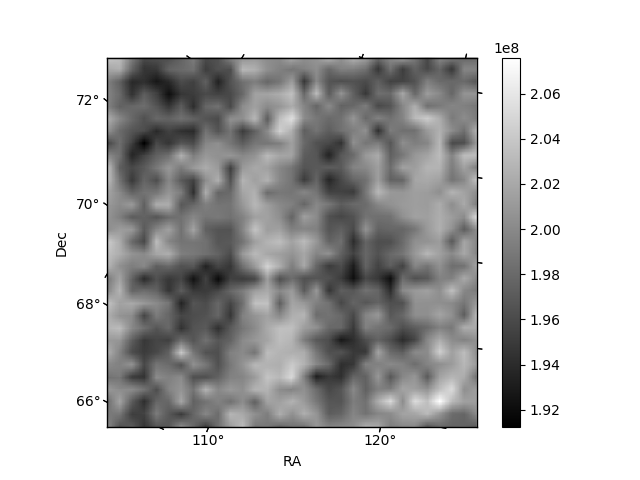
Histogram calculated using DETX and DETY for each event in the final _common_clean file
| Quadrant A |  |
 |
Quadrant B |
|---|---|---|---|
| Quadrant D | 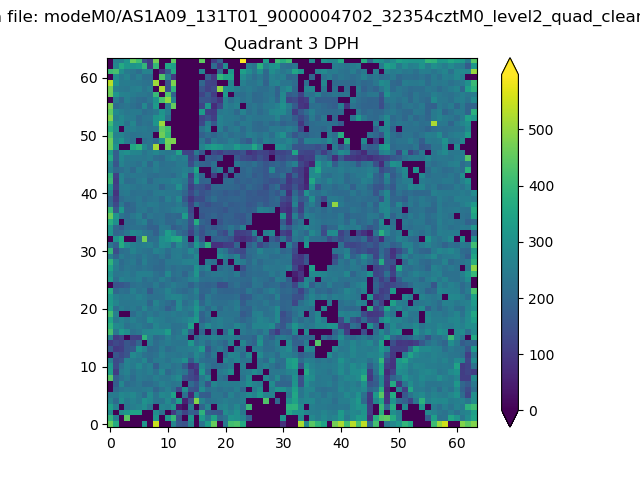 |
 |
Quadrant C |
| Plot type | Count rate plots | Images |
|---|---|---|
| Comparison with Poisson distribution Blue bars denote a histogram of data divided into 1 sec bins. Red curve is a Poisson curve with rate = median count rate of data. |
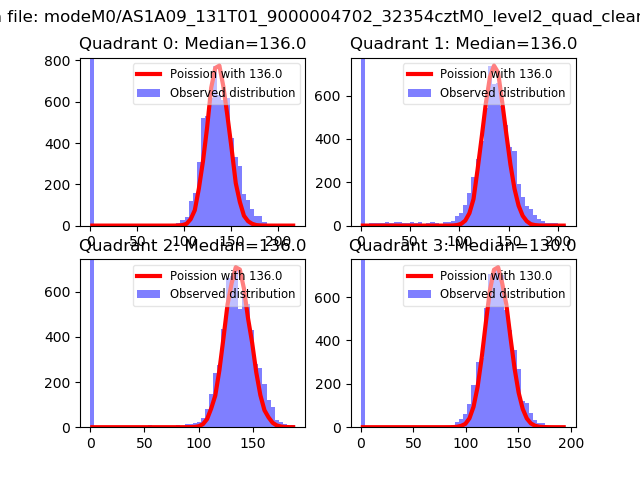 |
 |
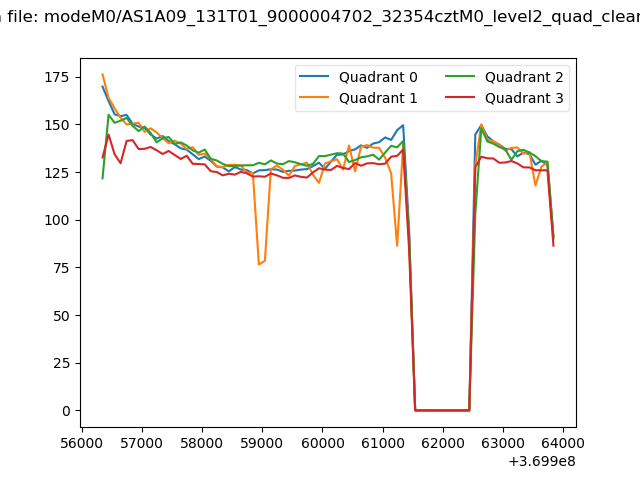
| Quadrant-wise count rates Data is divided into 100 sec bins |
 |
|
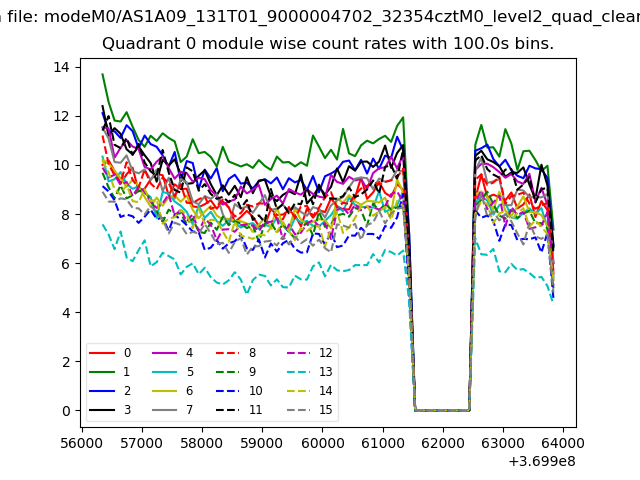
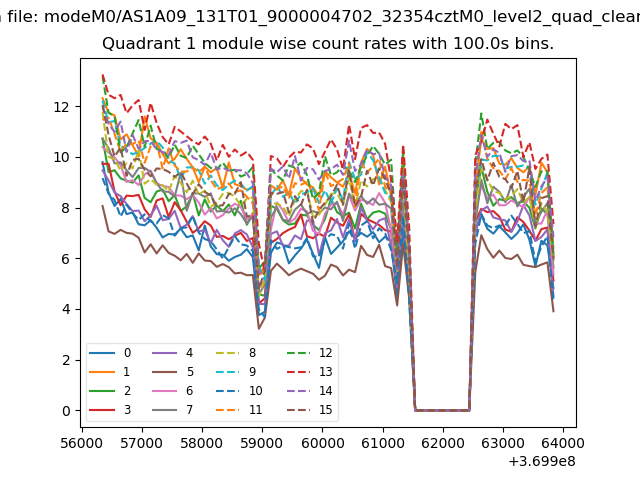
| Module-wise count rates for Quadrant A Data is divided into 100 sec bins |
 |
 |
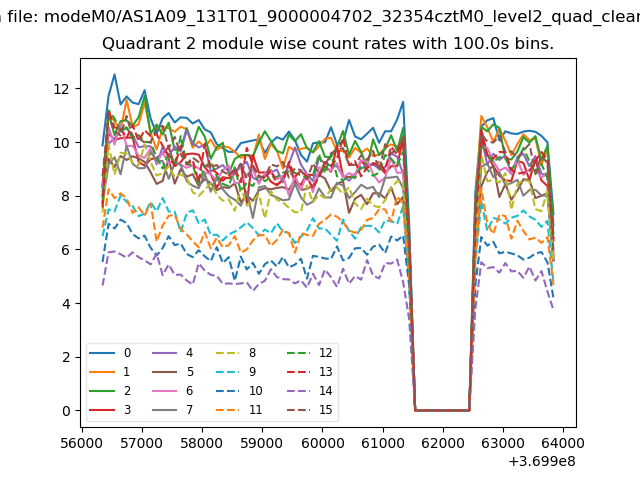
| Module-wise count rates for Quadrant B Data is divided into 100 sec bins |
 |
 |
| Module-wise count rates for Quadrant C Data is divided into 100 sec bins |
 |
 |
| Module-wise count rates for Quadrant D Data is divided into 100 sec bins |
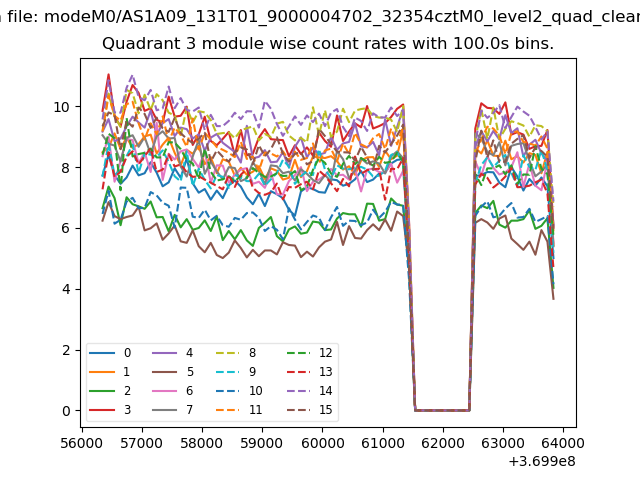 |
 |
| Parameter | Plot |
|---|---|
| CZT HV Monitor | 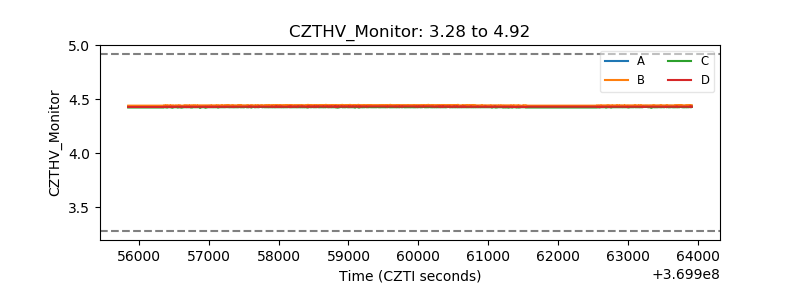 |
| D_VDD | 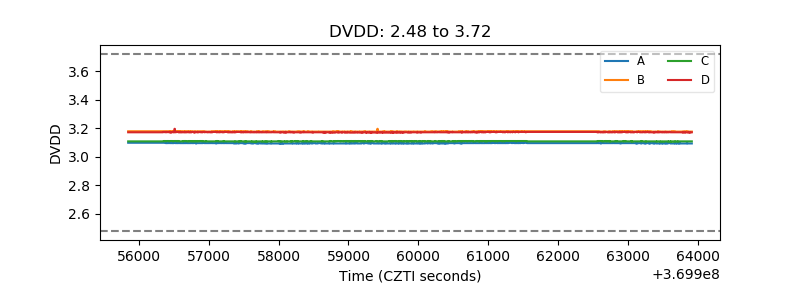 |
| Temperature 1 | 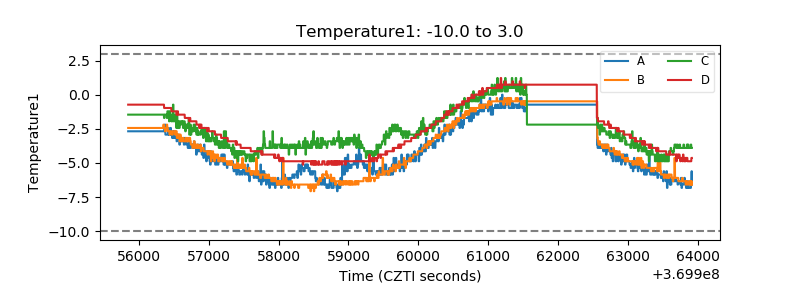 |
| Veto HV Monitor | 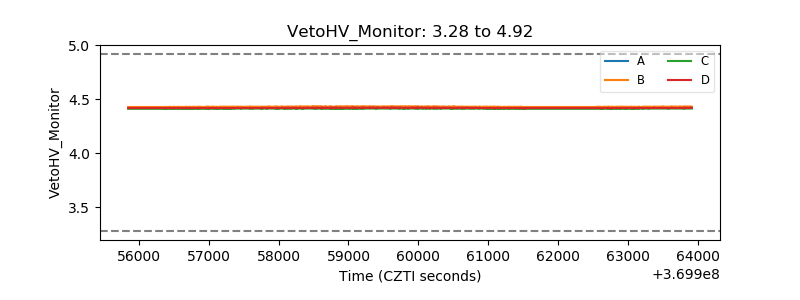 |
| Veto LLD | 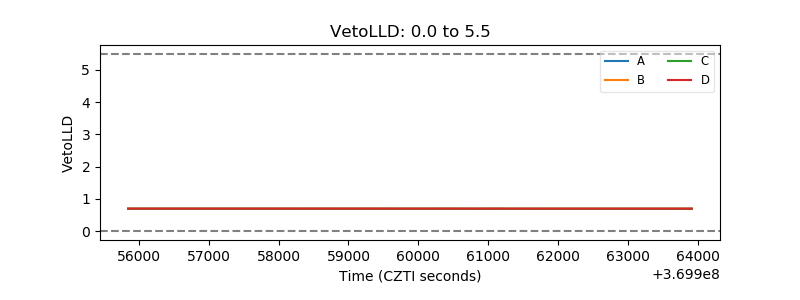 |
| Alpha Counter | 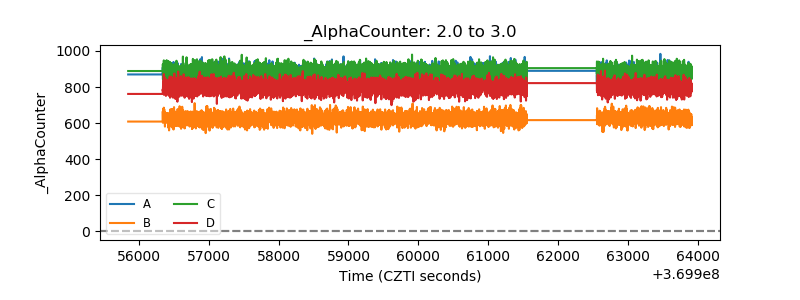 |
| _CPM_Rate | 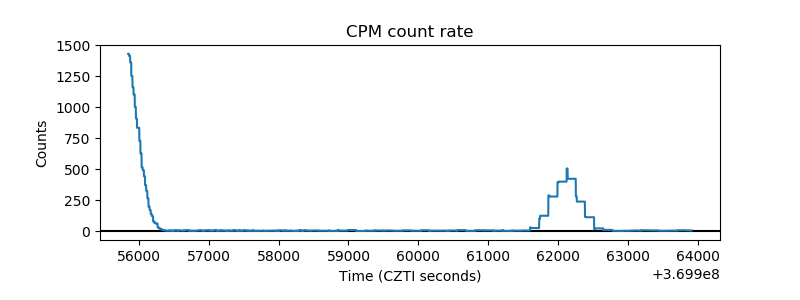 |
| CZT Counter | 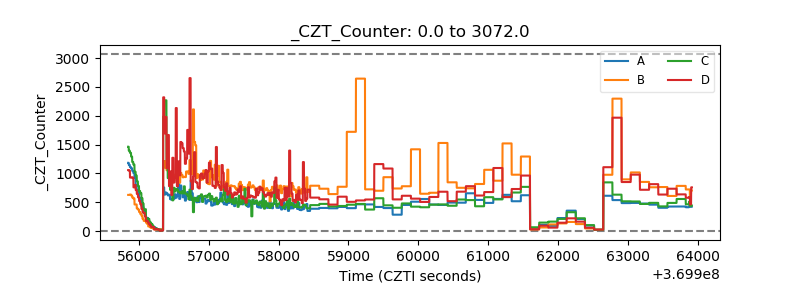 |
| +2.5 Volts monitor | 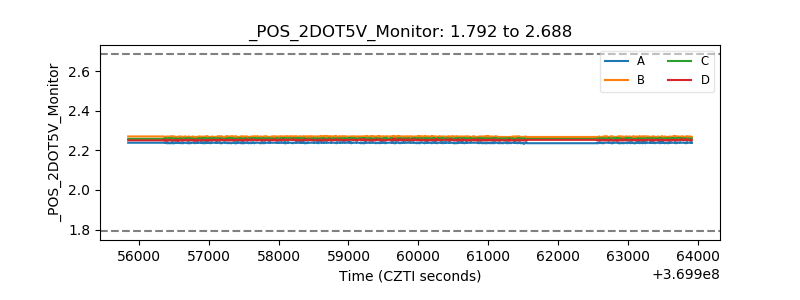 |
| +5 Volts monitor |  |
| _ROLL_ROT | 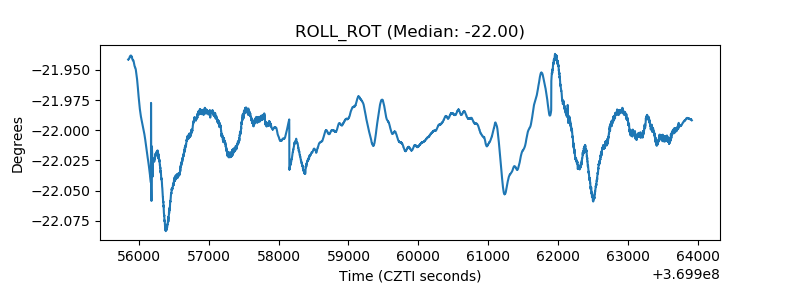 |
| _Roll_DEC | 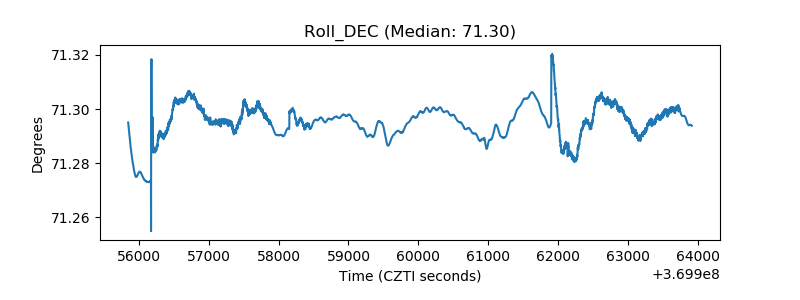 |
| _Roll_RA | 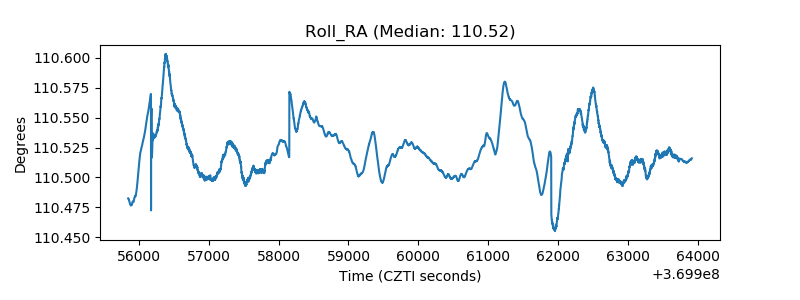 |
| Veto Counter | 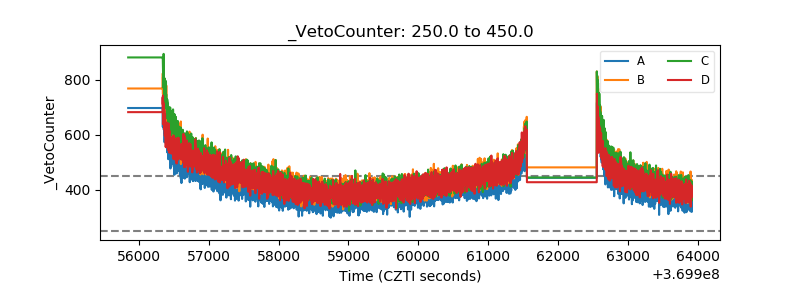 |