| Param | Original file | Final file |
|---|---|---|
| Filename | modeM0/AS1A09_131T01_9000004702_32355cztM0_level2.evt | modeM0/AS1A09_131T01_9000004702_32355cztM0_level2_quad_clean.evt |
| Size (bytes) | 663,914,880 | 137,364,480 |
| Size | 633.2 MB | 131.0 MB |
| Events in quadrant A | 3,548,517 | 932,238 |
| Events in quadrant B | 6,650,559 | 913,282 |
| Events in quadrant C | 3,922,274 | 915,951 |
| Events in quadrant D | 5,481,465 | 880,526 |
| Mode M0 | |||
|---|---|---|---|
| Quadrant | BADHDUFLAG | Total packets | Discarded packets |
| A | 0 | 15560 | 3 |
| B | 0 | 25375 | 2 |
| C | 0 | 16586 | 2 |
| D | 0 | 21465 | 2 |
| Mode SS | |||
|---|---|---|---|
| Quadrant | BADHDUFLAG | Total packets | Discarded packets |
| A | 0 | 152 | 0 |
| B | 0 | 152 | 0 |
| C | 0 | 152 | 0 |
| D | 0 | 152 | 0 |
| Mode M9 | |||
|---|---|---|---|
| Quadrant | BADHDUFLAG | Total packets | Discarded packets |
| A | 0 | 17 | 0 |
| B | 0 | 17 | 0 |
| C | 0 | 17 | 0 |
| D | 0 | 17 | 0 |
| Quadrant | Total seconds | Saturated seconds | Saturation percentage |
|---|---|---|---|
| A | 7451 | 62 | 0.832103% |
| B | 7451 | 678 | 9.099450% |
| C | 7451 | 305 | 4.093410% |
| D | 7451 | 274 | 3.677359% |
Noise dominated data is calculated using 1-second bins in cleaned event files. If a bin has >2000 counts, and if more than 50% of those come from <1% of pixels, then it is considered to be noise-dominated and hence unusable.
| Quadrant | # 1 sec bins | Bins with >0 counts | Bins with >2000 counts | High rate bins dominated by noise | Noise dominated (total time) | Noise dominated (detector-on time) | Marked lightcurve |
|---|---|---|---|---|---|---|---|
| A | 9086 | 7453 | 0 | 0 | 0.00% | 0.00% | 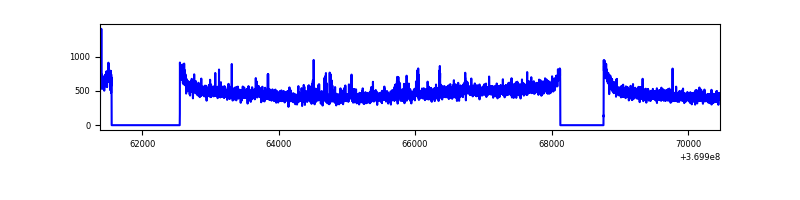 |
| B | 9086 | 7453 | 223 | 223 | 2.45% | 2.99% | 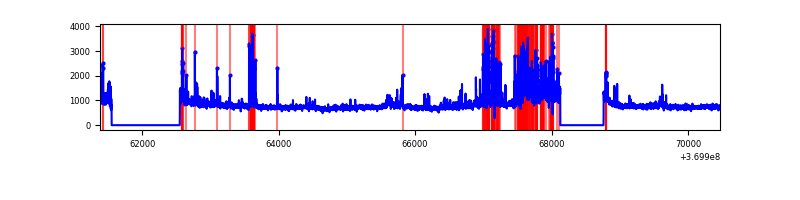 |
| C | 9086 | 7453 | 24 | 24 | 0.26% | 0.32% | 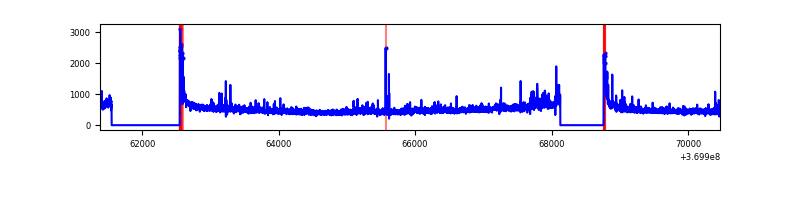 |
| D | 9086 | 7453 | 97 | 97 | 1.07% | 1.30% | 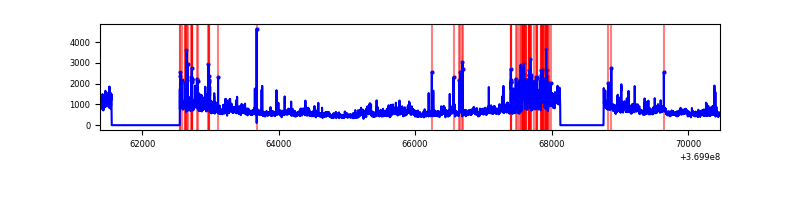 |
Top three noisy pixels from each quadrant. If the there are fewer than three noisy pixels in the level2.evt file, extra rows are filled as -1
| Pixel properties | Quadrant properties | ||||||
|---|---|---|---|---|---|---|---|
| Quadrant | DetID | PixID | Counts | Sigma | Mean | Median | Sigma |
| A | 12 | 189 | 81095 | 449.33 | 890 | 871 | 178.5 |
| A | 13 | 6 | 16104 | 85.32 | 890 | 871 | 178.5 |
| A | 13 | 254 | 15491 | 81.89 | 890 | 871 | 178.5 |
| B | 6 | 159 | 2135732 | 13023.93 | 865 | 842 | 163.9 |
| B | 5 | 172 | 739795 | 4508.0 | 865 | 842 | 163.9 |
| B | 10 | 245 | 165784 | 1006.23 | 865 | 842 | 163.9 |
| C | 0 | 10 | 158095 | 785.76 | 858 | 863 | 200.1 |
| C | 14 | 238 | 155742 | 774.0 | 858 | 863 | 200.1 |
| C | 14 | 67 | 154231 | 766.45 | 858 | 863 | 200.1 |
| D | 8 | 195 | 1263175 | 6140.95 | 857 | 833 | 205.6 |
| D | 11 | 164 | 221498 | 1073.48 | 857 | 833 | 205.6 |
| D | 12 | 218 | 184187 | 891.97 | 857 | 833 | 205.6 |
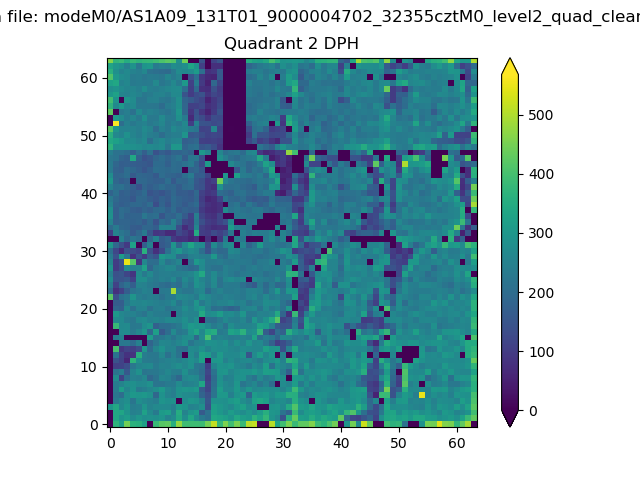
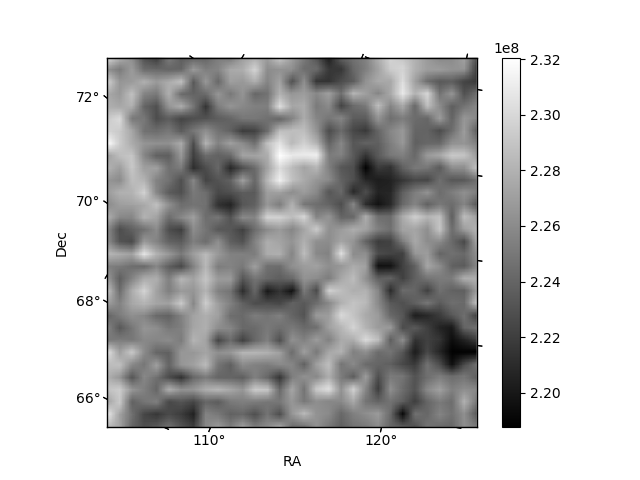
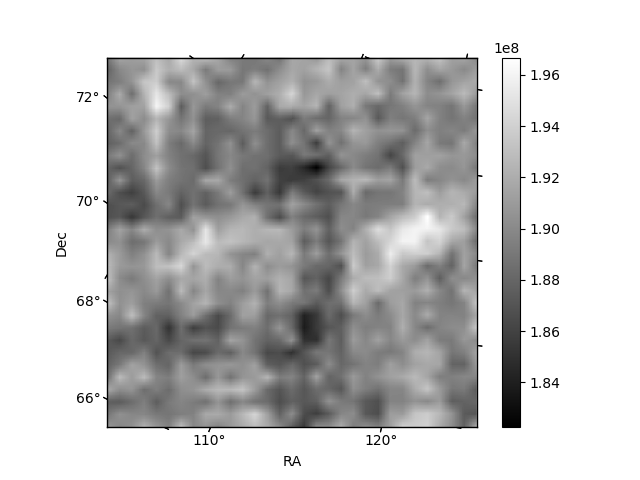
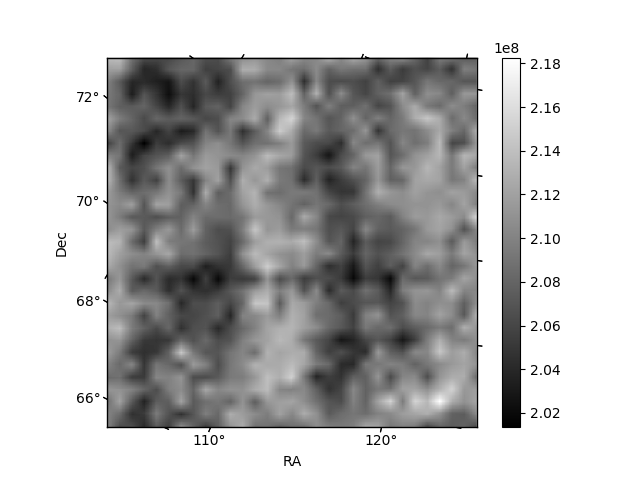
Histogram calculated using DETX and DETY for each event in the final _common_clean file
| Quadrant A |  |
 |
Quadrant B |
|---|---|---|---|
| Quadrant D | 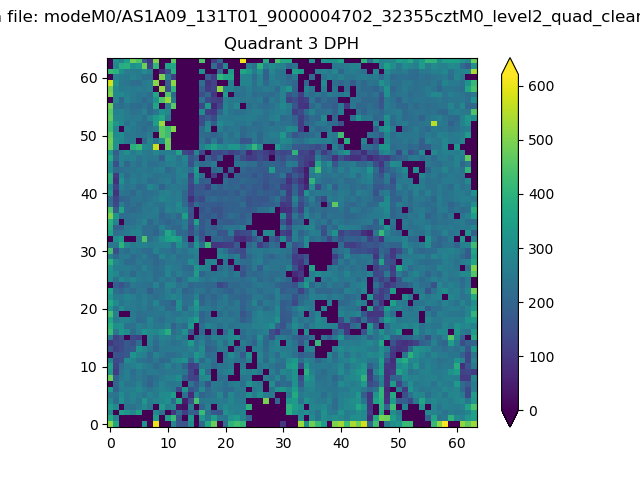 |
 |
Quadrant C |
| Plot type | Count rate plots | Images |
|---|---|---|
| Comparison with Poisson distribution Blue bars denote a histogram of data divided into 1 sec bins. Red curve is a Poisson curve with rate = median count rate of data. |
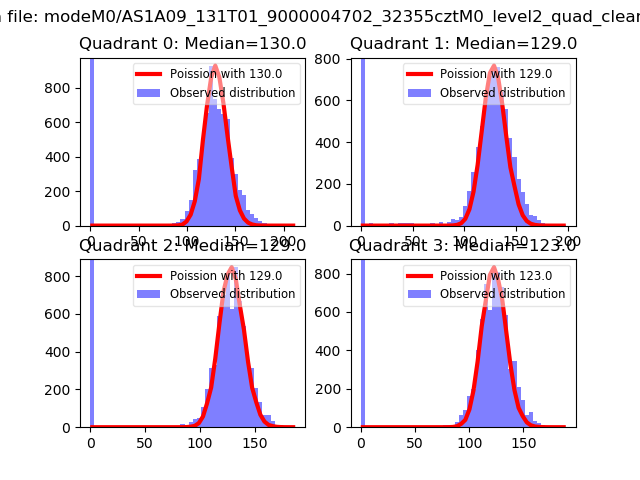 |
 |
| Quadrant-wise count rates Data is divided into 100 sec bins |
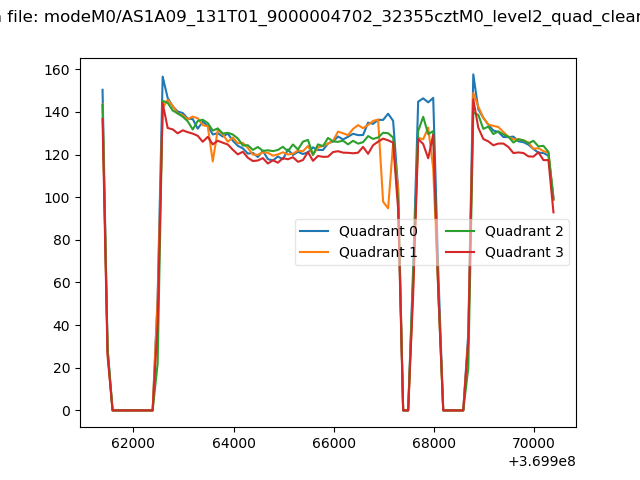 |
|
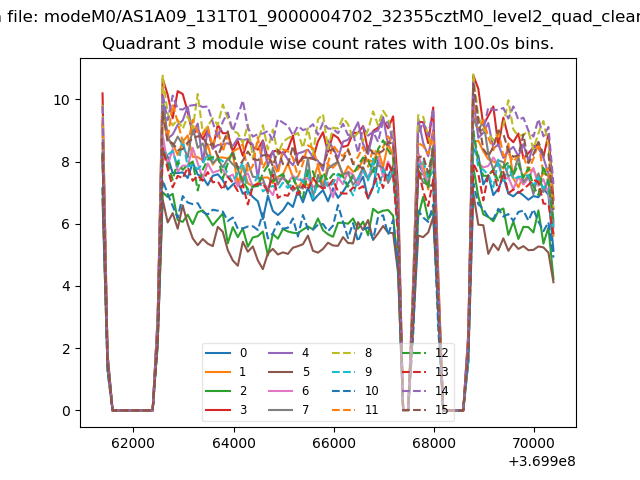
| Module-wise count rates for Quadrant A Data is divided into 100 sec bins |
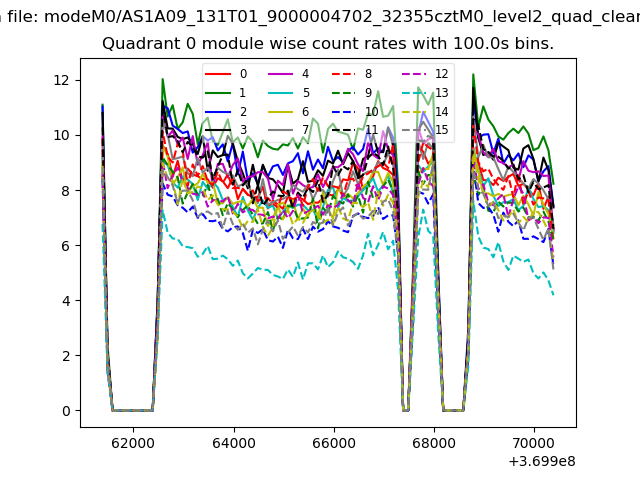 |
 |
| Module-wise count rates for Quadrant B Data is divided into 100 sec bins |
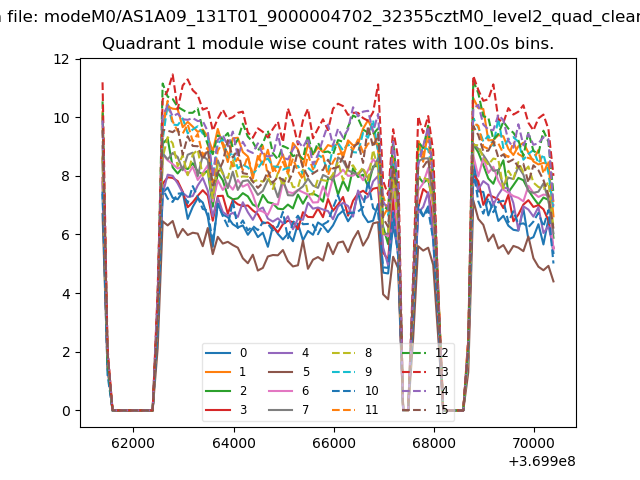 |
 |
| Module-wise count rates for Quadrant C Data is divided into 100 sec bins |
 |
 |
| Module-wise count rates for Quadrant D Data is divided into 100 sec bins |
 |
 |
| Parameter | Plot |
|---|---|
| CZT HV Monitor |  |
| D_VDD | 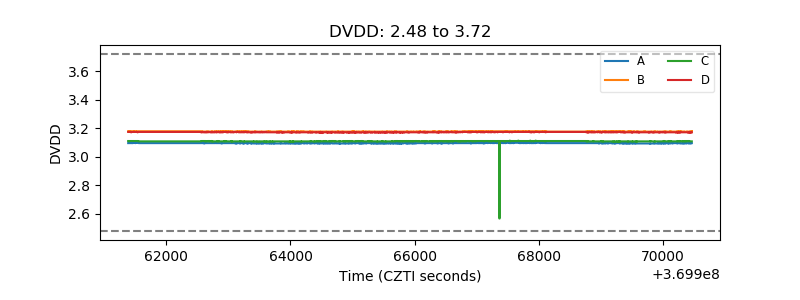 |
| Temperature 1 |  |
| Veto HV Monitor | 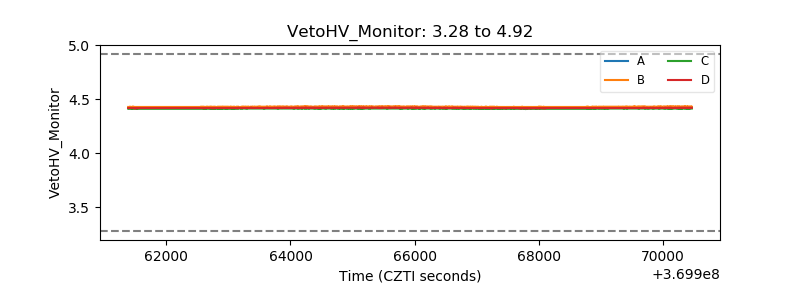 |
| Veto LLD | 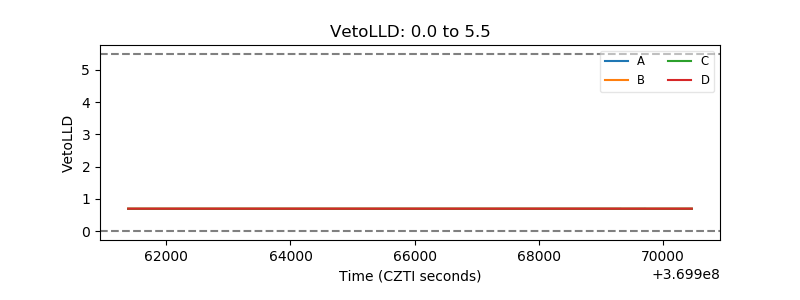 |
| Alpha Counter | 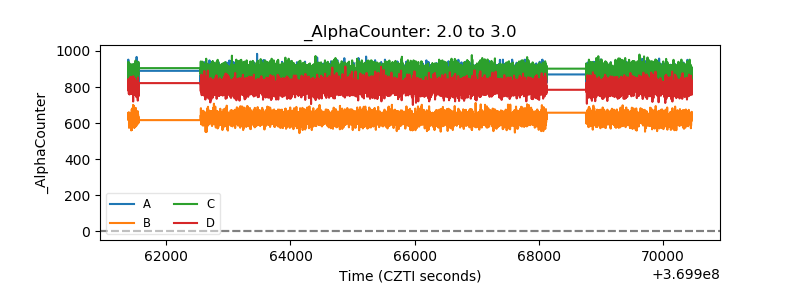 |
| _CPM_Rate | 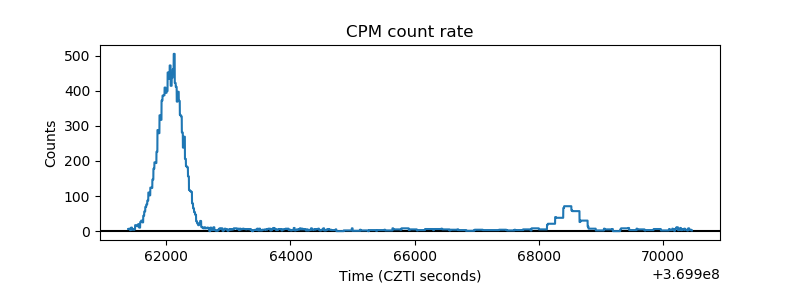 |
| CZT Counter | 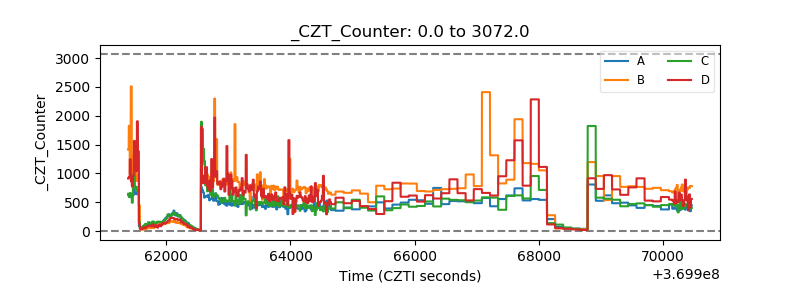 |
| +2.5 Volts monitor |  |
| +5 Volts monitor |  |
| _ROLL_ROT | 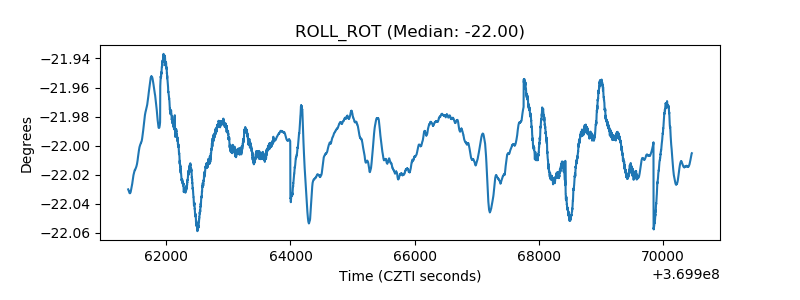 |
| _Roll_DEC | 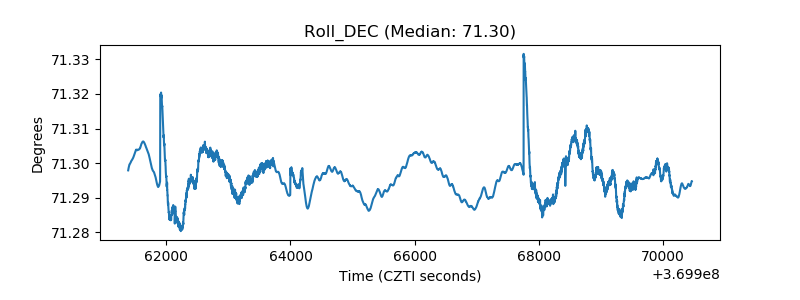 |
| _Roll_RA | 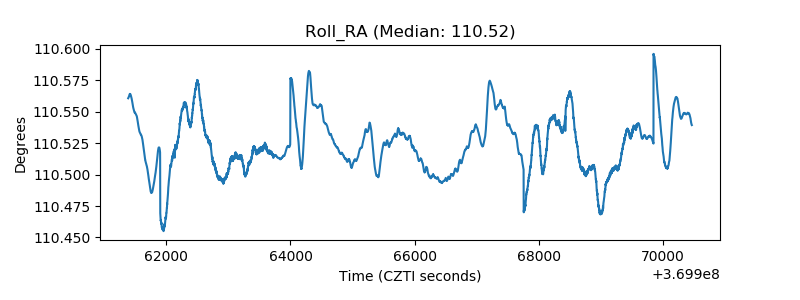 |
| Veto Counter | 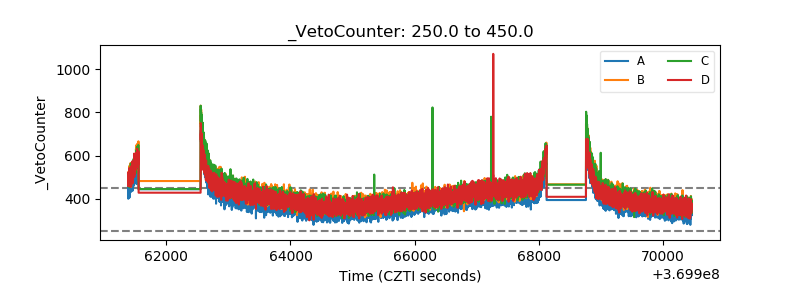 |