| Param | Original file | Final file |
|---|---|---|
| Filename | modeM0/AS1A09_131T01_9000004702_32356cztM0_level2.evt | modeM0/AS1A09_131T01_9000004702_32356cztM0_level2_quad_clean.evt |
| Size (bytes) | 716,031,360 | 143,216,640 |
| Size | 682.9 MB | 136.6 MB |
| Events in quadrant A | 3,658,195 | 975,513 |
| Events in quadrant B | 6,666,675 | 961,976 |
| Events in quadrant C | 5,167,369 | 938,505 |
| Events in quadrant D | 5,663,026 | 916,488 |
| Mode M0 | |||
|---|---|---|---|
| Quadrant | BADHDUFLAG | Total packets | Discarded packets |
| A | 0 | 16316 | 3 |
| B | 0 | 25838 | 2 |
| C | 0 | 20618 | 2 |
| D | 0 | 22078 | 2 |
| Mode SS | |||
|---|---|---|---|
| Quadrant | BADHDUFLAG | Total packets | Discarded packets |
| A | 0 | 158 | 0 |
| B | 0 | 158 | 0 |
| C | 0 | 158 | 0 |
| D | 0 | 158 | 0 |
| Mode M9 | |||
|---|---|---|---|
| Quadrant | BADHDUFLAG | Total packets | Discarded packets |
| A | 0 | 10 | 0 |
| B | 0 | 10 | 0 |
| C | 0 | 10 | 0 |
| D | 0 | 10 | 0 |
| Quadrant | Total seconds | Saturated seconds | Saturation percentage |
|---|---|---|---|
| A | 7846 | 54 | 0.688249% |
| B | 7846 | 544 | 6.933469% |
| C | 7846 | 659 | 8.399184% |
| D | 7846 | 380 | 4.843232% |
Noise dominated data is calculated using 1-second bins in cleaned event files. If a bin has >2000 counts, and if more than 50% of those come from <1% of pixels, then it is considered to be noise-dominated and hence unusable.
| Quadrant | # 1 sec bins | Bins with >0 counts | Bins with >2000 counts | High rate bins dominated by noise | Noise dominated (total time) | Noise dominated (detector-on time) | Marked lightcurve |
|---|---|---|---|---|---|---|---|
| A | 8721 | 7848 | 0 | 0 | 0.00% | 0.00% | 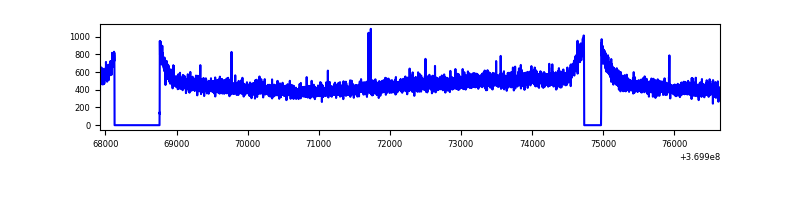 |
| B | 8721 | 7848 | 137 | 137 | 1.57% | 1.75% | 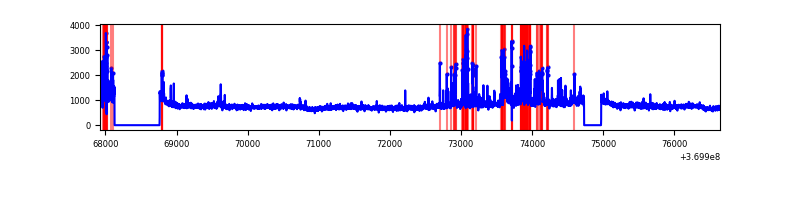 |
| C | 8721 | 7848 | 372 | 372 | 4.27% | 4.74% | 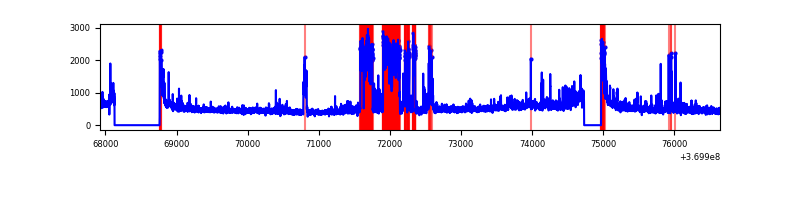 |
| D | 8721 | 7847 | 184 | 184 | 2.11% | 2.34% | 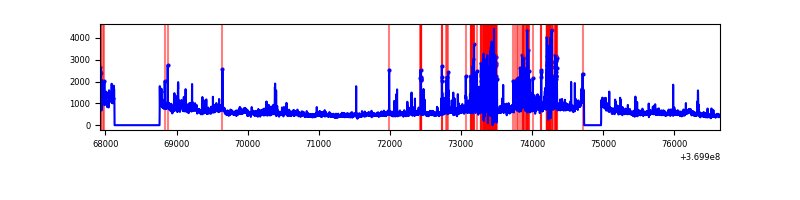 |
Top three noisy pixels from each quadrant. If the there are fewer than three noisy pixels in the level2.evt file, extra rows are filled as -1
| Pixel properties | Quadrant properties | ||||||
|---|---|---|---|---|---|---|---|
| Quadrant | DetID | PixID | Counts | Sigma | Mean | Median | Sigma |
| A | 13 | 6 | 20719 | 104.07 | 940 | 920 | 190.2 |
| A | 13 | 254 | 16265 | 80.66 | 940 | 920 | 190.2 |
| A | 3 | 137 | 9635 | 45.81 | 940 | 920 | 190.2 |
| B | 6 | 159 | 2268383 | 12838.01 | 925 | 899 | 176.6 |
| B | 5 | 172 | 544475 | 3077.61 | 925 | 899 | 176.6 |
| B | 0 | 155 | 75065 | 419.91 | 925 | 899 | 176.6 |
| C | 0 | 10 | 1356663 | 6456.2 | 896 | 901 | 210.0 |
| C | 14 | 238 | 161709 | 765.77 | 896 | 901 | 210.0 |
| C | 14 | 67 | 75152 | 353.58 | 896 | 901 | 210.0 |
| D | 8 | 195 | 1159897 | 5441.78 | 890 | 864 | 213.0 |
| D | 12 | 6 | 509429 | 2387.76 | 890 | 864 | 213.0 |
| D | 7 | 38 | 130125 | 606.89 | 890 | 864 | 213.0 |
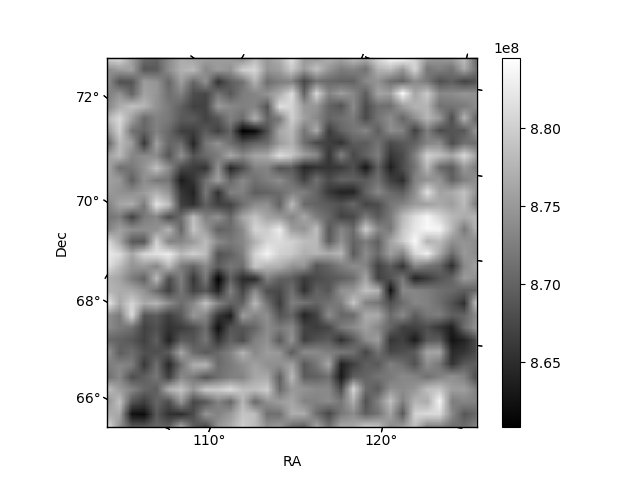
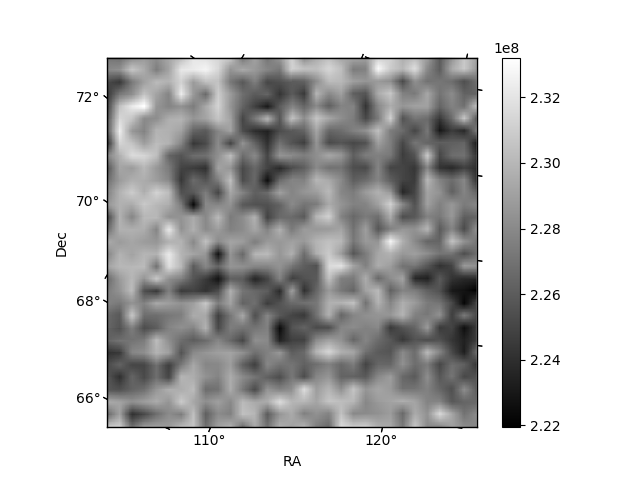
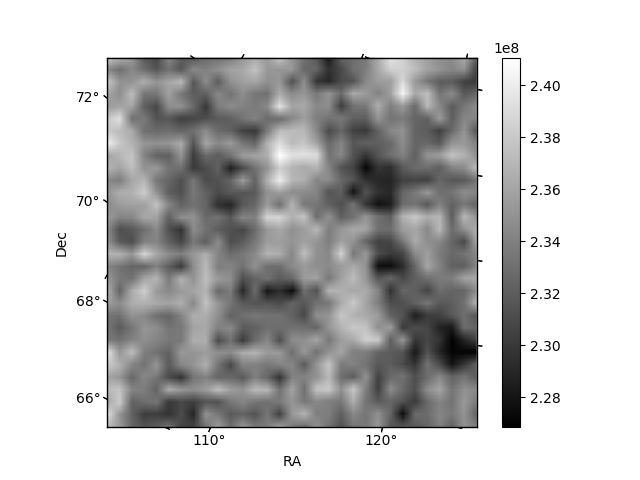
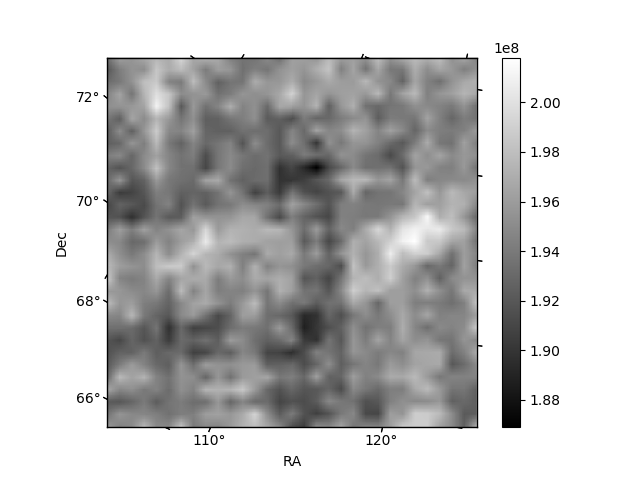
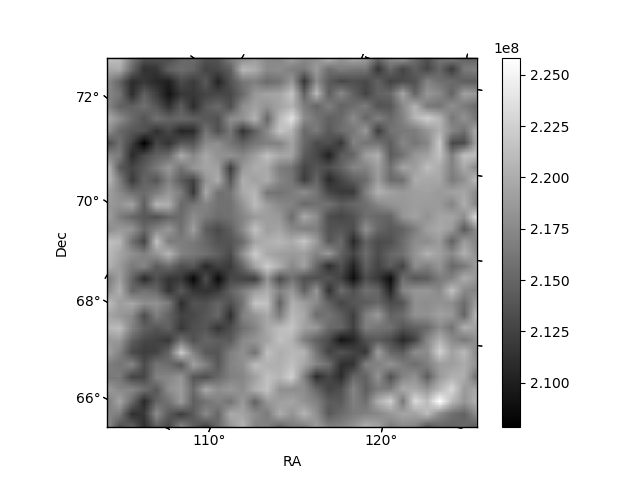
Histogram calculated using DETX and DETY for each event in the final _common_clean file
| Quadrant A | 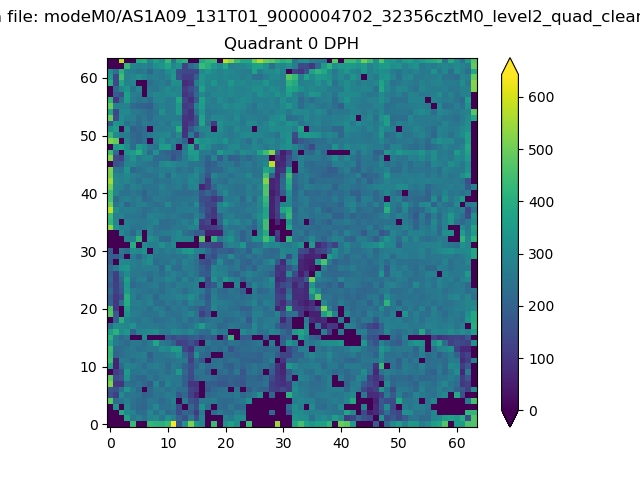 |
 |
Quadrant B |
|---|---|---|---|
| Quadrant D | 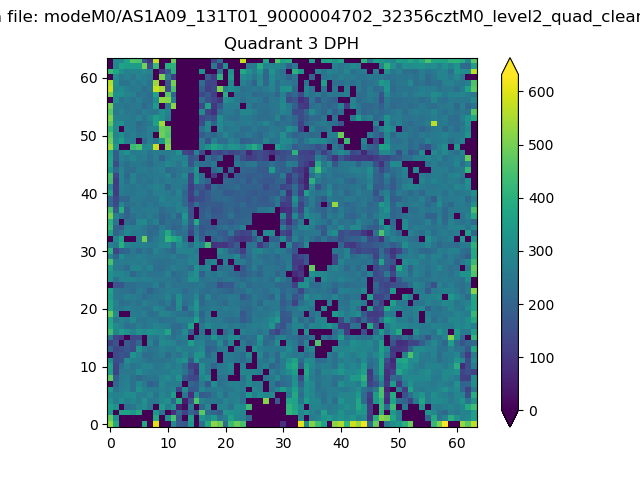 |
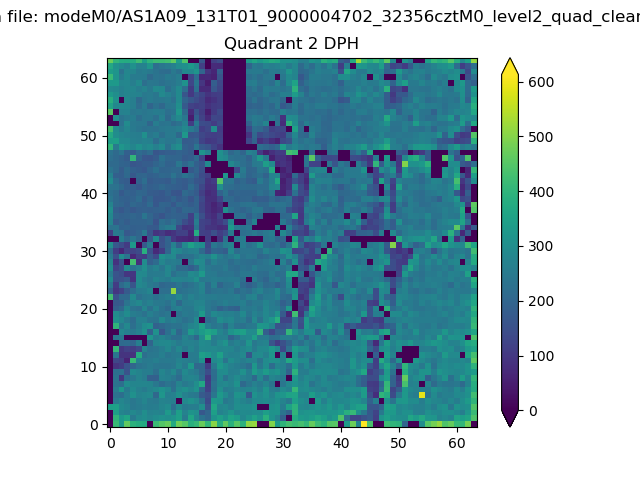 |
Quadrant C |
| Plot type | Count rate plots | Images |
|---|---|---|
| Comparison with Poisson distribution Blue bars denote a histogram of data divided into 1 sec bins. Red curve is a Poisson curve with rate = median count rate of data. |
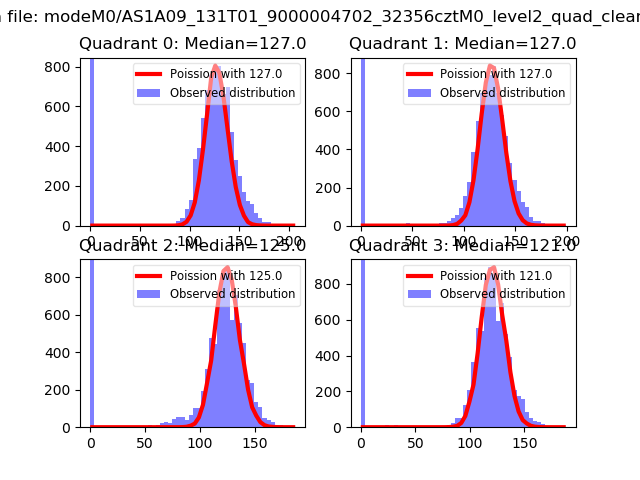 |
 |
| Quadrant-wise count rates Data is divided into 100 sec bins |
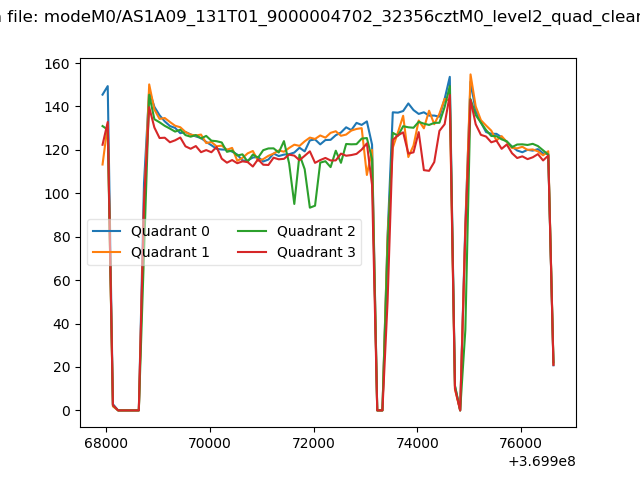 |
|
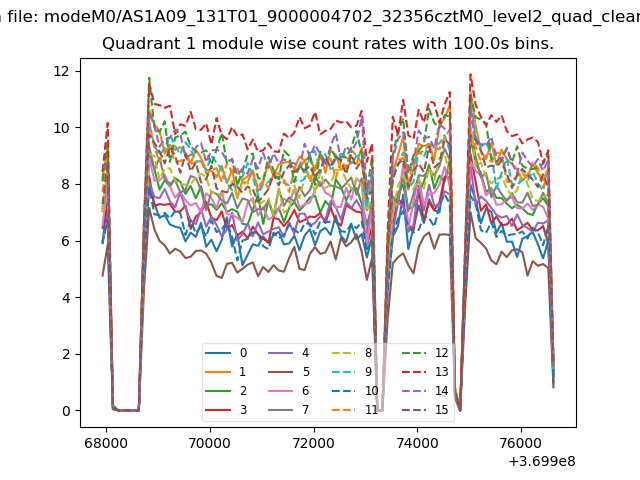
| Module-wise count rates for Quadrant A Data is divided into 100 sec bins |
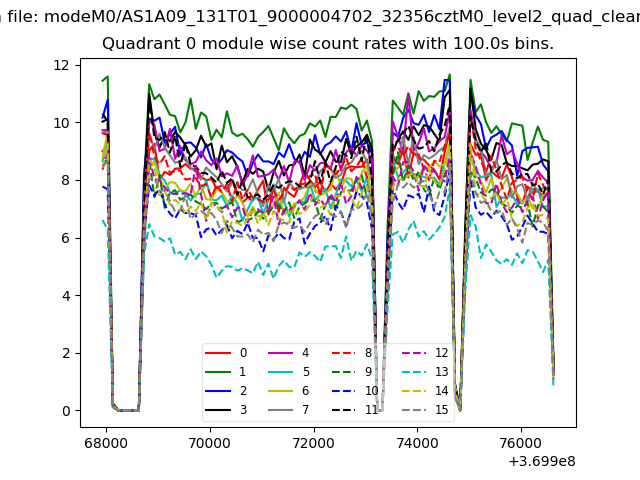 |
 |
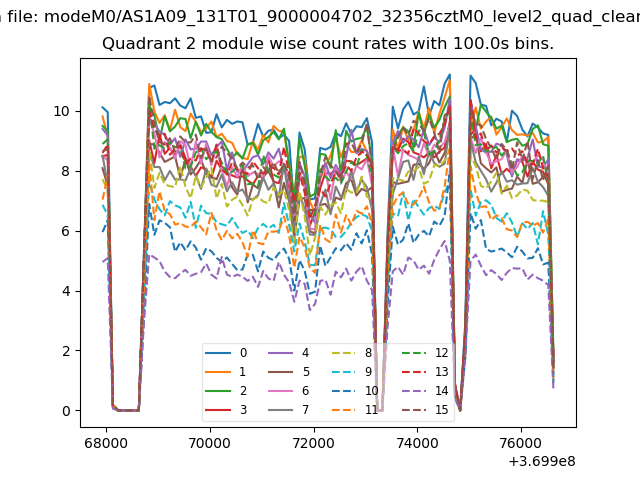
| Module-wise count rates for Quadrant B Data is divided into 100 sec bins |
 |
 |
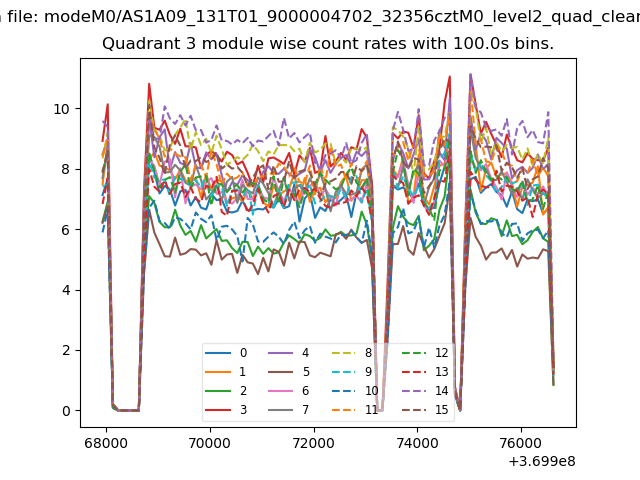
| Module-wise count rates for Quadrant C Data is divided into 100 sec bins |
 |
 |
| Module-wise count rates for Quadrant D Data is divided into 100 sec bins |
 |
 |
| Parameter | Plot |
|---|---|
| CZT HV Monitor | 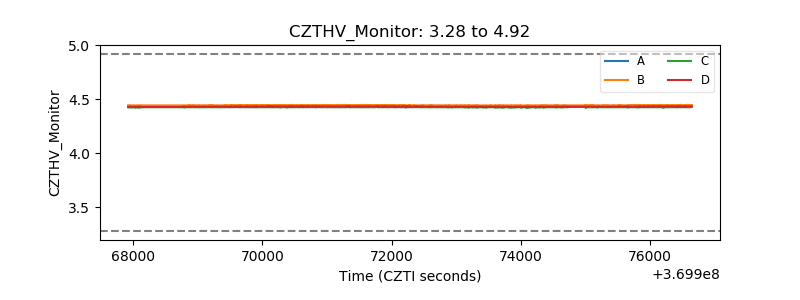 |
| D_VDD | 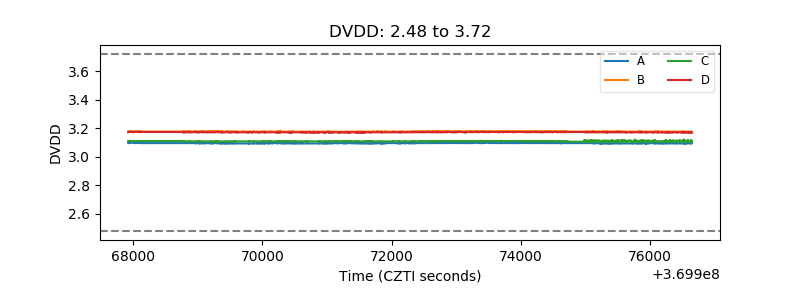 |
| Temperature 1 | 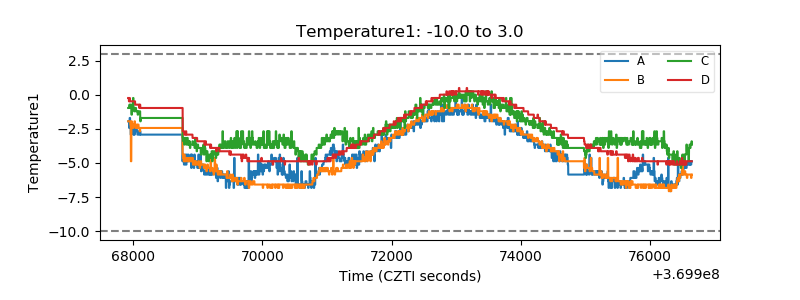 |
| Veto HV Monitor | 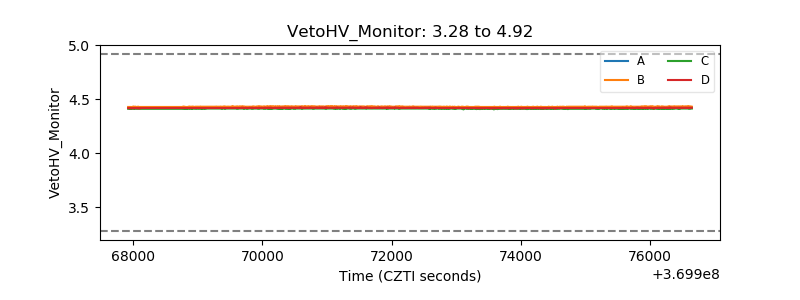 |
| Veto LLD | 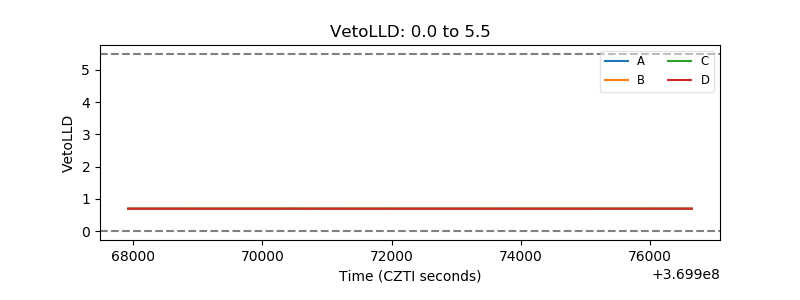 |
| Alpha Counter | 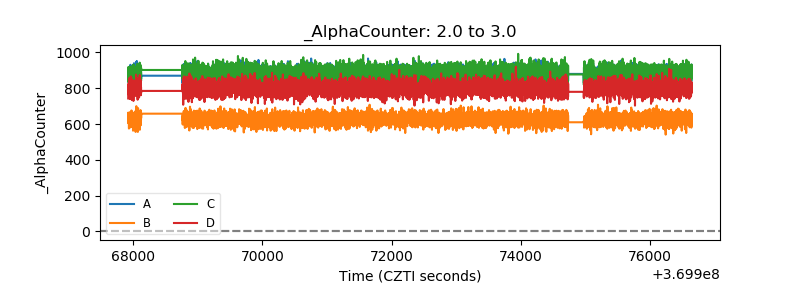 |
| _CPM_Rate | 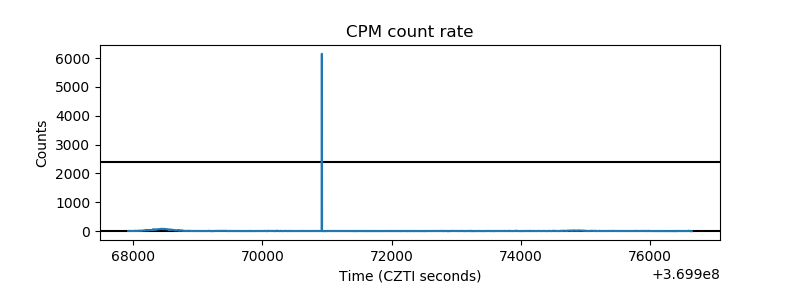 |
| CZT Counter | 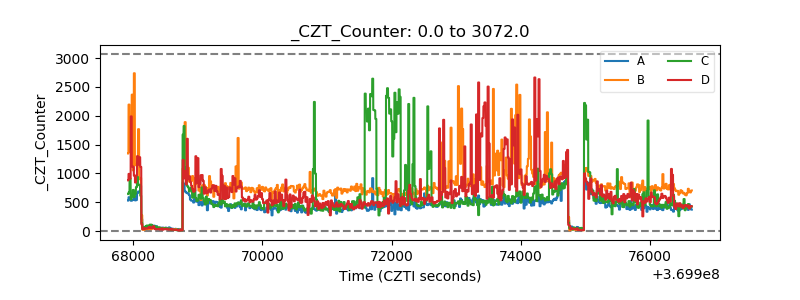 |
| +2.5 Volts monitor |  |
| +5 Volts monitor |  |
| _ROLL_ROT | 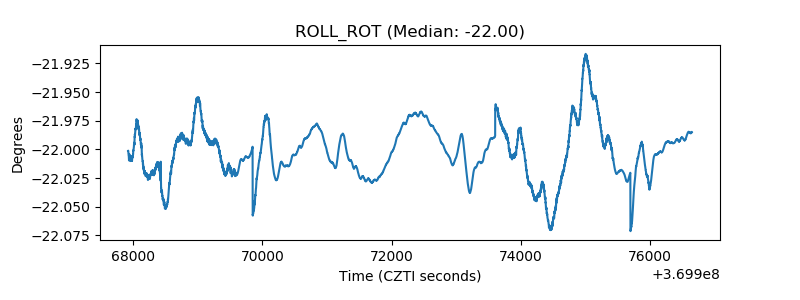 |
| _Roll_DEC | 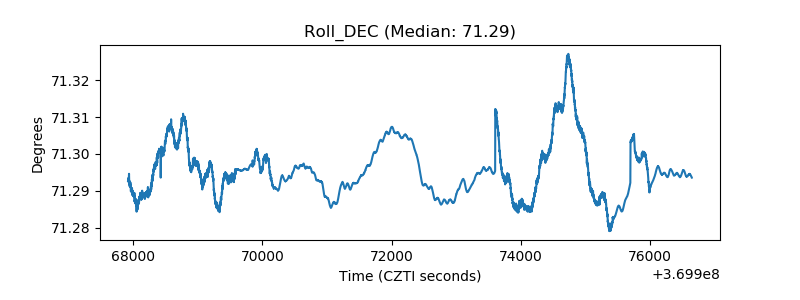 |
| _Roll_RA | 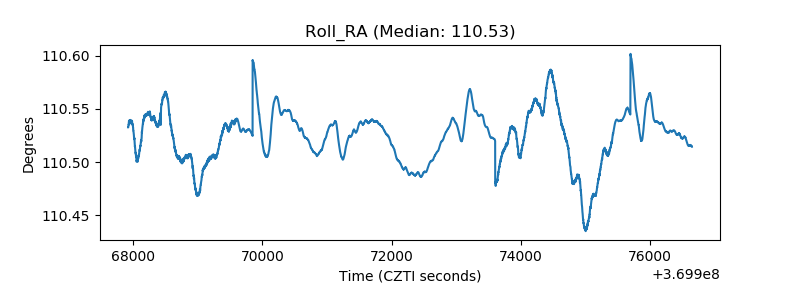 |
| Veto Counter | 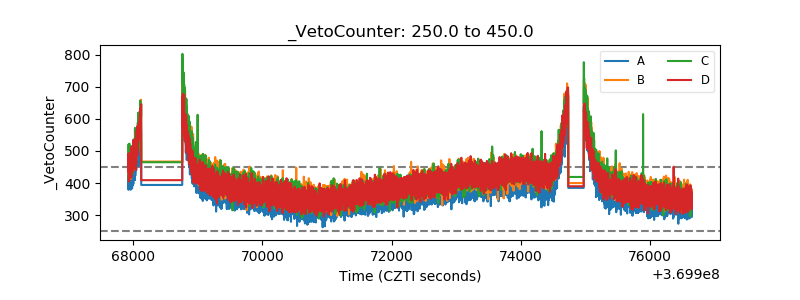 |