| Param | Original file | Final file |
|---|---|---|
| Filename | modeM0/AS1A09_131T01_9000004702_32357cztM0_level2.evt | modeM0/AS1A09_131T01_9000004702_32357cztM0_level2_quad_clean.evt |
| Size (bytes) | 694,224,000 | 139,544,640 |
| Size | 662.1 MB | 133.1 MB |
| Events in quadrant A | 3,602,441 | 950,954 |
| Events in quadrant B | 6,346,423 | 944,388 |
| Events in quadrant C | 5,187,207 | 890,155 |
| Events in quadrant D | 5,364,635 | 901,707 |
| Mode M0 | |||
|---|---|---|---|
| Quadrant | BADHDUFLAG | Total packets | Discarded packets |
| A | 0 | 16061 | 4 |
| B | 0 | 24734 | 3 |
| C | 0 | 20496 | 3 |
| D | 0 | 21137 | 3 |
| Mode SS | |||
|---|---|---|---|
| Quadrant | BADHDUFLAG | Total packets | Discarded packets |
| A | 0 | 160 | 0 |
| B | 0 | 160 | 0 |
| C | 0 | 160 | 0 |
| D | 0 | 160 | 0 |
| Mode M9 | |||
|---|---|---|---|
| Quadrant | BADHDUFLAG | Total packets | Discarded packets |
| A | 0 | 5 | 0 |
| B | 0 | 5 | 0 |
| C | 0 | 5 | 0 |
| D | 0 | 5 | 0 |
| Quadrant | Total seconds | Saturated seconds | Saturation percentage |
|---|---|---|---|
| A | 7751 | 130 | 1.677203% |
| B | 7751 | 419 | 5.405754% |
| C | 7751 | 748 | 9.650368% |
| D | 7751 | 216 | 2.786737% |
Noise dominated data is calculated using 1-second bins in cleaned event files. If a bin has >2000 counts, and if more than 50% of those come from <1% of pixels, then it is considered to be noise-dominated and hence unusable.
| Quadrant | # 1 sec bins | Bins with >0 counts | Bins with >2000 counts | High rate bins dominated by noise | Noise dominated (total time) | Noise dominated (detector-on time) | Marked lightcurve |
|---|---|---|---|---|---|---|---|
| A | 8166 | 7755 | 0 | 0 | 0.00% | 0.00% | 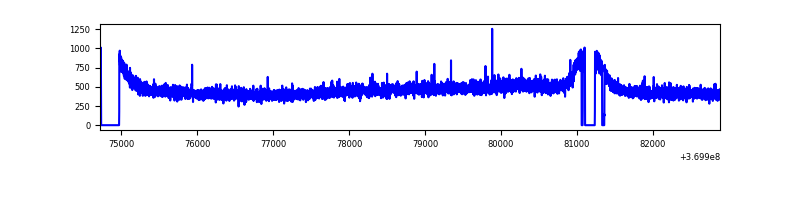 |
| B | 8166 | 7755 | 70 | 70 | 0.86% | 0.90% | 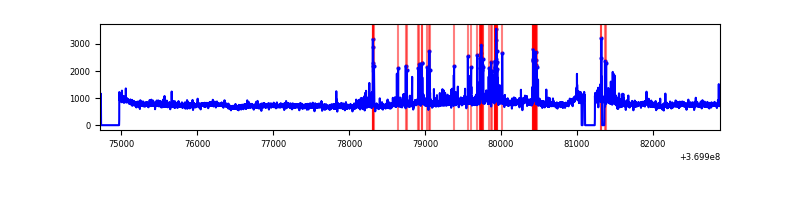 |
| C | 8166 | 7755 | 418 | 418 | 5.12% | 5.39% | 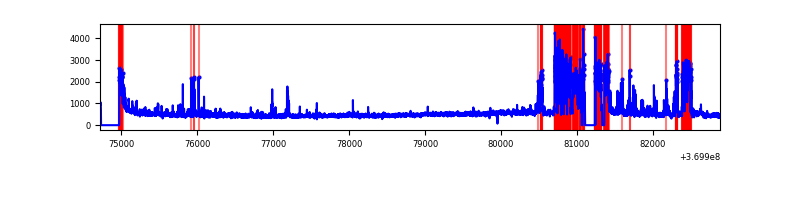 |
| D | 8166 | 7755 | 97 | 97 | 1.19% | 1.25% | 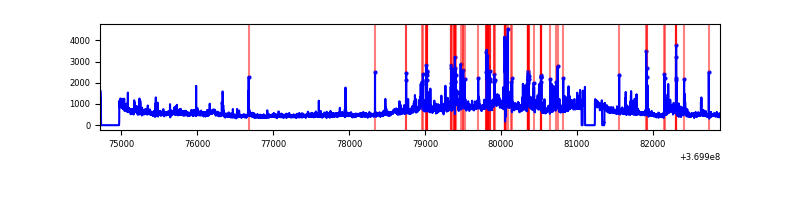 |
Top three noisy pixels from each quadrant. If the there are fewer than three noisy pixels in the level2.evt file, extra rows are filled as -1
| Pixel properties | Quadrant properties | ||||||
|---|---|---|---|---|---|---|---|
| Quadrant | DetID | PixID | Counts | Sigma | Mean | Median | Sigma |
| A | 13 | 6 | 29479 | 153.66 | 925 | 902 | 186.0 |
| A | 13 | 254 | 15393 | 77.92 | 925 | 902 | 186.0 |
| A | 3 | 137 | 9642 | 47.0 | 925 | 902 | 186.0 |
| B | 6 | 159 | 2195904 | 12453.02 | 913 | 888 | 176.3 |
| B | 10 | 245 | 224027 | 1265.94 | 913 | 888 | 176.3 |
| B | 5 | 172 | 161400 | 910.63 | 913 | 888 | 176.3 |
| C | 0 | 10 | 1555265 | 7819.71 | 843 | 847 | 198.8 |
| C | 14 | 238 | 147816 | 739.35 | 843 | 847 | 198.8 |
| C | 2 | 16 | 72207 | 358.99 | 843 | 847 | 198.8 |
| D | 8 | 195 | 1152720 | 5398.19 | 888 | 863 | 213.4 |
| D | 12 | 6 | 306394 | 1431.88 | 888 | 863 | 213.4 |
| D | 11 | 164 | 193504 | 902.81 | 888 | 863 | 213.4 |
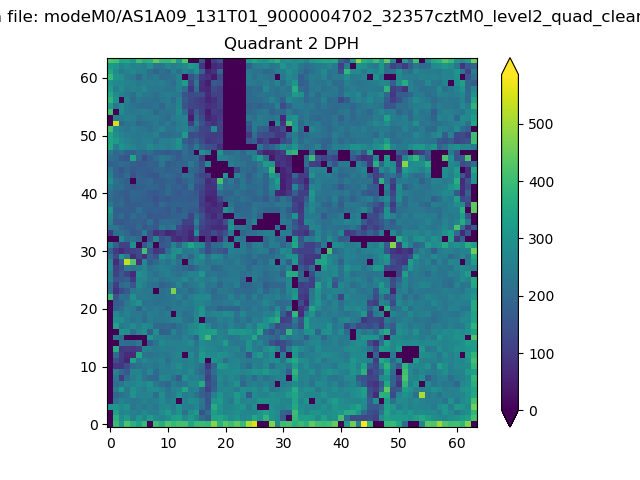
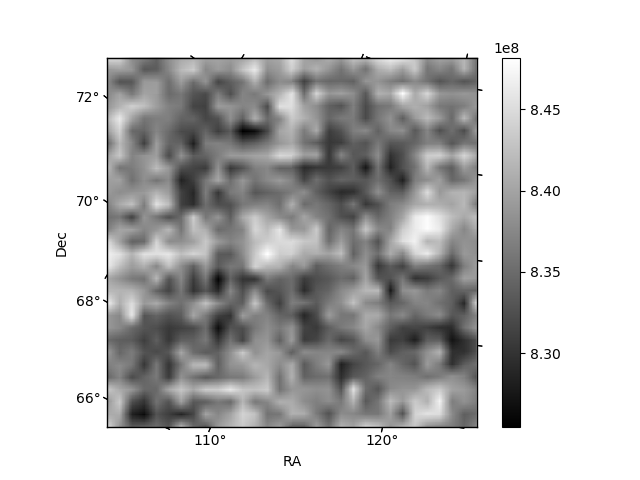
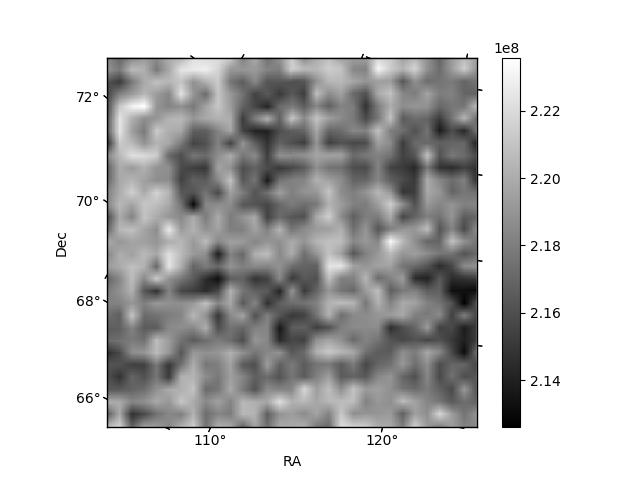
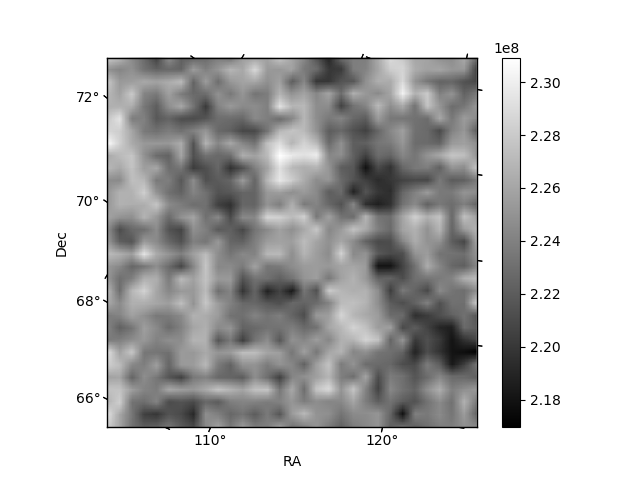
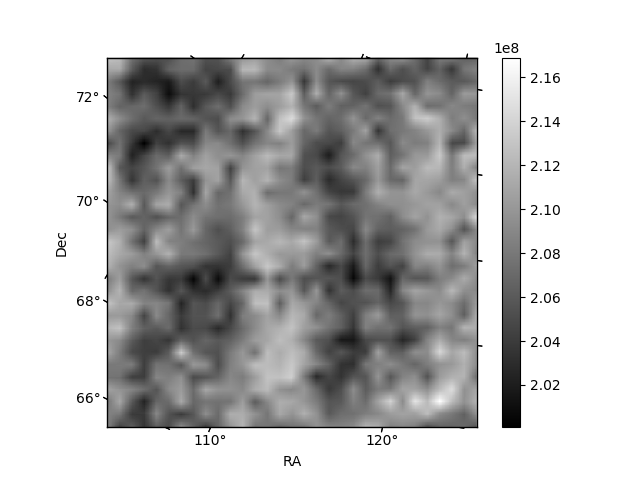
Histogram calculated using DETX and DETY for each event in the final _common_clean file
| Quadrant A | 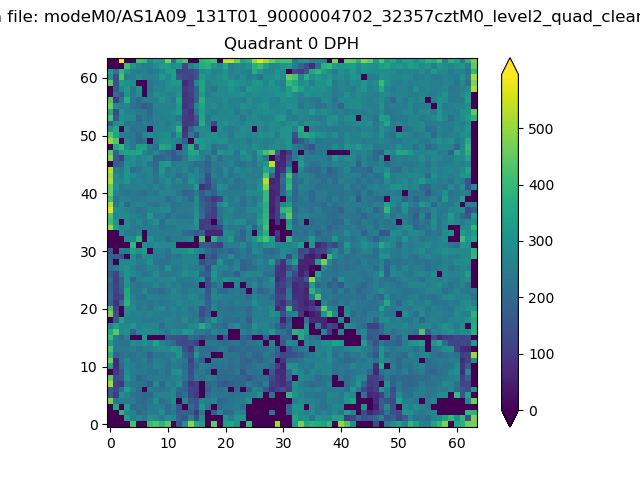 |
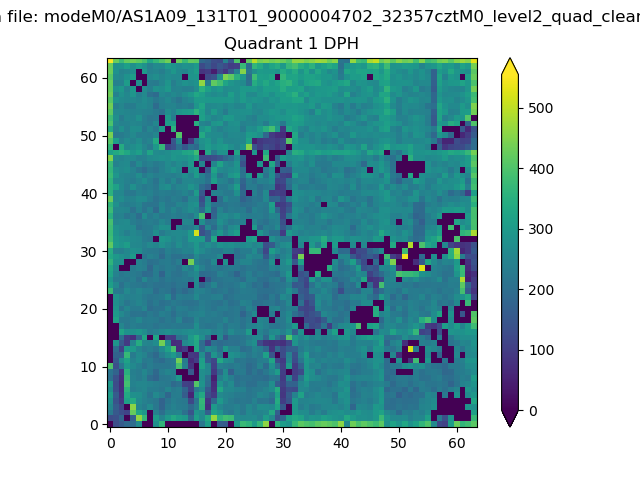 |
Quadrant B |
|---|---|---|---|
| Quadrant D | 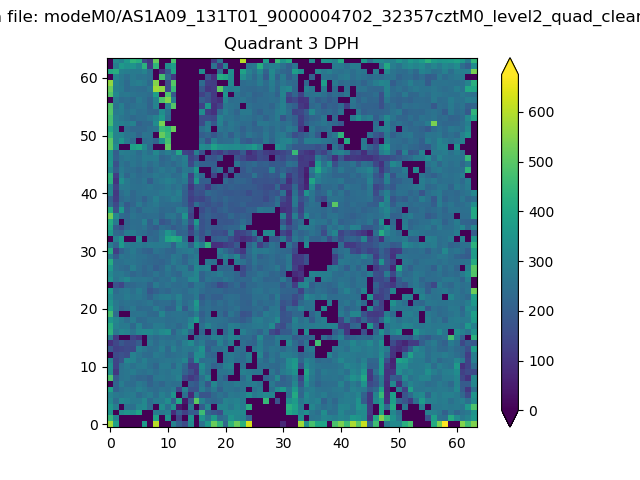 |
 |
Quadrant C |
| Plot type | Count rate plots | Images |
|---|---|---|
| Comparison with Poisson distribution Blue bars denote a histogram of data divided into 1 sec bins. Red curve is a Poisson curve with rate = median count rate of data. |
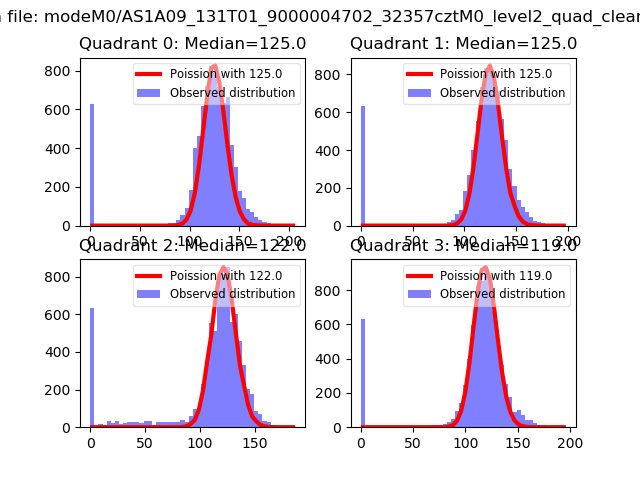 |
 |
| Quadrant-wise count rates Data is divided into 100 sec bins |
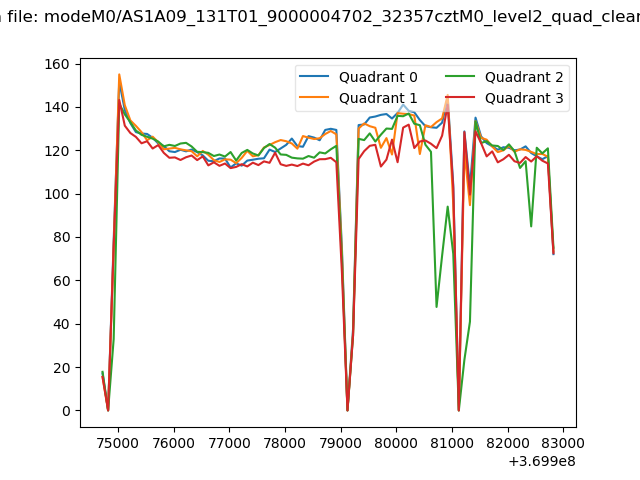 |
|
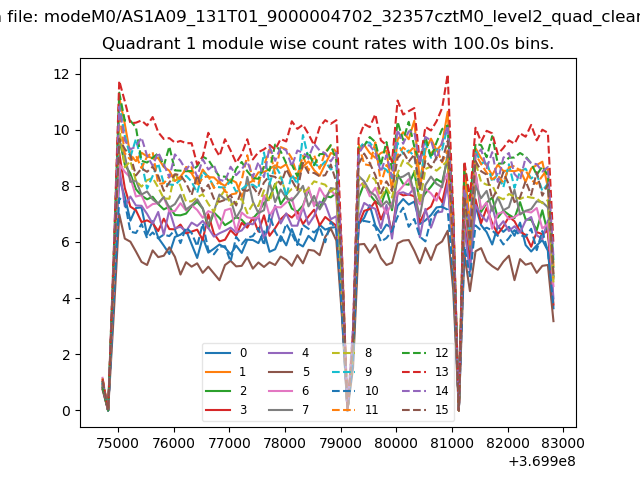
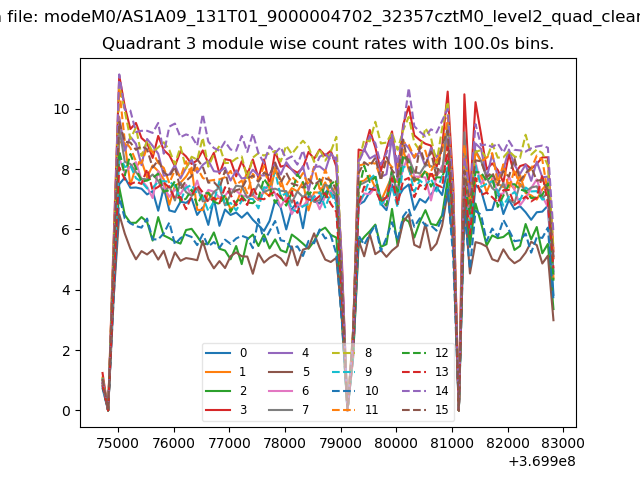
| Module-wise count rates for Quadrant A Data is divided into 100 sec bins |
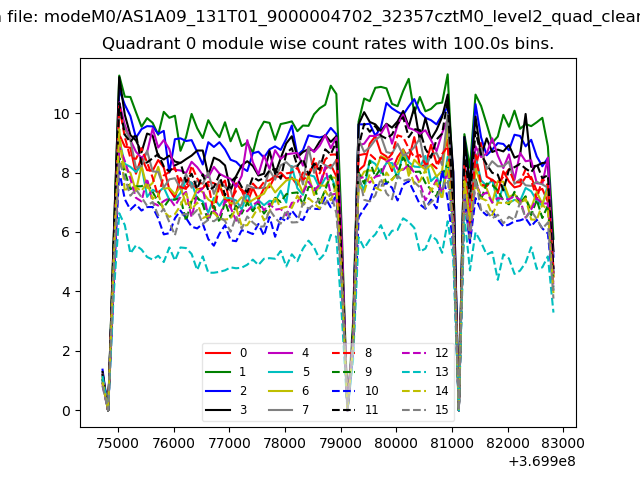 |
 |
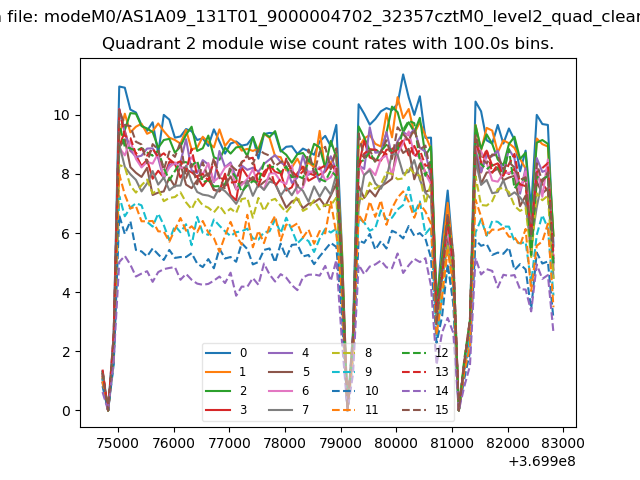
| Module-wise count rates for Quadrant B Data is divided into 100 sec bins |
 |
 |
| Module-wise count rates for Quadrant C Data is divided into 100 sec bins |
 |
 |
| Module-wise count rates for Quadrant D Data is divided into 100 sec bins |
 |
 |
| Parameter | Plot |
|---|---|
| CZT HV Monitor | 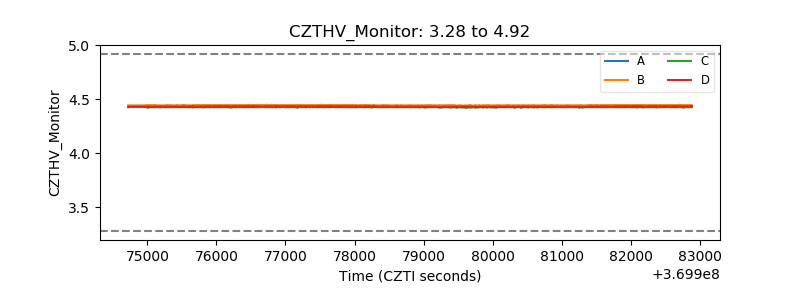 |
| D_VDD | 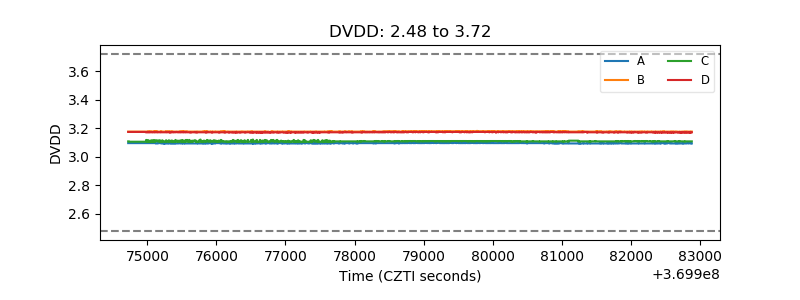 |
| Temperature 1 | 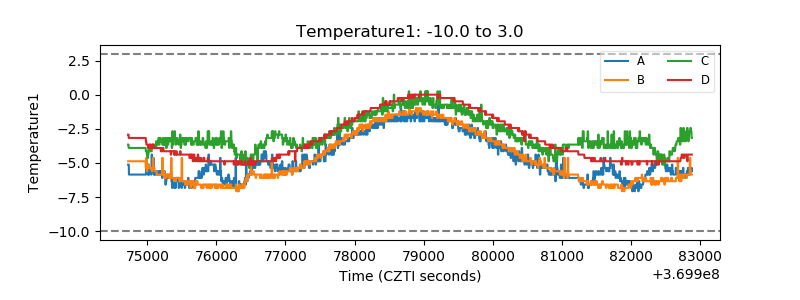 |
| Veto HV Monitor | 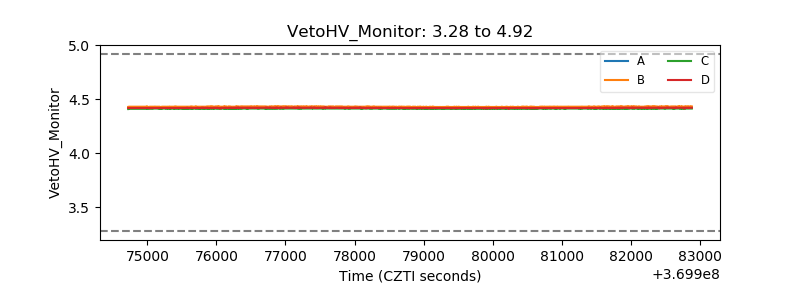 |
| Veto LLD |  |
| Alpha Counter | 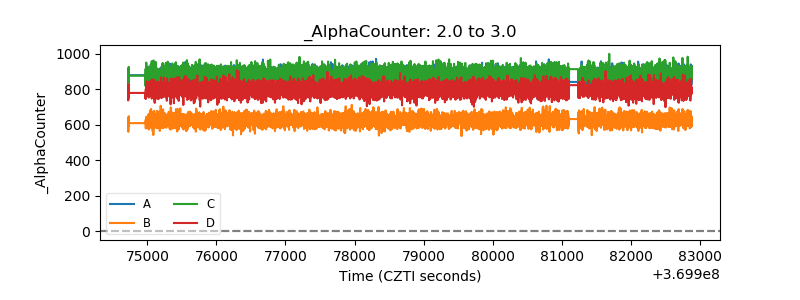 |
| _CPM_Rate | 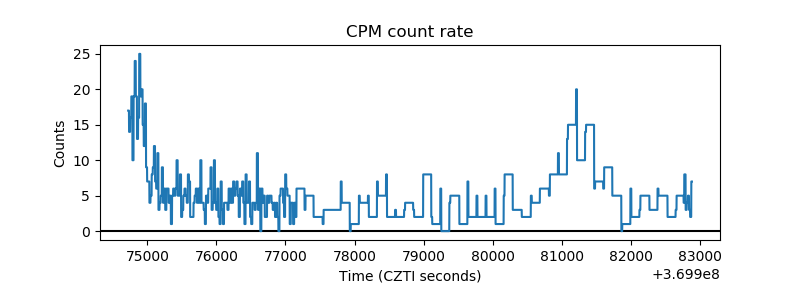 |
| CZT Counter | 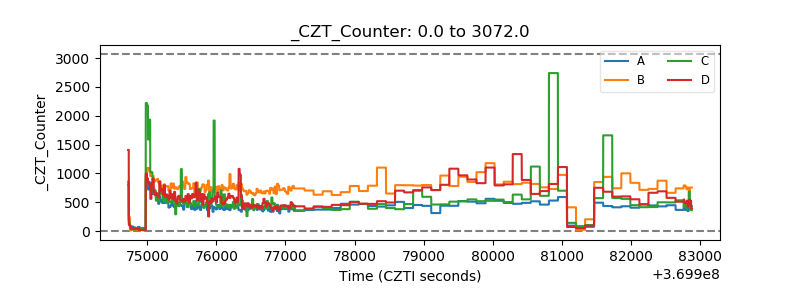 |
| +2.5 Volts monitor |  |
| +5 Volts monitor | 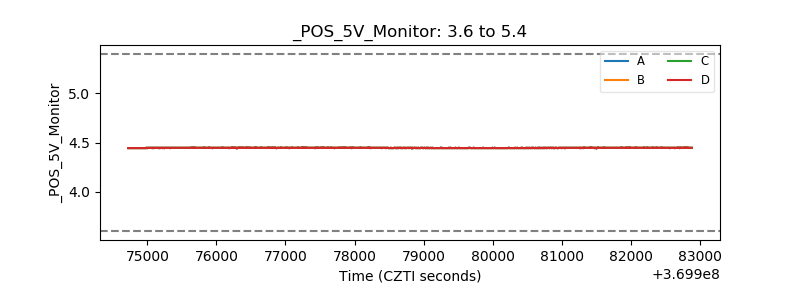 |
| _ROLL_ROT | 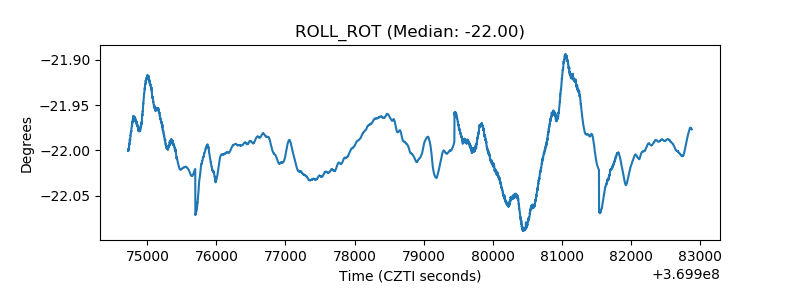 |
| _Roll_DEC | 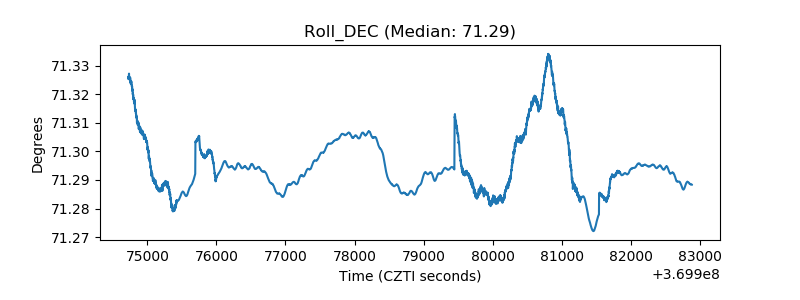 |
| _Roll_RA | 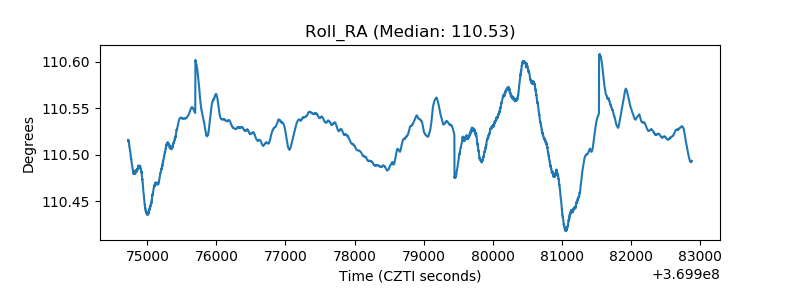 |
| Veto Counter | 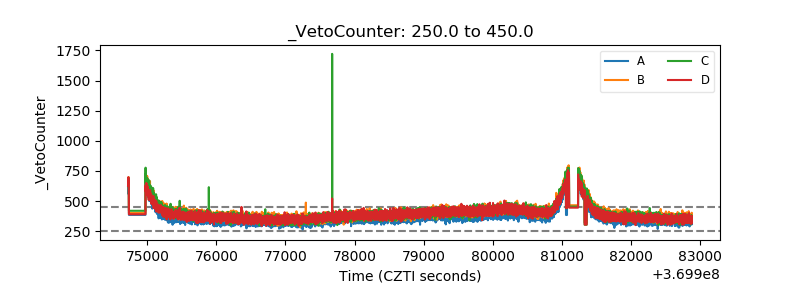 |