| Param | Original file | Final file |
|---|---|---|
| Filename | modeM0/AS1A09_131T01_9000004702_32360cztM0_level2.evt | modeM0/AS1A09_131T01_9000004702_32360cztM0_level2_quad_clean.evt |
| Size (bytes) | 1,659,490,560 | 336,251,520 |
| Size | 1.5 GB | 320.7 MB |
| Events in quadrant A | 8,479,076 | 2,288,920 |
| Events in quadrant B | 15,437,464 | 2,273,212 |
| Events in quadrant C | 10,669,104 | 2,219,416 |
| Events in quadrant D | 14,422,265 | 2,123,784 |
| Mode M0 | |||
|---|---|---|---|
| Quadrant | BADHDUFLAG | Total packets | Discarded packets |
| A | 0 | 37647 | 4 |
| B | 0 | 59861 | 3 |
| C | 0 | 43717 | 3 |
| D | 0 | 55395 | 3 |
| Mode SS | |||
|---|---|---|---|
| Quadrant | BADHDUFLAG | Total packets | Discarded packets |
| A | 0 | 374 | 0 |
| B | 0 | 374 | 0 |
| C | 0 | 374 | 0 |
| D | 0 | 374 | 0 |
| Mode M9 | |||
|---|---|---|---|
| Quadrant | BADHDUFLAG | Total packets | Discarded packets |
| A | 0 | 19 | 0 |
| B | 0 | 19 | 0 |
| C | 0 | 19 | 0 |
| D | 0 | 19 | 0 |
| Quadrant | Total seconds | Saturated seconds | Saturation percentage |
|---|---|---|---|
| A | 18581 | 141 | 0.758840% |
| B | 18581 | 604 | 3.250632% |
| C | 18581 | 680 | 3.659652% |
| D | 18581 | 796 | 4.283946% |
Noise dominated data is calculated using 1-second bins in cleaned event files. If a bin has >2000 counts, and if more than 50% of those come from <1% of pixels, then it is considered to be noise-dominated and hence unusable.
| Quadrant | # 1 sec bins | Bins with >0 counts | Bins with >2000 counts | High rate bins dominated by noise | Noise dominated (total time) | Noise dominated (detector-on time) | Marked lightcurve |
|---|---|---|---|---|---|---|---|
| A | 20326 | 18584 | 0 | 0 | 0.00% | 0.00% | 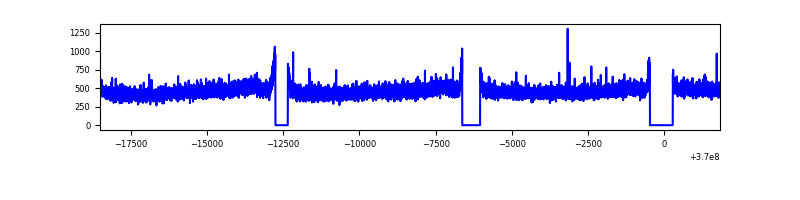 |
| B | 20326 | 18584 | 221 | 221 | 1.09% | 1.19% | 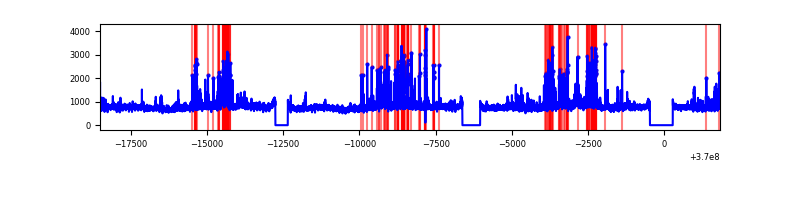 |
| C | 20326 | 18584 | 225 | 225 | 1.11% | 1.21% | 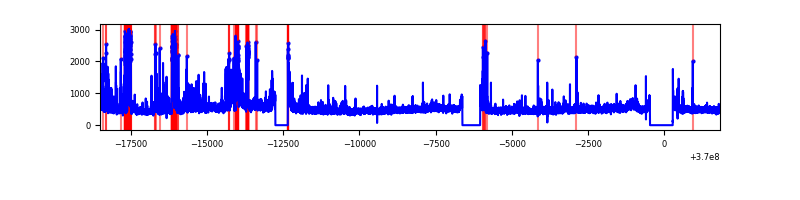 |
| D | 20326 | 18584 | 631 | 631 | 3.10% | 3.40% | 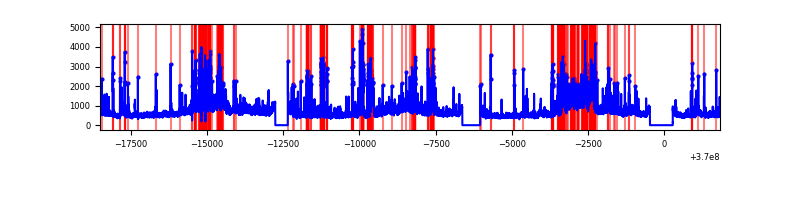 |
Top three noisy pixels from each quadrant. If the there are fewer than three noisy pixels in the level2.evt file, extra rows are filled as -1
| Pixel properties | Quadrant properties | ||||||
|---|---|---|---|---|---|---|---|
| Quadrant | DetID | PixID | Counts | Sigma | Mean | Median | Sigma |
| A | 13 | 254 | 36688 | 78.79 | 2184 | 2139 | 438.5 |
| A | 13 | 6 | 32895 | 70.14 | 2184 | 2139 | 438.5 |
| A | 3 | 137 | 22179 | 45.7 | 2184 | 2139 | 438.5 |
| B | 6 | 159 | 5075916 | 12389.35 | 2152 | 2097 | 409.5 |
| B | 5 | 172 | 804219 | 1958.64 | 2152 | 2097 | 409.5 |
| B | 0 | 190 | 623194 | 1516.61 | 2152 | 2097 | 409.5 |
| C | 0 | 10 | 1664452 | 3422.81 | 2079 | 2084 | 485.7 |
| C | 14 | 238 | 373612 | 764.97 | 2079 | 2084 | 485.7 |
| C | 14 | 67 | 181154 | 368.7 | 2079 | 2084 | 485.7 |
| D | 8 | 195 | 2630048 | 5348.59 | 2077 | 2018 | 491.4 |
| D | 12 | 6 | 2249253 | 4573.59 | 2077 | 2018 | 491.4 |
| D | 12 | 218 | 386831 | 783.17 | 2077 | 2018 | 491.4 |
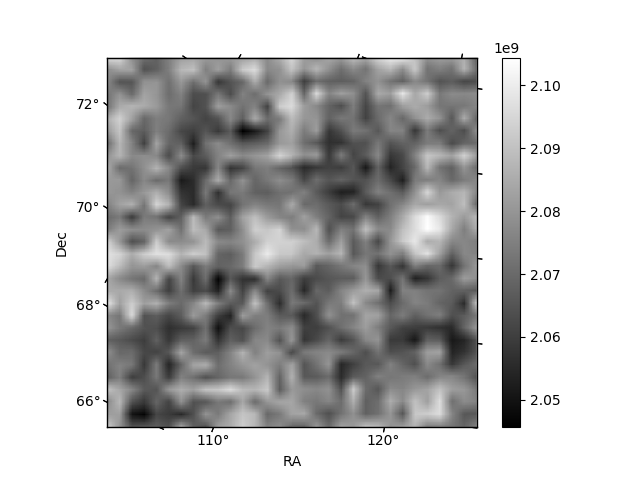
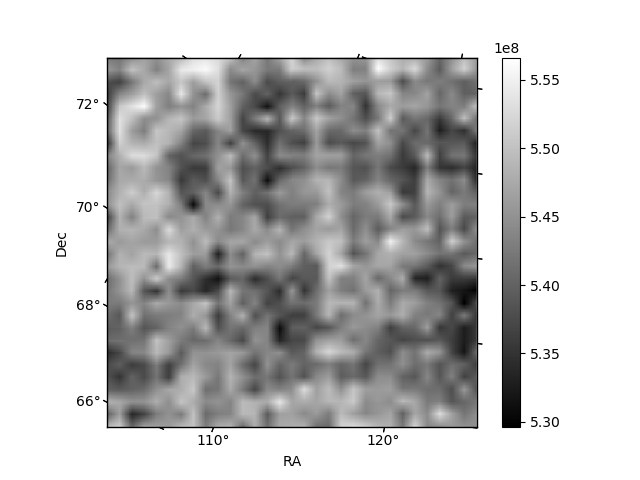
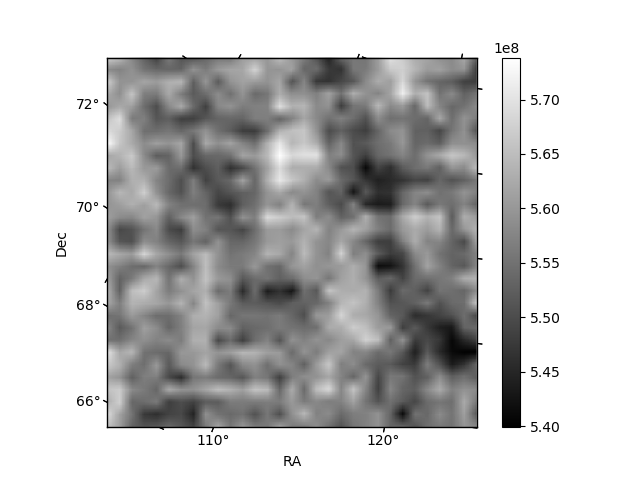
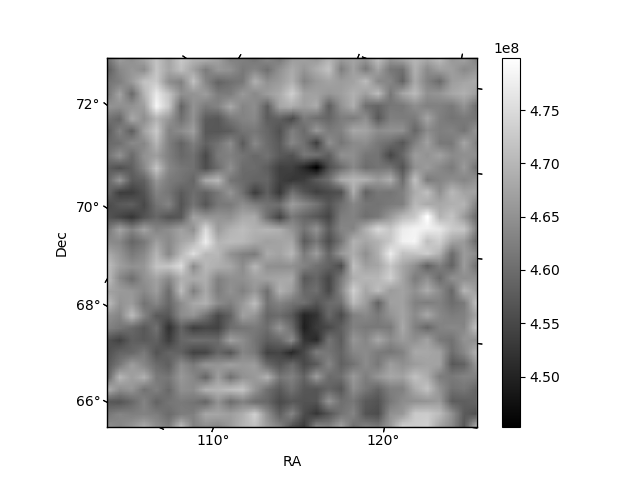
Histogram calculated using DETX and DETY for each event in the final _common_clean file
| Quadrant A | 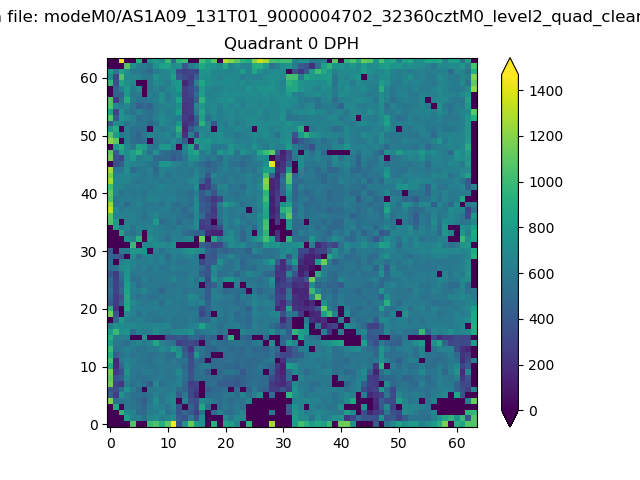 |
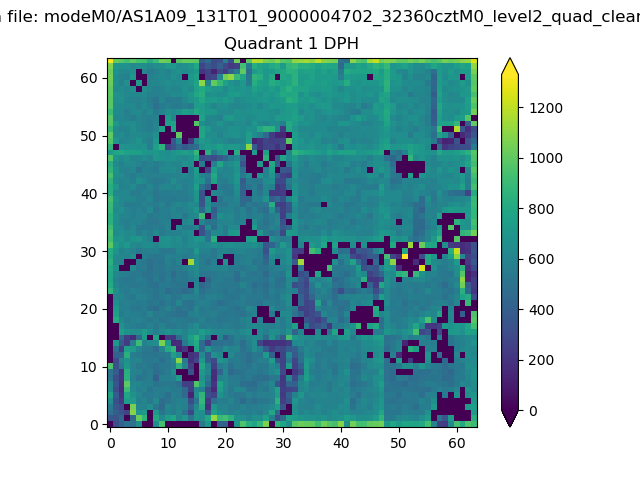 |
Quadrant B |
|---|---|---|---|
| Quadrant D |  |
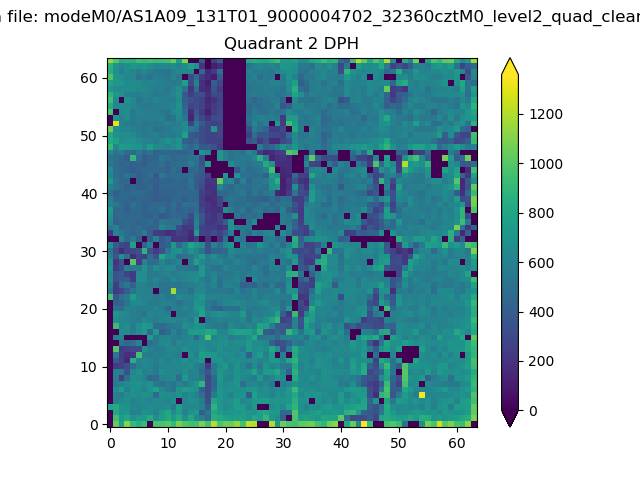 |
Quadrant C |
| Plot type | Count rate plots | Images |
|---|---|---|
| Comparison with Poisson distribution Blue bars denote a histogram of data divided into 1 sec bins. Red curve is a Poisson curve with rate = median count rate of data. |
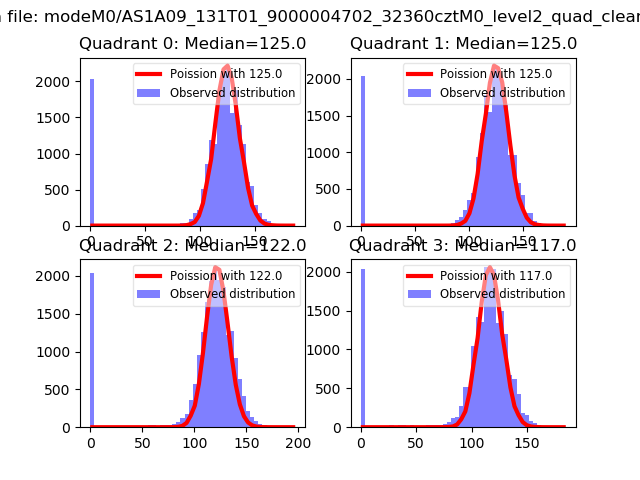 |
 |
| Quadrant-wise count rates Data is divided into 100 sec bins |
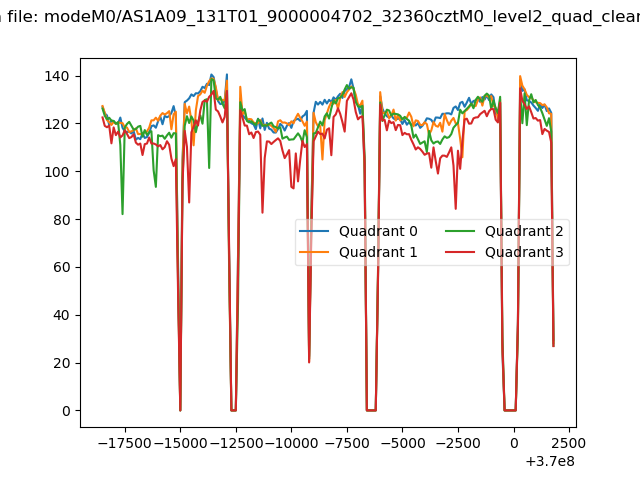 |
|
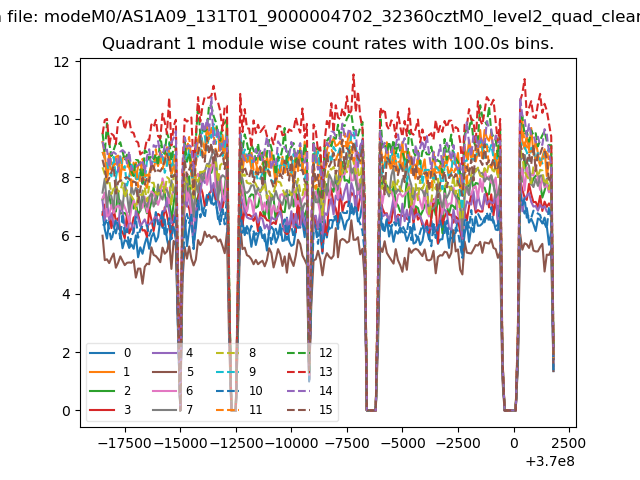
| Module-wise count rates for Quadrant A Data is divided into 100 sec bins |
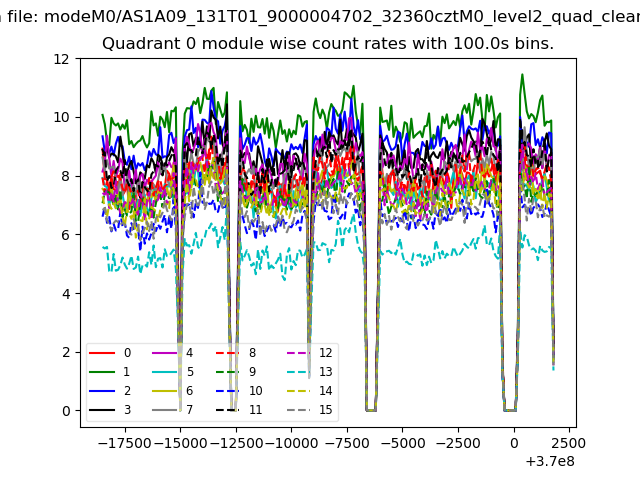 |
 |
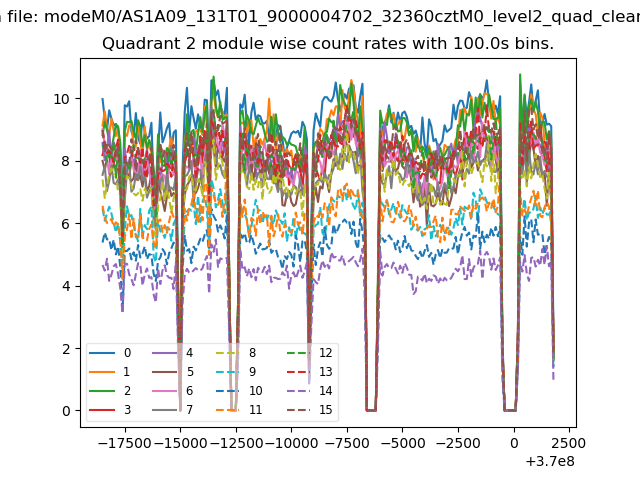
| Module-wise count rates for Quadrant B Data is divided into 100 sec bins |
 |
 |
| Module-wise count rates for Quadrant C Data is divided into 100 sec bins |
 |
 |
| Module-wise count rates for Quadrant D Data is divided into 100 sec bins |
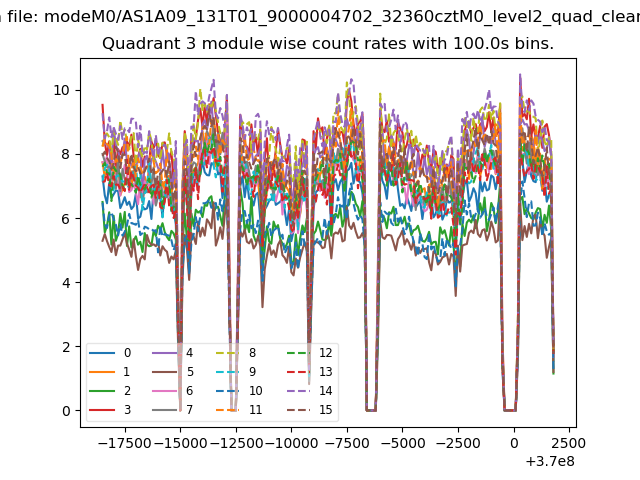 |
 |
| Parameter | Plot |
|---|---|
| CZT HV Monitor | 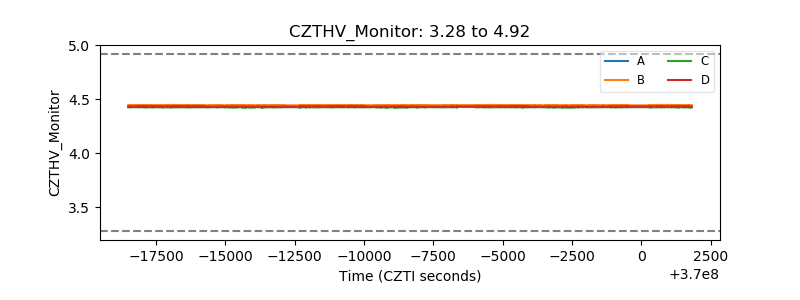 |
| D_VDD | 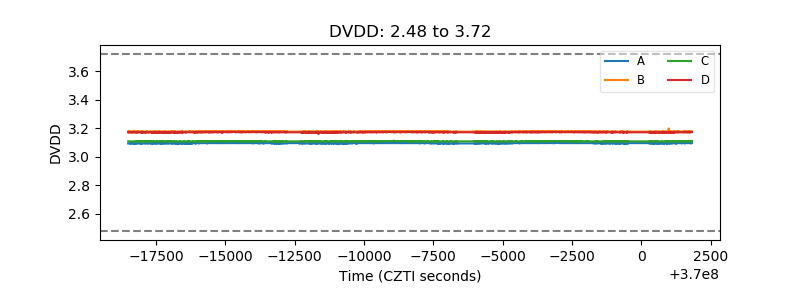 |
| Temperature 1 | 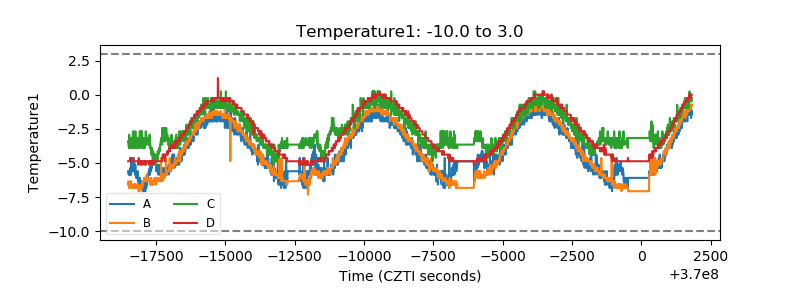 |
| Veto HV Monitor | 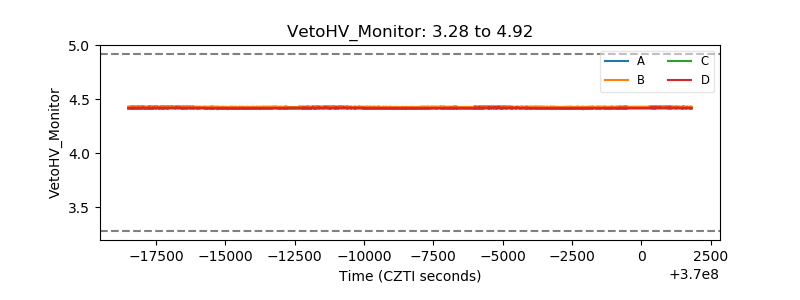 |
| Veto LLD | 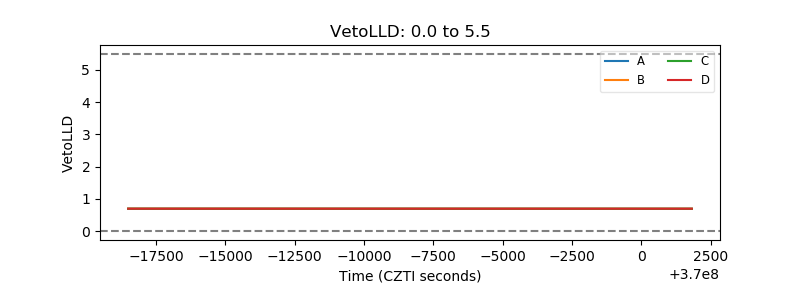 |
| Alpha Counter | 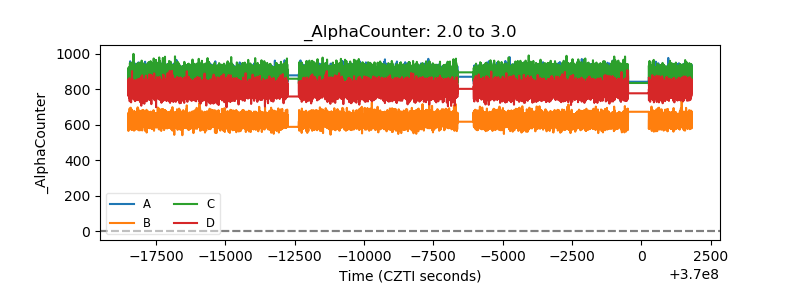 |
| _CPM_Rate | 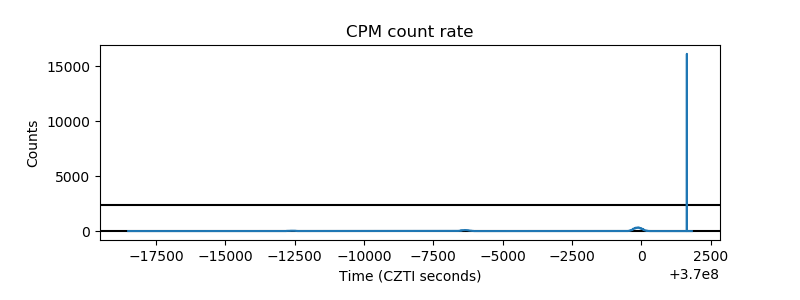 |
| CZT Counter | 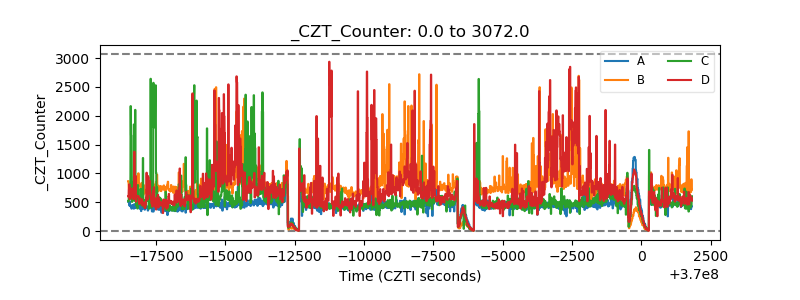 |
| +2.5 Volts monitor | 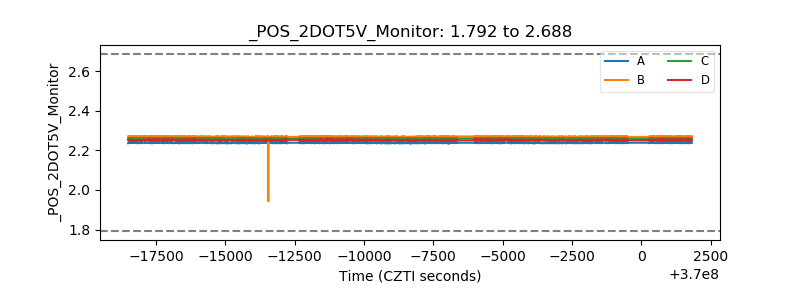 |
| +5 Volts monitor |  |
| _ROLL_ROT | 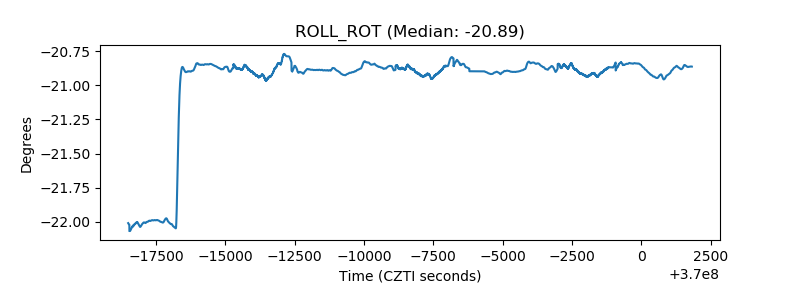 |
| _Roll_DEC | 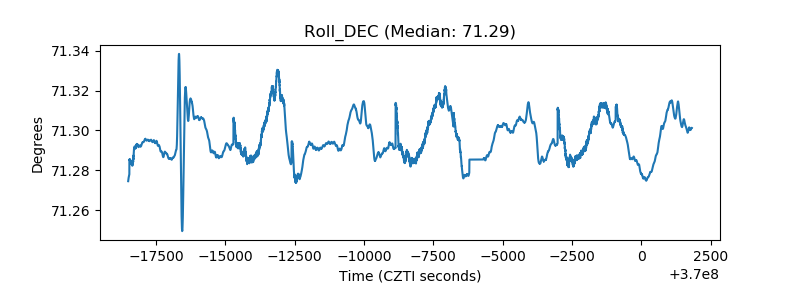 |
| _Roll_RA | 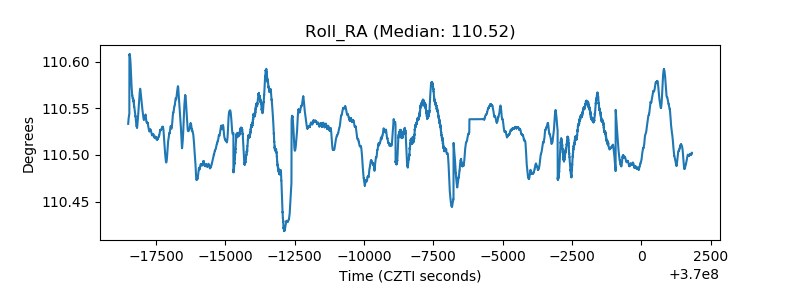 |
| Veto Counter | 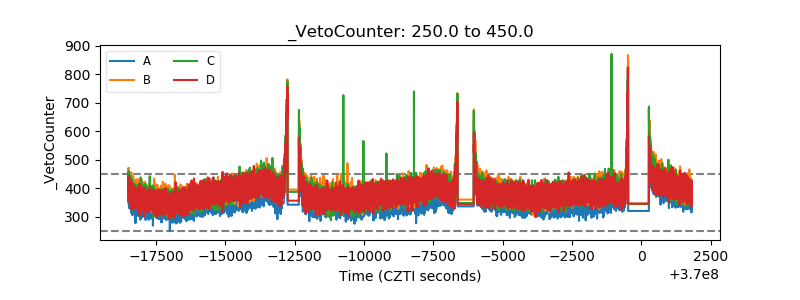 |