| Param | Original file | Final file |
|---|---|---|
| Filename | modeM0/AS1A09_131T01_9000004702_32361cztM0_level2.evt | modeM0/AS1A09_131T01_9000004702_32361cztM0_level2_quad_clean.evt |
| Size (bytes) | 586,085,760 | 118,451,520 |
| Size | 558.9 MB | 113.0 MB |
| Events in quadrant A | 2,947,452 | 816,384 |
| Events in quadrant B | 5,529,455 | 800,301 |
| Events in quadrant C | 3,282,092 | 785,926 |
| Events in quadrant D | 5,565,630 | 746,012 |
| Mode M0 | |||
|---|---|---|---|
| Quadrant | BADHDUFLAG | Total packets | Discarded packets |
| A | 0 | 12791 | 2 |
| B | 0 | 20949 | 1 |
| C | 0 | 13471 | 1 |
| D | 0 | 21030 | 1 |
| Mode SS | |||
|---|---|---|---|
| Quadrant | BADHDUFLAG | Total packets | Discarded packets |
| A | 0 | 128 | 0 |
| B | 0 | 128 | 0 |
| C | 0 | 128 | 0 |
| D | 0 | 128 | 0 |
| Mode M9 | |||
|---|---|---|---|
| Quadrant | BADHDUFLAG | Total packets | Discarded packets |
| A | 0 | 9 | 0 |
| B | 0 | 9 | 0 |
| C | 0 | 9 | 0 |
| D | 0 | 9 | 0 |
| Quadrant | Total seconds | Saturated seconds | Saturation percentage |
|---|---|---|---|
| A | 6284 | 52 | 0.827498% |
| B | 6284 | 254 | 4.042011% |
| C | 6284 | 157 | 2.498409% |
| D | 6284 | 340 | 5.410567% |
Noise dominated data is calculated using 1-second bins in cleaned event files. If a bin has >2000 counts, and if more than 50% of those come from <1% of pixels, then it is considered to be noise-dominated and hence unusable.
| Quadrant | # 1 sec bins | Bins with >0 counts | Bins with >2000 counts | High rate bins dominated by noise | Noise dominated (total time) | Noise dominated (detector-on time) | Marked lightcurve |
|---|---|---|---|---|---|---|---|
| A | 7204 | 6285 | 0 | 0 | 0.00% | 0.00% | 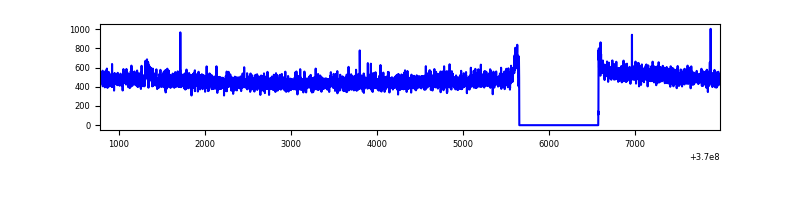 |
| B | 7204 | 6285 | 111 | 111 | 1.54% | 1.77% | 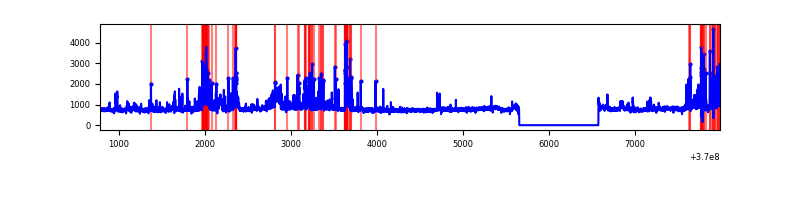 |
| C | 7204 | 6285 | 18 | 18 | 0.25% | 0.29% | 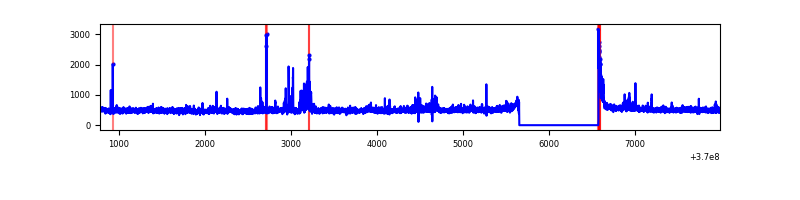 |
| D | 7204 | 6285 | 296 | 296 | 4.11% | 4.71% | 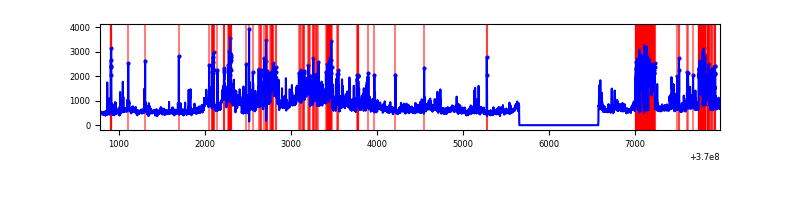 |
Top three noisy pixels from each quadrant. If the there are fewer than three noisy pixels in the level2.evt file, extra rows are filled as -1
| Pixel properties | Quadrant properties | ||||||
|---|---|---|---|---|---|---|---|
| Quadrant | DetID | PixID | Counts | Sigma | Mean | Median | Sigma |
| A | 13 | 6 | 12141 | 74.83 | 757 | 741 | 152.4 |
| A | 13 | 254 | 11545 | 70.92 | 757 | 741 | 152.4 |
| A | 15 | 174 | 8849 | 53.22 | 757 | 741 | 152.4 |
| B | 6 | 159 | 1729610 | 12194.21 | 737 | 717 | 141.8 |
| B | 5 | 172 | 428963 | 3020.5 | 737 | 717 | 141.8 |
| B | 0 | 190 | 326055 | 2294.67 | 737 | 717 | 141.8 |
| C | 14 | 238 | 134634 | 808.33 | 715 | 718 | 165.7 |
| C | 0 | 10 | 80994 | 484.56 | 715 | 718 | 165.7 |
| C | 0 | 207 | 76874 | 459.69 | 715 | 718 | 165.7 |
| D | 8 | 195 | 1199376 | 7001.76 | 720 | 700 | 171.2 |
| D | 12 | 6 | 462473 | 2697.33 | 720 | 700 | 171.2 |
| D | 14 | 52 | 360964 | 2104.39 | 720 | 700 | 171.2 |
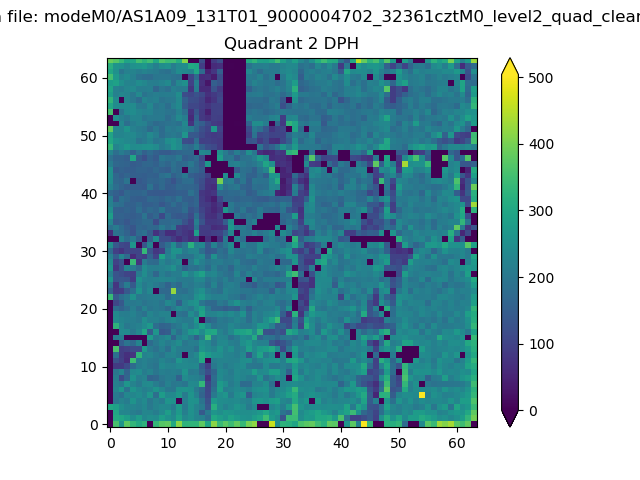
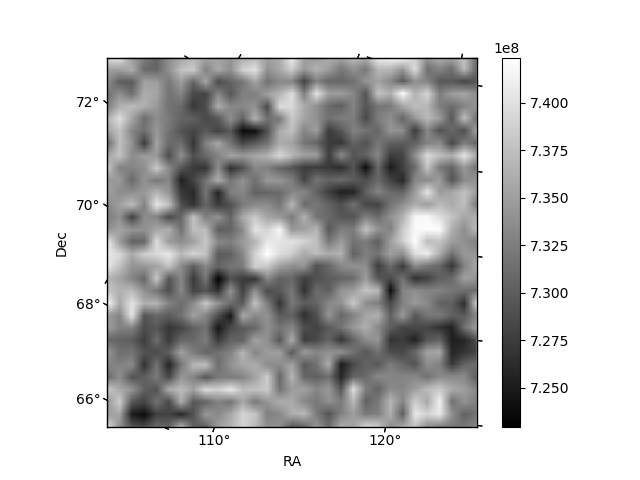
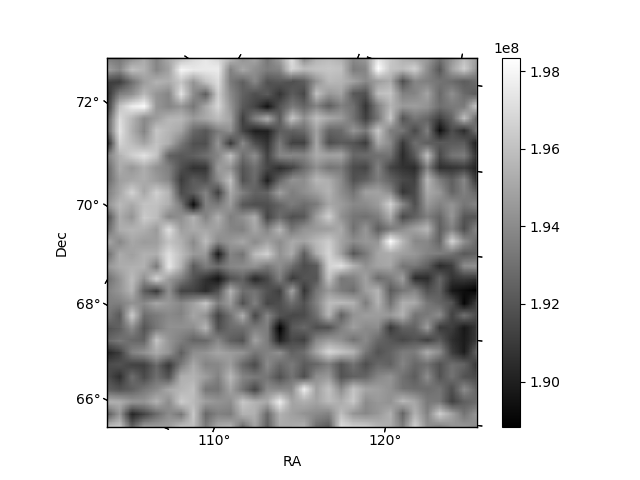
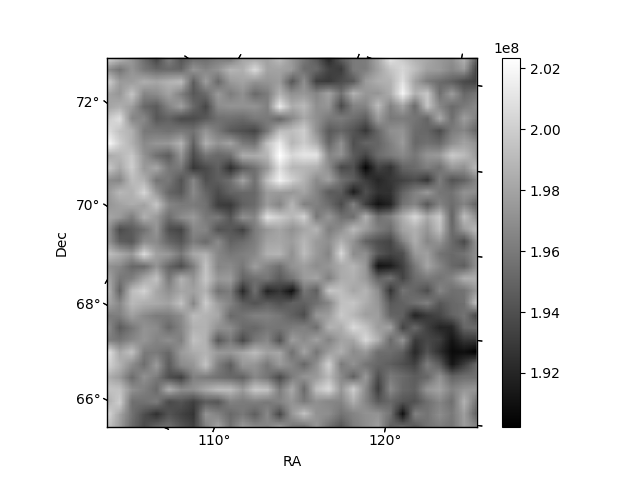
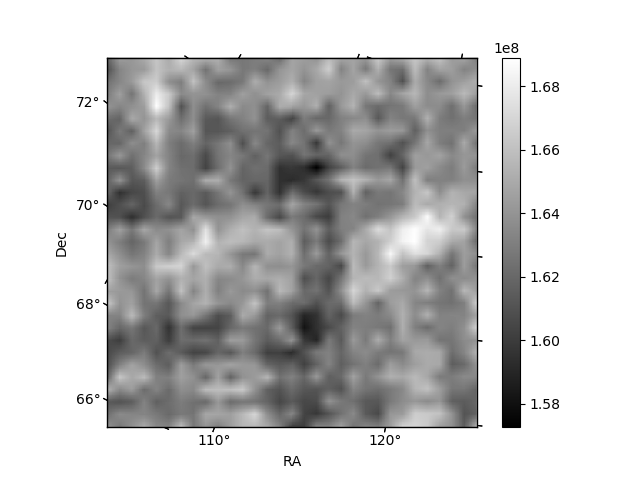
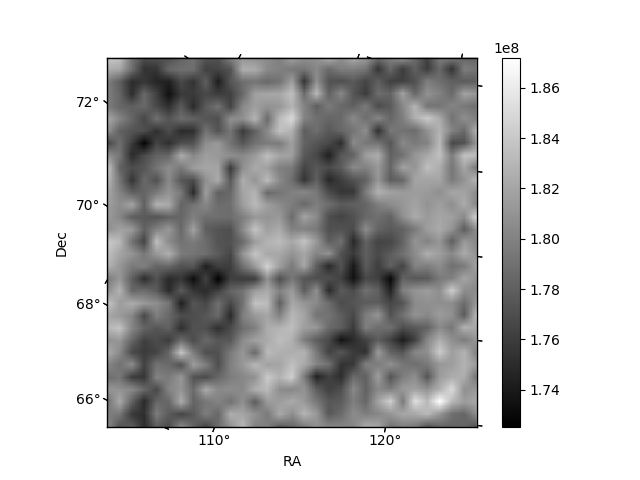
Histogram calculated using DETX and DETY for each event in the final _common_clean file
| Quadrant A | 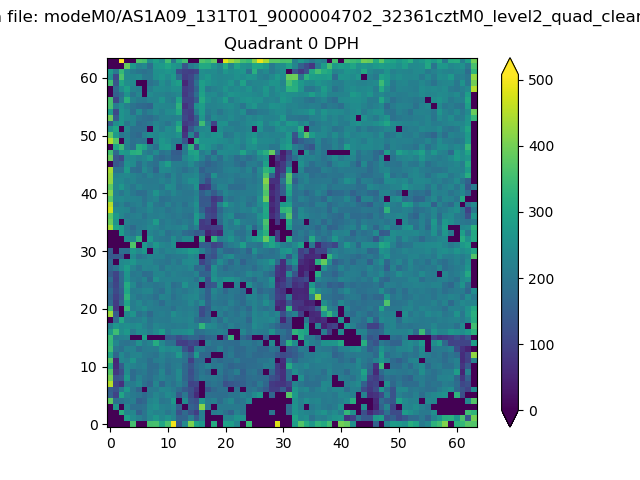 |
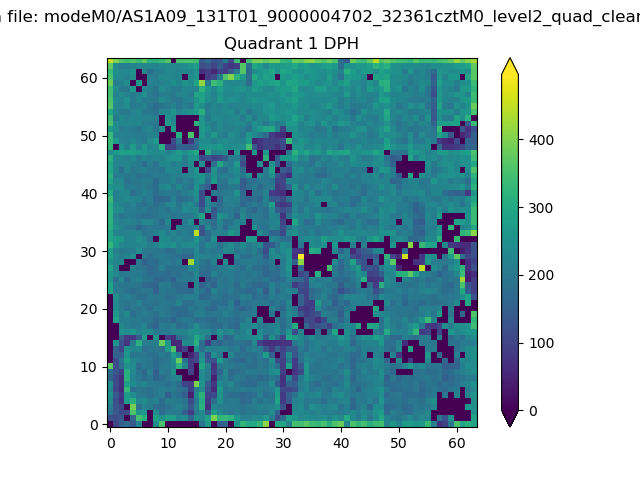 |
Quadrant B |
|---|---|---|---|
| Quadrant D | 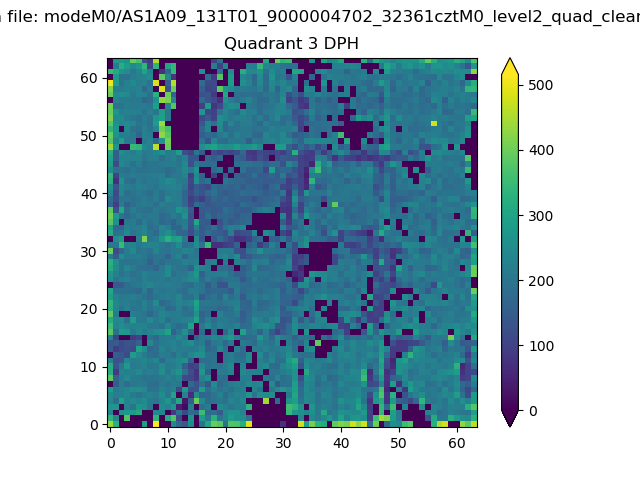 |
 |
Quadrant C |
| Plot type | Count rate plots | Images |
|---|---|---|
| Comparison with Poisson distribution Blue bars denote a histogram of data divided into 1 sec bins. Red curve is a Poisson curve with rate = median count rate of data. |
 |
 |
| Quadrant-wise count rates Data is divided into 100 sec bins |
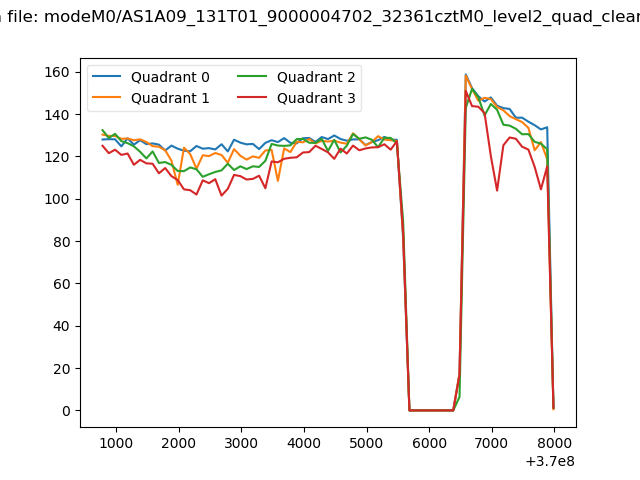 |
|
| Module-wise count rates for Quadrant A Data is divided into 100 sec bins |
 |
 |
| Module-wise count rates for Quadrant B Data is divided into 100 sec bins |
 |
 |
| Module-wise count rates for Quadrant C Data is divided into 100 sec bins |
 |
 |
| Module-wise count rates for Quadrant D Data is divided into 100 sec bins |
 |
 |
| Parameter | Plot |
|---|---|
| CZT HV Monitor | 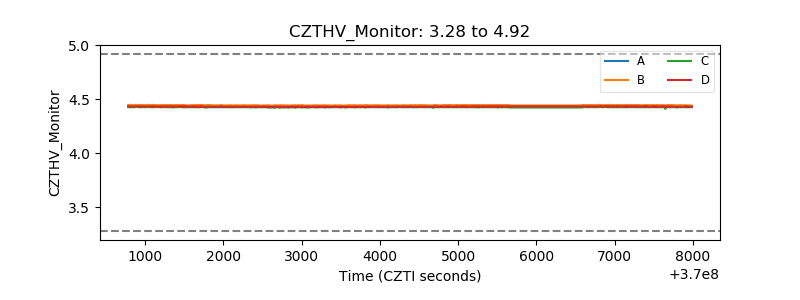 |
| D_VDD | 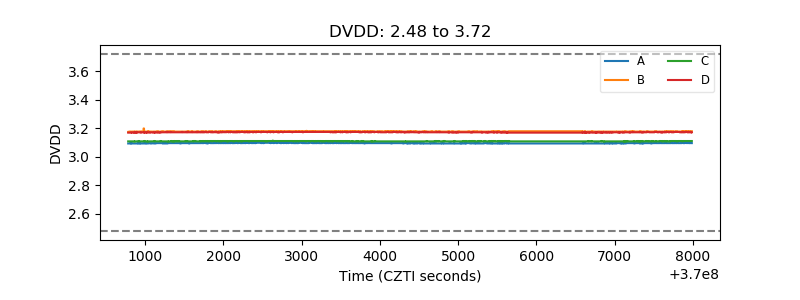 |
| Temperature 1 | 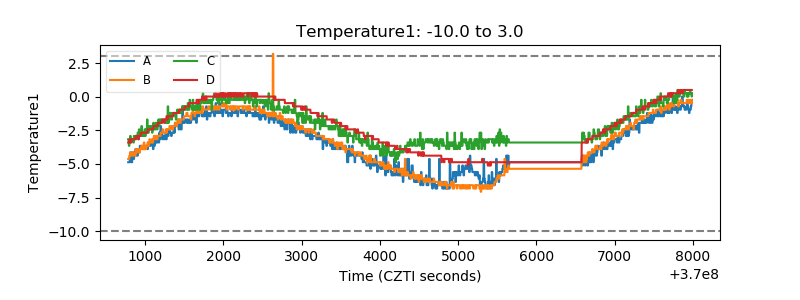 |
| Veto HV Monitor | 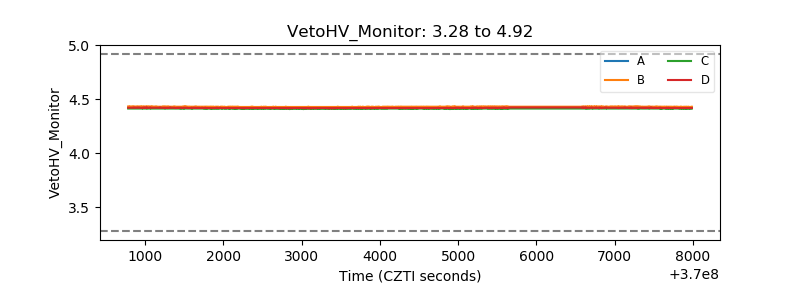 |
| Veto LLD | 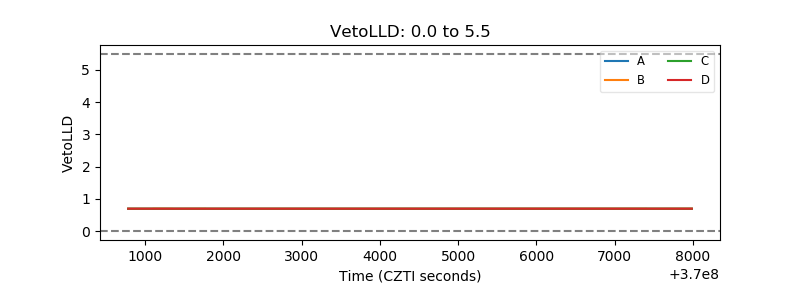 |
| Alpha Counter | 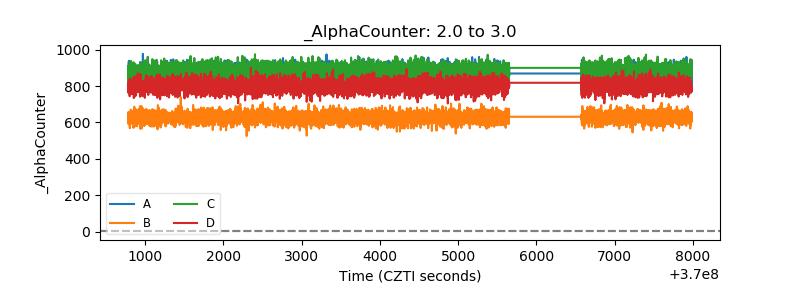 |
| _CPM_Rate | 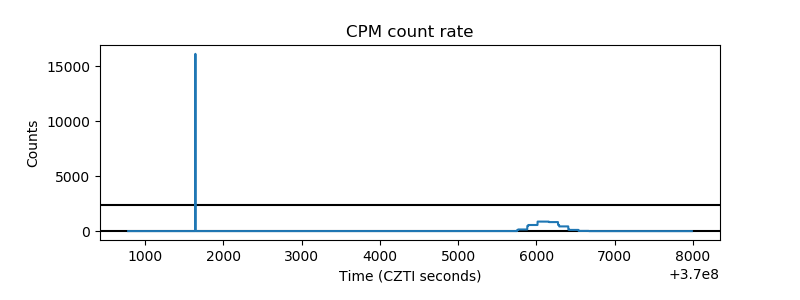 |
| CZT Counter | 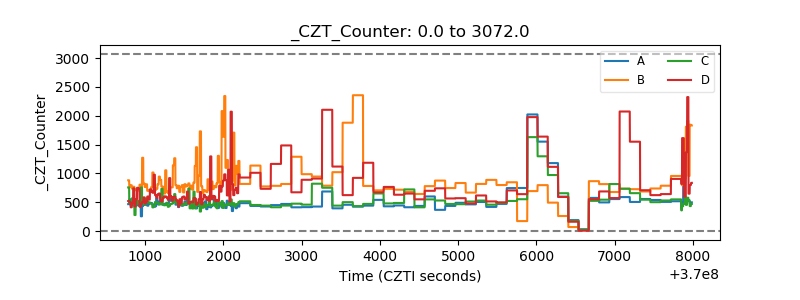 |
| +2.5 Volts monitor | 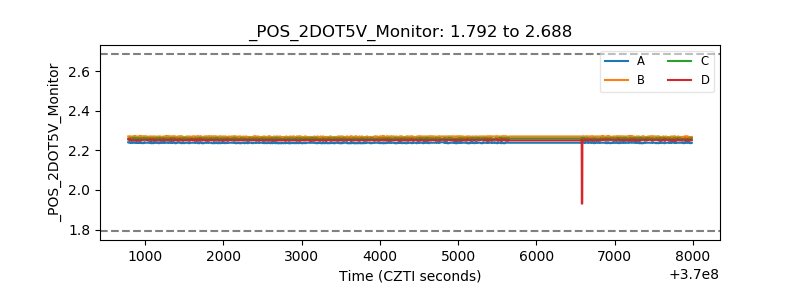 |
| +5 Volts monitor |  |
| _ROLL_ROT |  |
| _Roll_DEC | 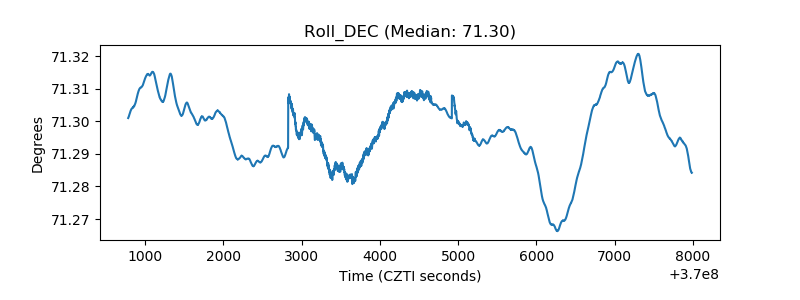 |
| _Roll_RA | 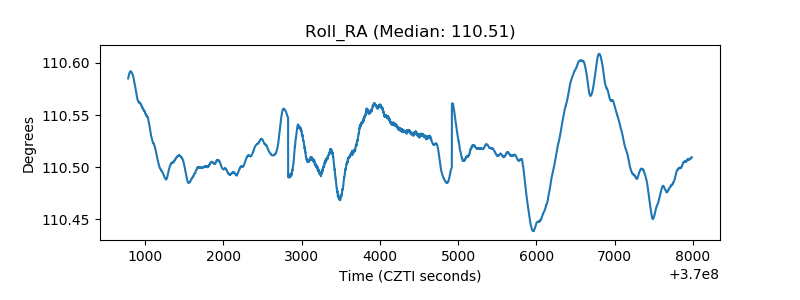 |
| Veto Counter |  |