| Param | Original file | Final file |
|---|---|---|
| Filename | modeM0/AS1A09_131T01_9000004702_32364cztM0_level2.evt | modeM0/AS1A09_131T01_9000004702_32364cztM0_level2_quad_clean.evt |
| Size (bytes) | 740,180,160 | 116,205,120 |
| Size | 705.9 MB | 110.8 MB |
| Events in quadrant A | 3,011,975 | 852,058 |
| Events in quadrant B | 7,264,975 | 766,185 |
| Events in quadrant C | 4,968,464 | 716,628 |
| Events in quadrant D | 6,774,604 | 772,451 |
| Mode M0 | |||
|---|---|---|---|
| Quadrant | BADHDUFLAG | Total packets | Discarded packets |
| A | 0 | 12835 | 2 |
| B | 0 | 25894 | 1 |
| C | 0 | 18716 | 1 |
| D | 0 | 24378 | 1 |
| Mode SS | |||
|---|---|---|---|
| Quadrant | BADHDUFLAG | Total packets | Discarded packets |
| A | 0 | 120 | 0 |
| B | 0 | 120 | 0 |
| C | 0 | 120 | 0 |
| D | 0 | 120 | 0 |
| Mode M9 | |||
|---|---|---|---|
| Quadrant | BADHDUFLAG | Total packets | Discarded packets |
| A | 0 | 11 | 0 |
| B | 0 | 11 | 0 |
| C | 0 | 11 | 0 |
| D | 0 | 11 | 0 |
| Quadrant | Total seconds | Saturated seconds | Saturation percentage |
|---|---|---|---|
| A | 5876 | 89 | 1.514636% |
| B | 5876 | 1254 | 21.341048% |
| C | 5876 | 1240 | 21.102791% |
| D | 5876 | 534 | 9.087815% |
Noise dominated data is calculated using 1-second bins in cleaned event files. If a bin has >2000 counts, and if more than 50% of those come from <1% of pixels, then it is considered to be noise-dominated and hence unusable.
| Quadrant | # 1 sec bins | Bins with >0 counts | Bins with >2000 counts | High rate bins dominated by noise | Noise dominated (total time) | Noise dominated (detector-on time) | Marked lightcurve |
|---|---|---|---|---|---|---|---|
| A | 7041 | 5877 | 19 | 19 | 0.27% | 0.32% | 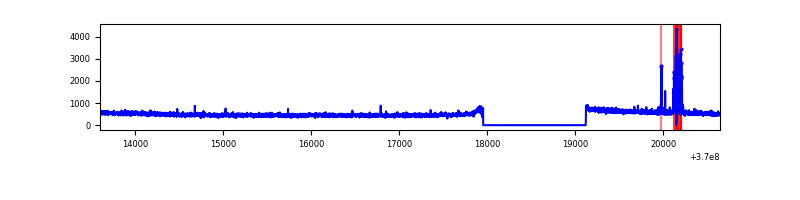 |
| B | 7041 | 5877 | 837 | 837 | 11.89% | 14.24% | 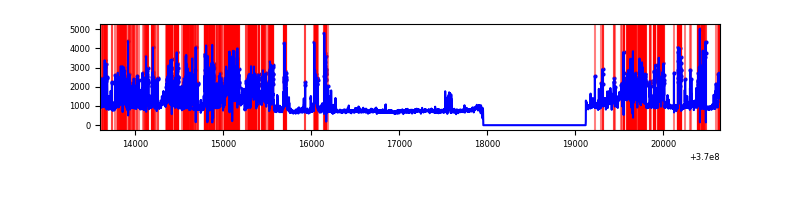 |
| C | 7041 | 5877 | 517 | 517 | 7.34% | 8.80% |  |
| D | 7041 | 5877 | 397 | 397 | 5.64% | 6.76% | 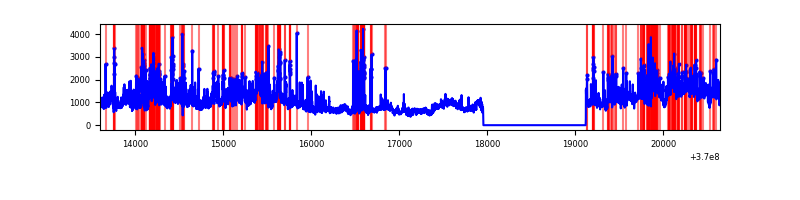 |
Top three noisy pixels from each quadrant. If the there are fewer than three noisy pixels in the level2.evt file, extra rows are filled as -1
| Pixel properties | Quadrant properties | ||||||
|---|---|---|---|---|---|---|---|
| Quadrant | DetID | PixID | Counts | Sigma | Mean | Median | Sigma |
| A | 14 | 239 | 93666 | 622.64 | 750 | 735 | 149.3 |
| A | 13 | 6 | 23373 | 151.68 | 750 | 735 | 149.3 |
| A | 13 | 254 | 11419 | 71.58 | 750 | 735 | 149.3 |
| B | 10 | 245 | 1818095 | 14297.28 | 684 | 667 | 127.1 |
| B | 6 | 159 | 1651189 | 12984.27 | 684 | 667 | 127.1 |
| B | 5 | 172 | 644670 | 5066.22 | 684 | 667 | 127.1 |
| C | 0 | 10 | 1586426 | 10866.58 | 635 | 640 | 145.9 |
| C | 3 | 233 | 313964 | 2147.05 | 635 | 640 | 145.9 |
| C | 14 | 238 | 218563 | 1493.31 | 635 | 640 | 145.9 |
| D | 8 | 195 | 2117396 | 12522.8 | 716 | 697 | 169.0 |
| D | 12 | 6 | 906898 | 5361.26 | 716 | 697 | 169.0 |
| D | 12 | 3 | 269065 | 1587.72 | 716 | 697 | 169.0 |
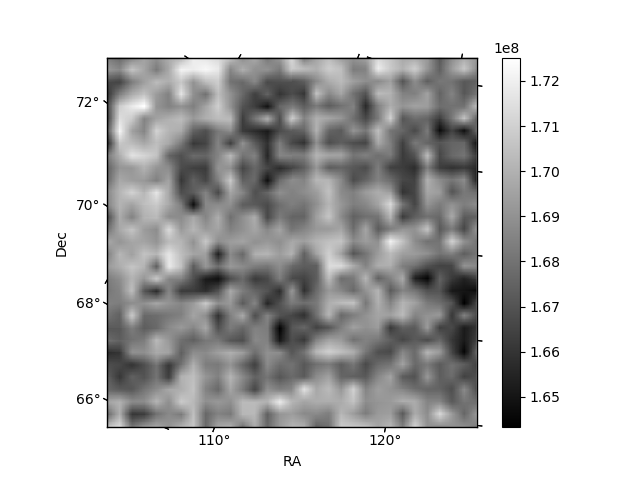
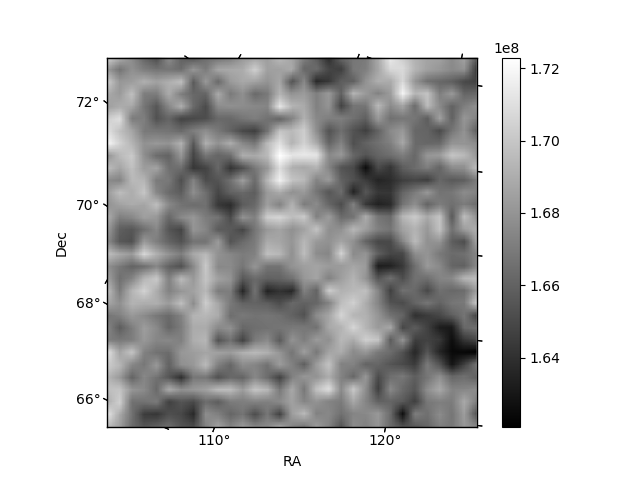
Histogram calculated using DETX and DETY for each event in the final _common_clean file
| Quadrant A | 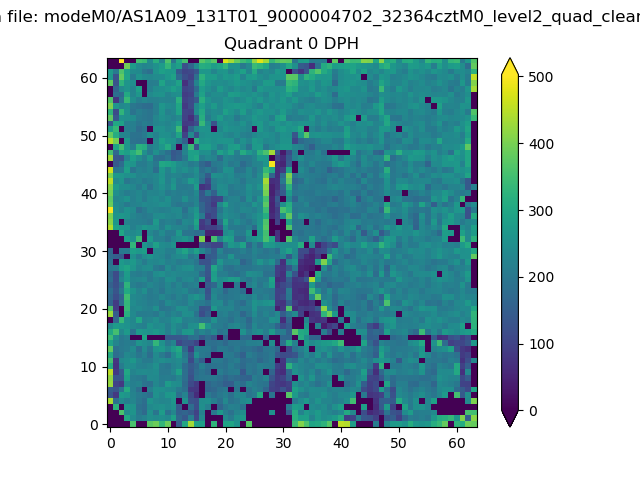 |
 |
Quadrant B |
|---|---|---|---|
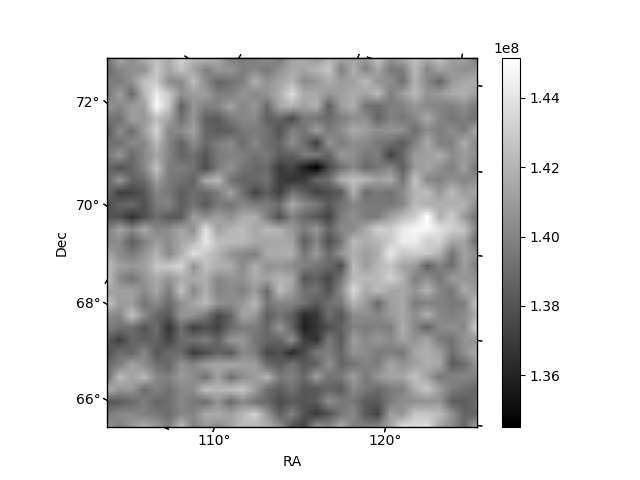
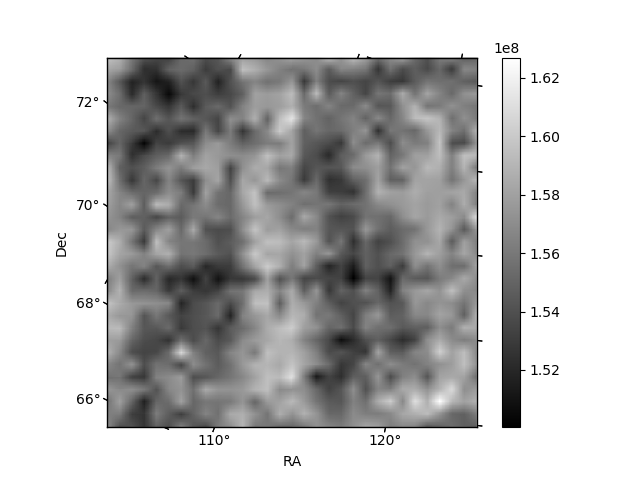
| Quadrant D | 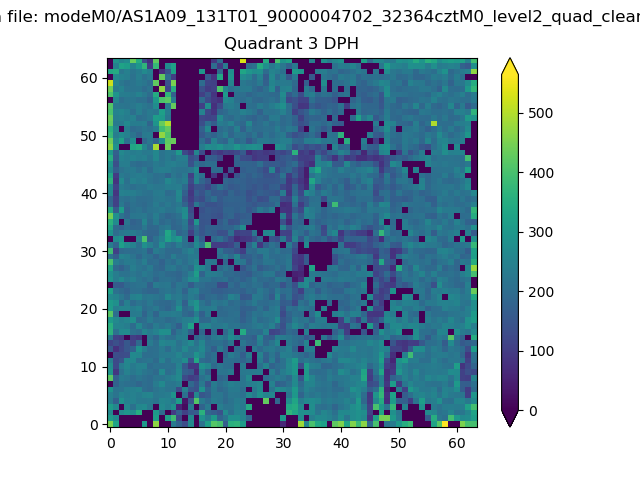 |
 |
Quadrant C |
| Plot type | Count rate plots | Images |
|---|---|---|
| Comparison with Poisson distribution Blue bars denote a histogram of data divided into 1 sec bins. Red curve is a Poisson curve with rate = median count rate of data. |
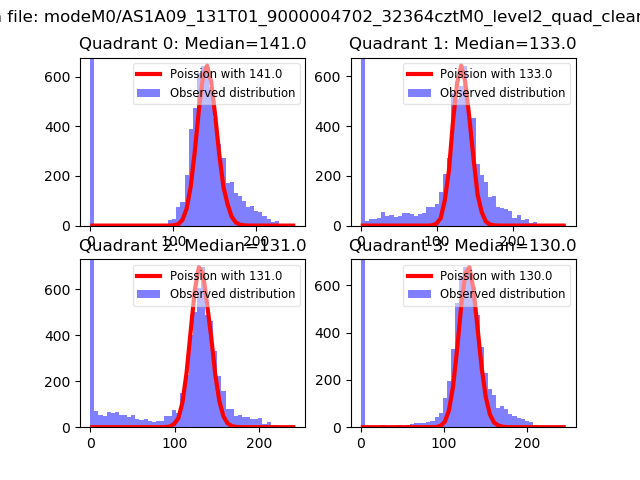 |
 |
| Quadrant-wise count rates Data is divided into 100 sec bins |
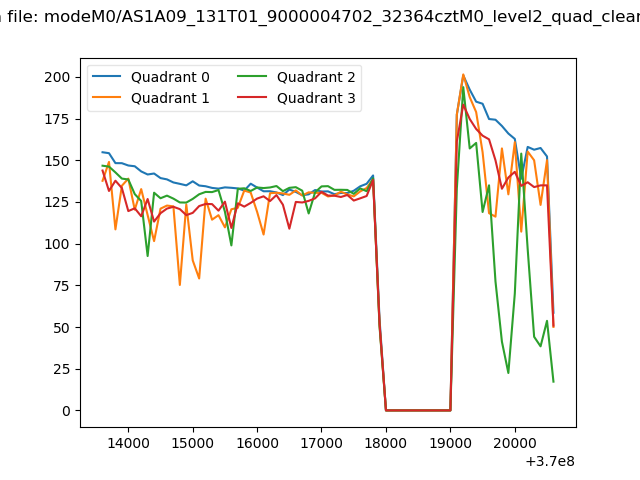 |
|
| Module-wise count rates for Quadrant A Data is divided into 100 sec bins |
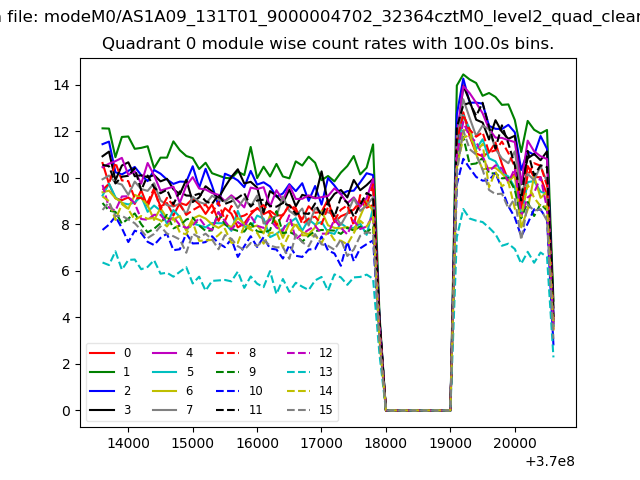 |
 |
| Module-wise count rates for Quadrant B Data is divided into 100 sec bins |
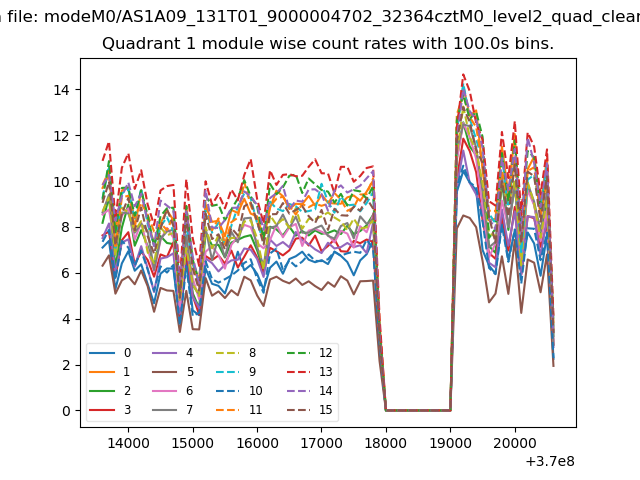 |
 |
| Module-wise count rates for Quadrant C Data is divided into 100 sec bins |
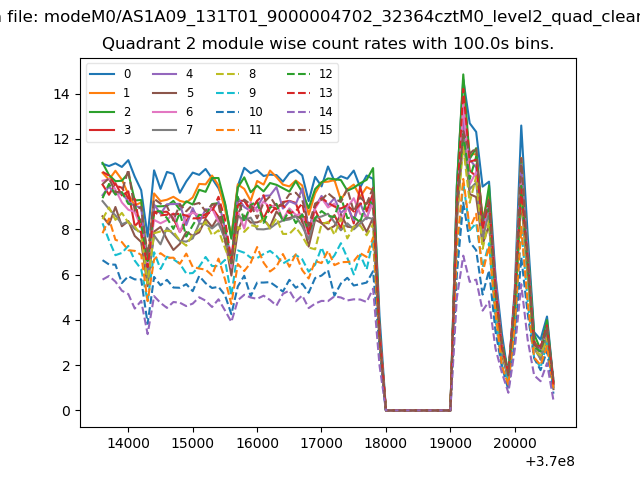 |
 |
| Module-wise count rates for Quadrant D Data is divided into 100 sec bins |
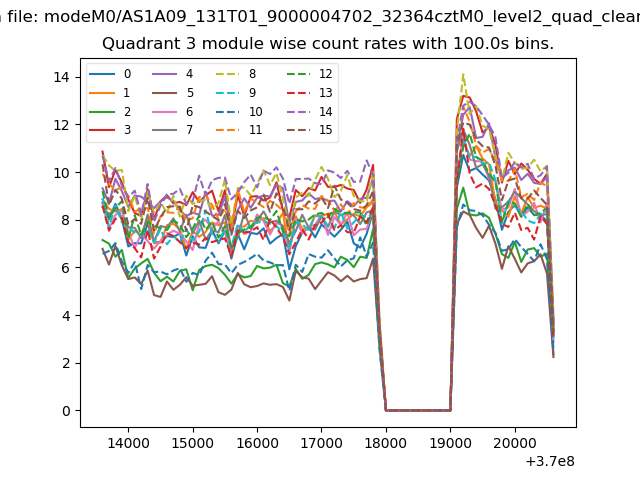 |
 |
| Parameter | Plot |
|---|---|
| CZT HV Monitor | 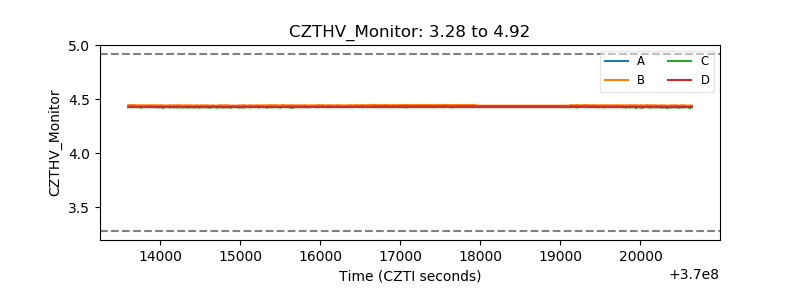 |
| D_VDD | 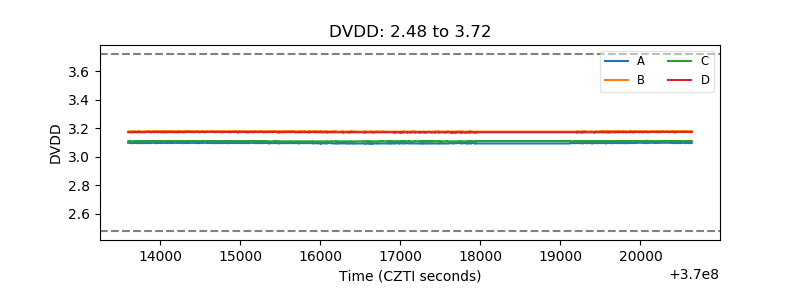 |
| Temperature 1 | 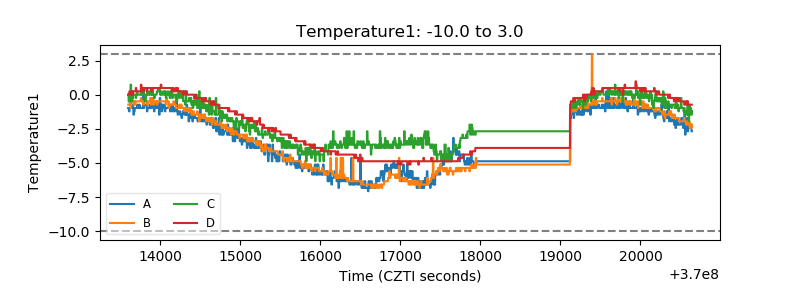 |
| Veto HV Monitor | 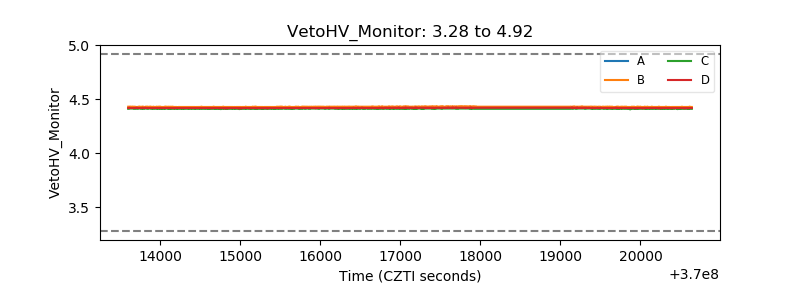 |
| Veto LLD | 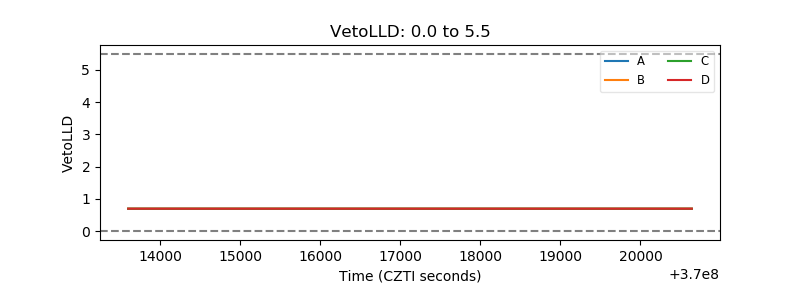 |
| Alpha Counter | 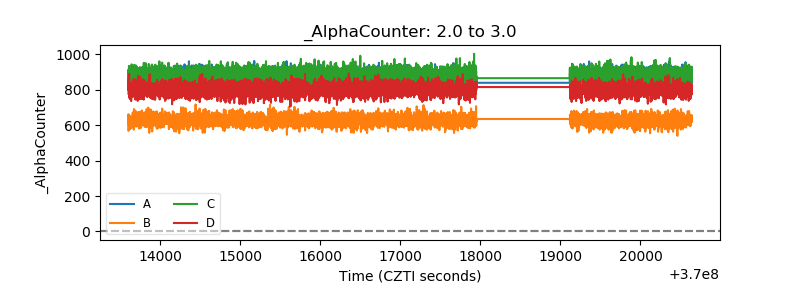 |
| _CPM_Rate | 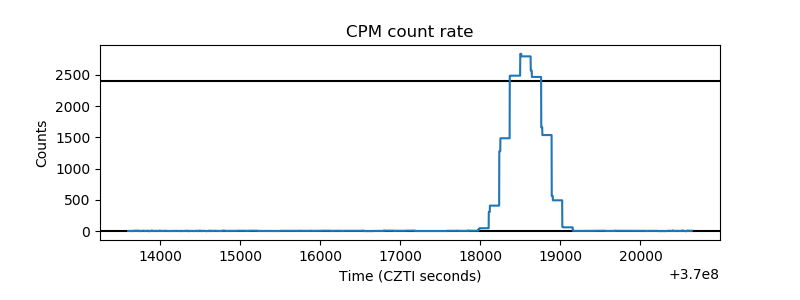 |
| CZT Counter | 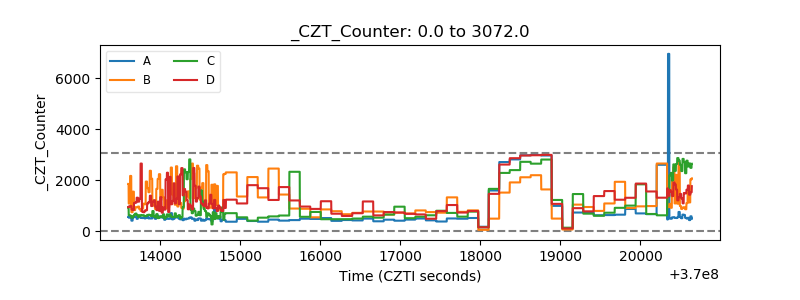 |
| +2.5 Volts monitor |  |
| +5 Volts monitor | 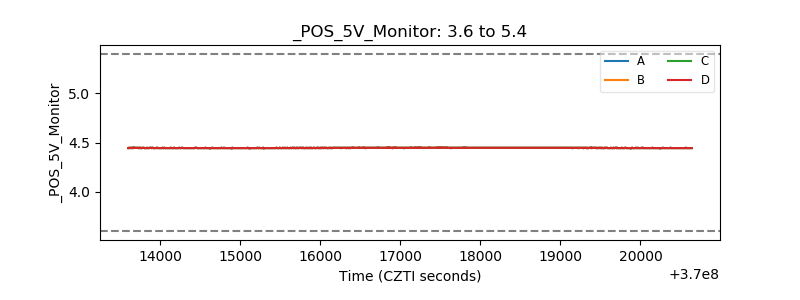 |
| _ROLL_ROT | 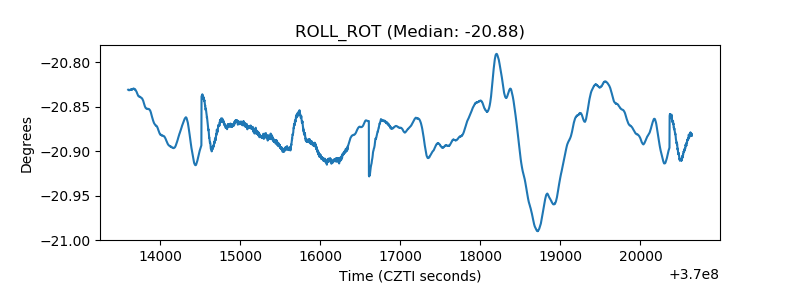 |
| _Roll_DEC | 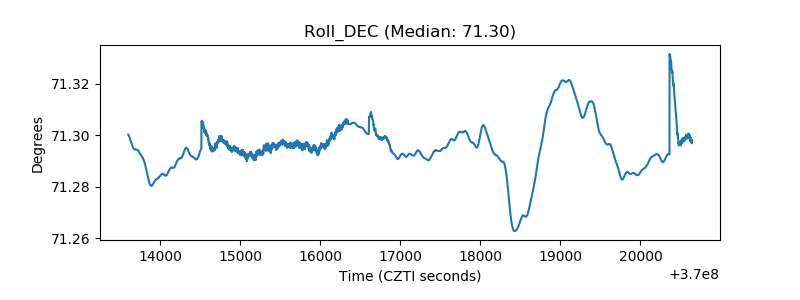 |
| _Roll_RA | 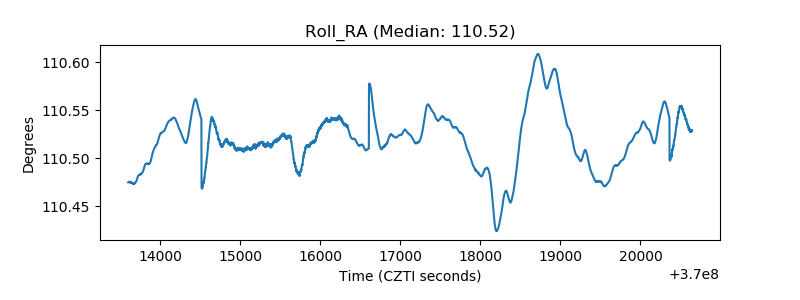 |
| Veto Counter | 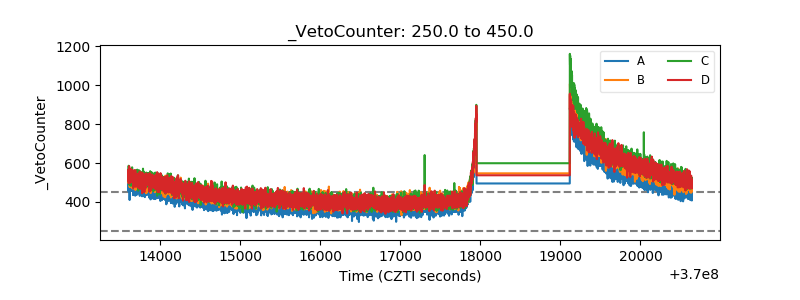 |