| Param | Original file | Final file |
|---|---|---|
| Filename | modeM0/AS1A09_131T01_9000004702_32365cztM0_level2.evt | modeM0/AS1A09_131T01_9000004702_32365cztM0_level2_quad_clean.evt |
| Size (bytes) | 856,500,480 | 108,987,840 |
| Size | 816.8 MB | 103.9 MB |
| Events in quadrant A | 7,180,633 | 609,739 |
| Events in quadrant B | 5,884,062 | 819,291 |
| Events in quadrant C | 6,181,097 | 688,464 |
| Events in quadrant D | 6,314,403 | 787,404 |
| Mode M0 | |||
|---|---|---|---|
| Quadrant | BADHDUFLAG | Total packets | Discarded packets |
| A | 0 | 25048 | 2 |
| B | 0 | 21699 | 1 |
| C | 0 | 21963 | 1 |
| D | 0 | 22724 | 1 |
| Mode SS | |||
|---|---|---|---|
| Quadrant | BADHDUFLAG | Total packets | Discarded packets |
| A | 0 | 114 | 0 |
| B | 0 | 114 | 0 |
| C | 0 | 114 | 0 |
| D | 0 | 114 | 0 |
| Mode M9 | |||
|---|---|---|---|
| Quadrant | BADHDUFLAG | Total packets | Discarded packets |
| A | 0 | 13 | 0 |
| B | 0 | 13 | 0 |
| C | 0 | 13 | 0 |
| D | 0 | 13 | 0 |
| Quadrant | Total seconds | Saturated seconds | Saturation percentage |
|---|---|---|---|
| A | 5632 | 2248 | 39.914773% |
| B | 5632 | 580 | 10.298295% |
| C | 5632 | 1868 | 33.167614% |
| D | 5632 | 417 | 7.404119% |
Noise dominated data is calculated using 1-second bins in cleaned event files. If a bin has >2000 counts, and if more than 50% of those come from <1% of pixels, then it is considered to be noise-dominated and hence unusable.
| Quadrant | # 1 sec bins | Bins with >0 counts | Bins with >2000 counts | High rate bins dominated by noise | Noise dominated (total time) | Noise dominated (detector-on time) | Marked lightcurve |
|---|---|---|---|---|---|---|---|
| A | 6892 | 5633 | 1292 | 1292 | 18.75% | 22.94% | 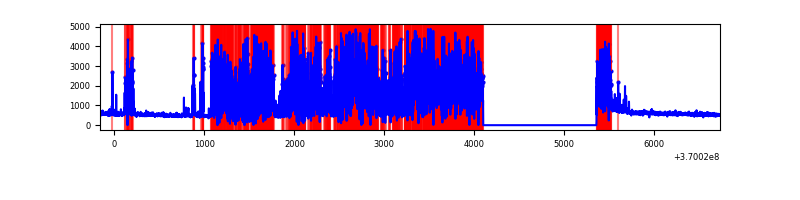 |
| B | 6892 | 5633 | 332 | 332 | 4.82% | 5.89% | 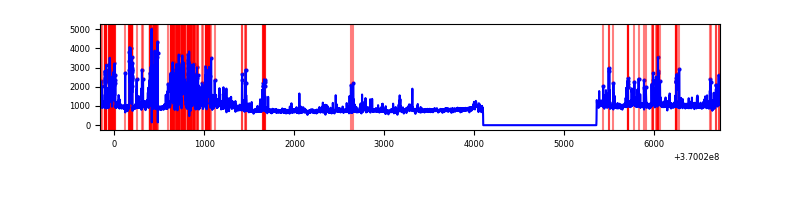 |
| C | 6892 | 5633 | 1088 | 1088 | 15.79% | 19.31% | 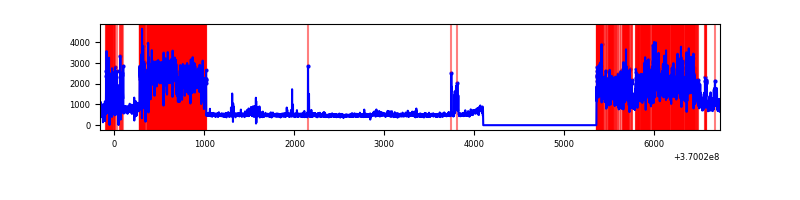 |
| D | 6892 | 5633 | 307 | 307 | 4.45% | 5.45% | 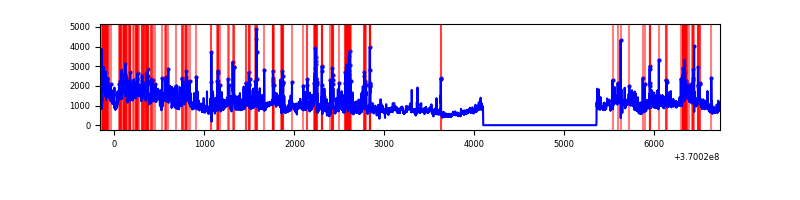 |
Top three noisy pixels from each quadrant. If the there are fewer than three noisy pixels in the level2.evt file, extra rows are filled as -1
| Pixel properties | Quadrant properties | ||||||
|---|---|---|---|---|---|---|---|
| Quadrant | DetID | PixID | Counts | Sigma | Mean | Median | Sigma |
| A | 14 | 239 | 4837136 | 45272.89 | 539 | 530 | 106.8 |
| A | 14 | 238 | 249831 | 2333.57 | 539 | 530 | 106.8 |
| A | 13 | 6 | 10116 | 89.73 | 539 | 530 | 106.8 |
| B | 6 | 159 | 1746833 | 13320.73 | 710 | 693 | 131.1 |
| B | 5 | 172 | 772649 | 5889.0 | 710 | 693 | 131.1 |
| B | 6 | 203 | 215246 | 1636.75 | 710 | 693 | 131.1 |
| C | 0 | 10 | 1812037 | 13087.98 | 605 | 609 | 138.4 |
| C | 3 | 233 | 1602832 | 11576.43 | 605 | 609 | 138.4 |
| C | 14 | 238 | 169659 | 1221.42 | 605 | 609 | 138.4 |
| D | 8 | 195 | 2255375 | 13340.96 | 714 | 696 | 169.0 |
| D | 12 | 6 | 377730 | 2230.91 | 714 | 696 | 169.0 |
| D | 12 | 3 | 366659 | 2165.41 | 714 | 696 | 169.0 |
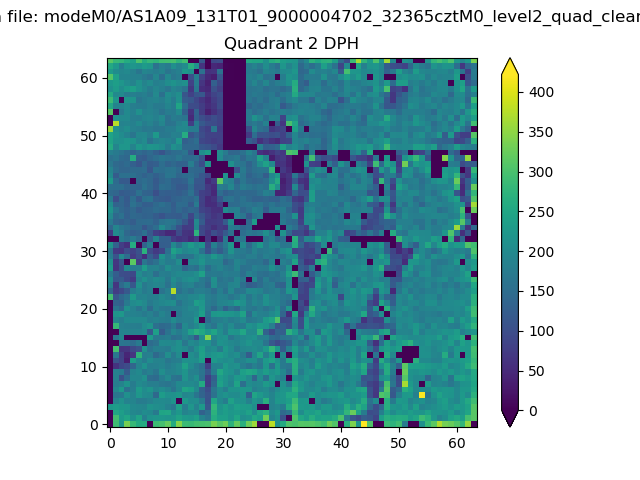
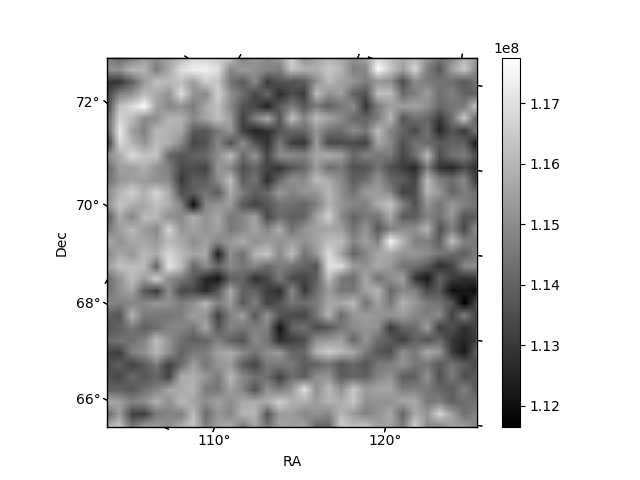
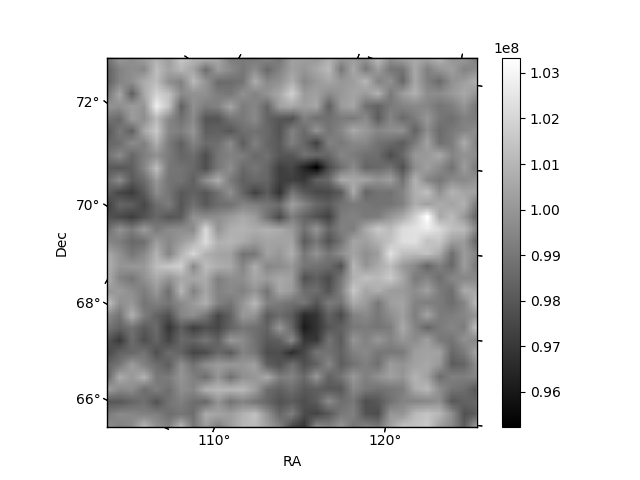
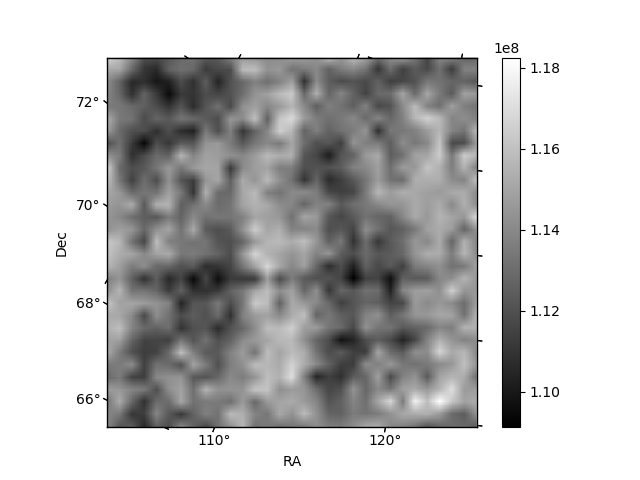
Histogram calculated using DETX and DETY for each event in the final _common_clean file
| Quadrant A | 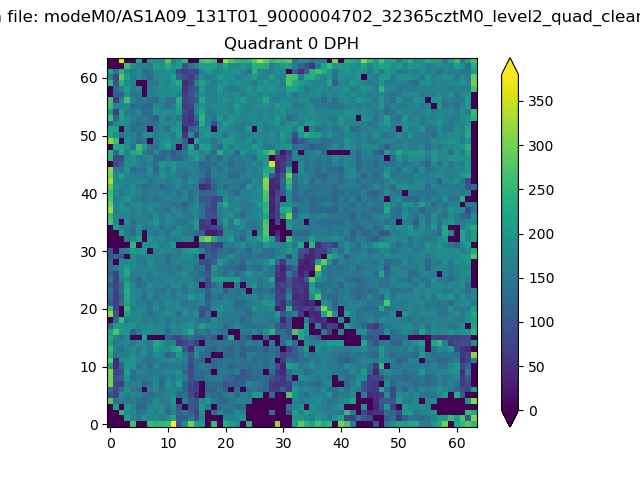 |
 |
Quadrant B |
|---|---|---|---|
| Quadrant D |  |
 |
Quadrant C |
| Plot type | Count rate plots | Images |
|---|---|---|
| Comparison with Poisson distribution Blue bars denote a histogram of data divided into 1 sec bins. Red curve is a Poisson curve with rate = median count rate of data. |
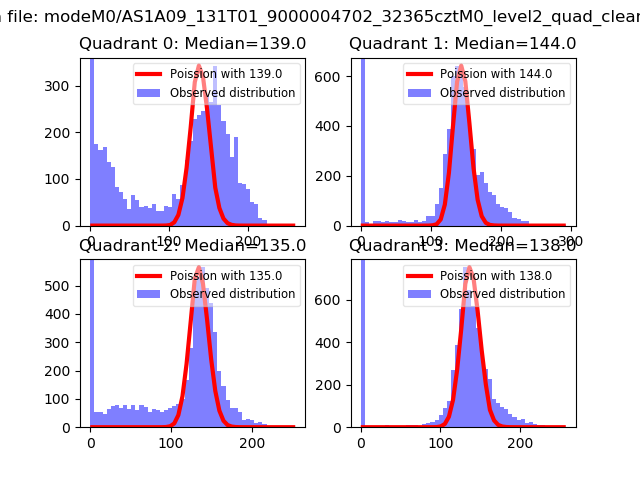 |
 |
| Quadrant-wise count rates Data is divided into 100 sec bins |
 |
|
| Module-wise count rates for Quadrant A Data is divided into 100 sec bins |
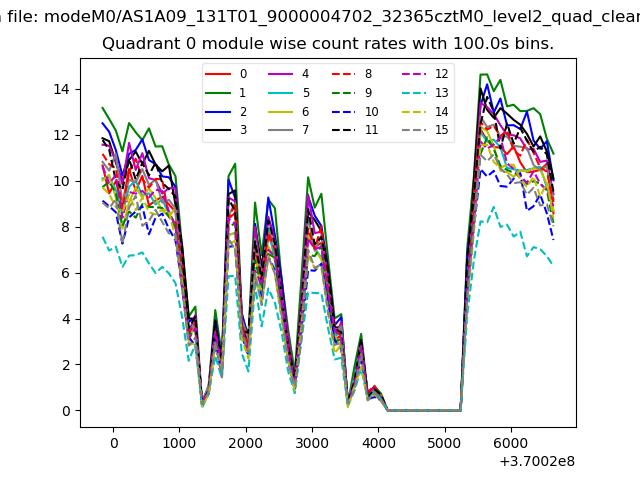 |
 |
| Module-wise count rates for Quadrant B Data is divided into 100 sec bins |
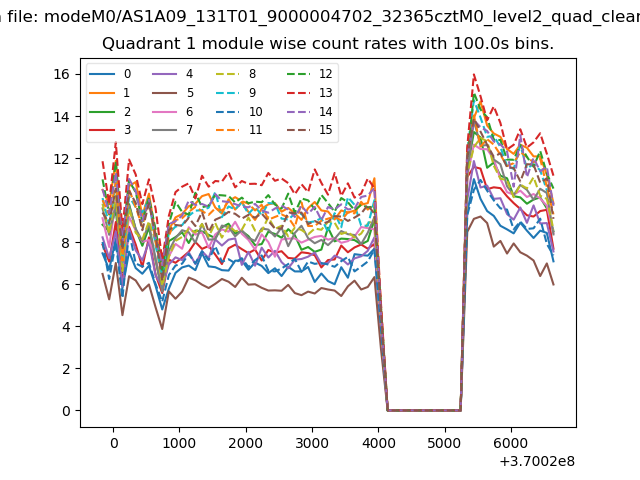 |
 |
| Module-wise count rates for Quadrant C Data is divided into 100 sec bins |
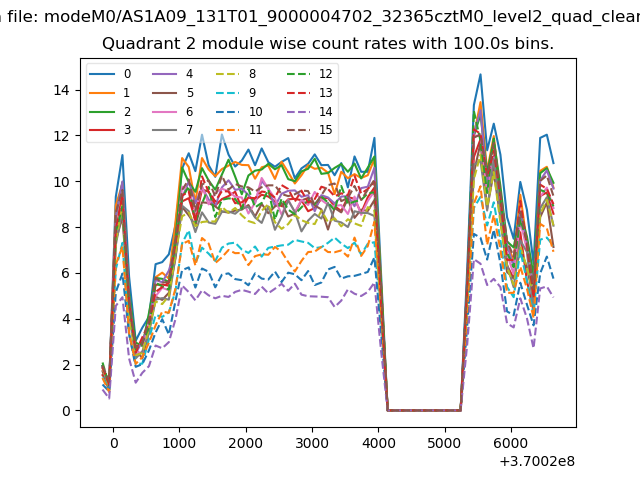 |
 |
| Module-wise count rates for Quadrant D Data is divided into 100 sec bins |
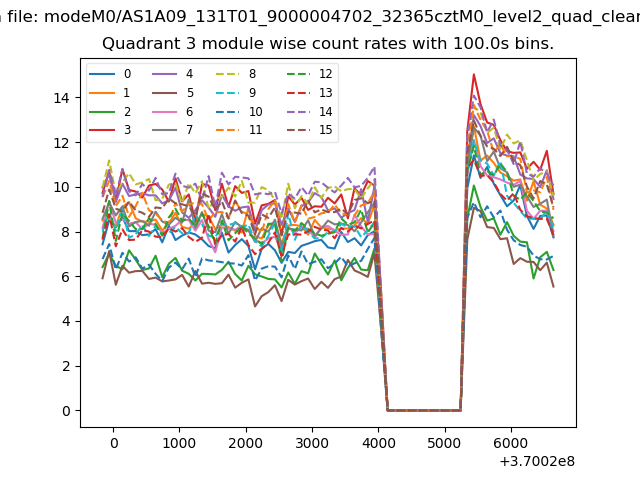 |
 |
| Parameter | Plot |
|---|---|
| CZT HV Monitor |  |
| D_VDD | 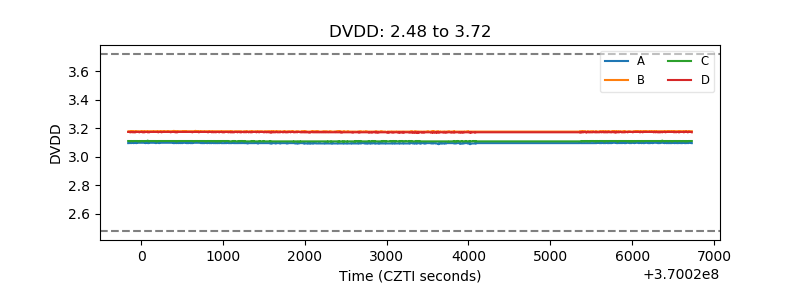 |
| Temperature 1 |  |
| Veto HV Monitor | 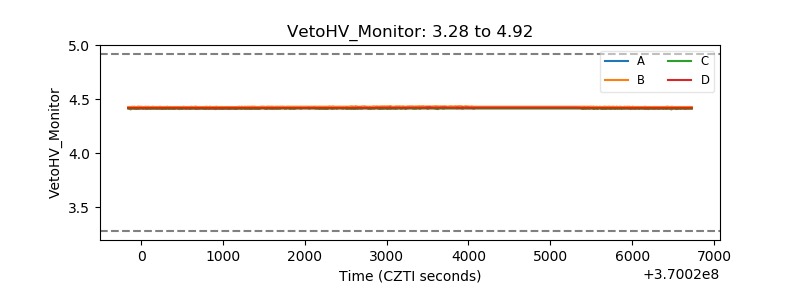 |
| Veto LLD | 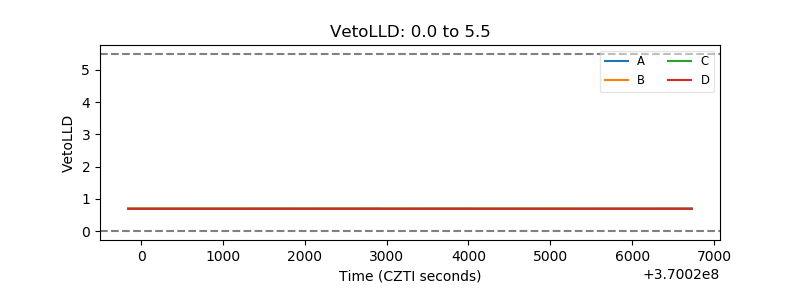 |
| Alpha Counter | 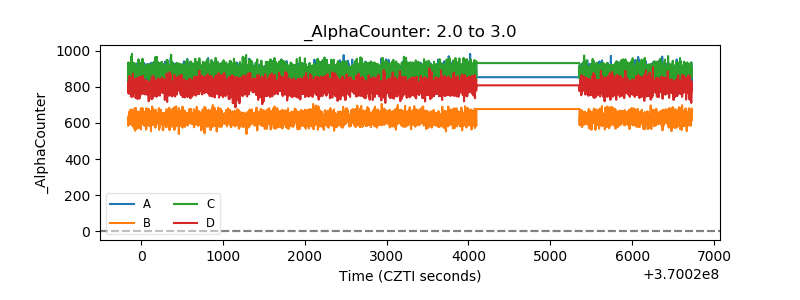 |
| _CPM_Rate | 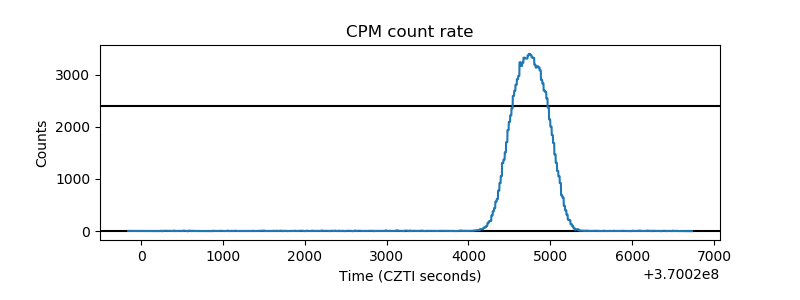 |
| CZT Counter | 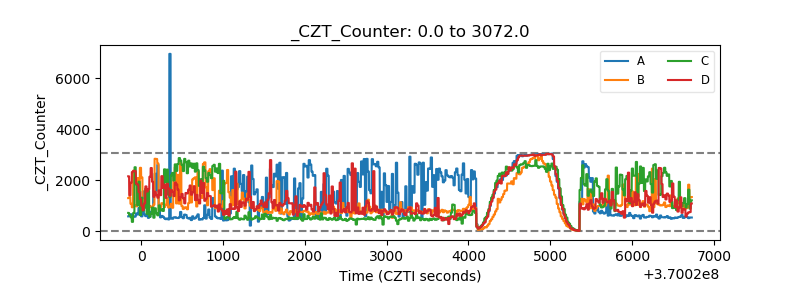 |
| +2.5 Volts monitor |  |
| +5 Volts monitor |  |
| _ROLL_ROT | 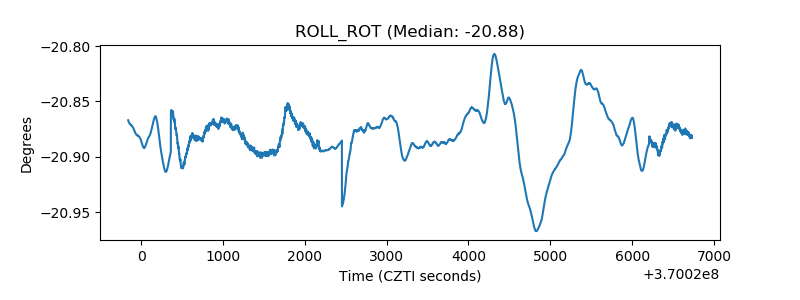 |
| _Roll_DEC | 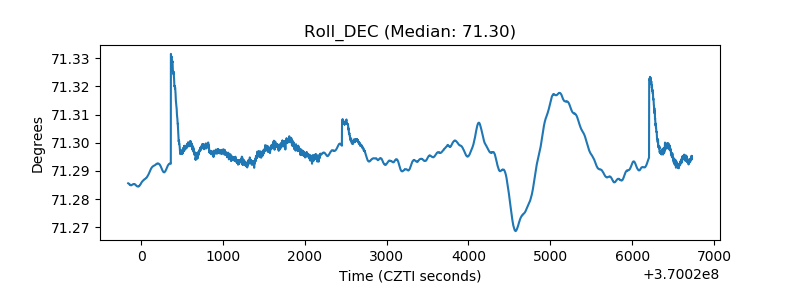 |
| _Roll_RA | 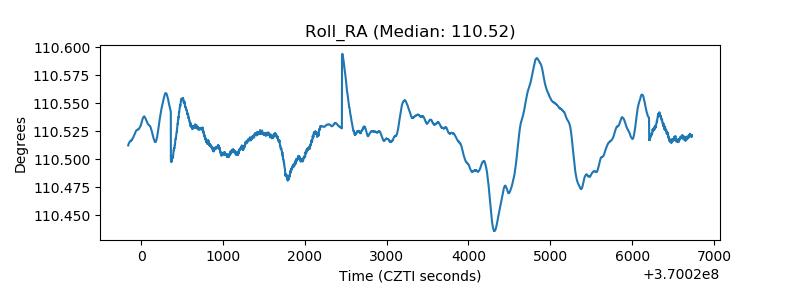 |
| Veto Counter | 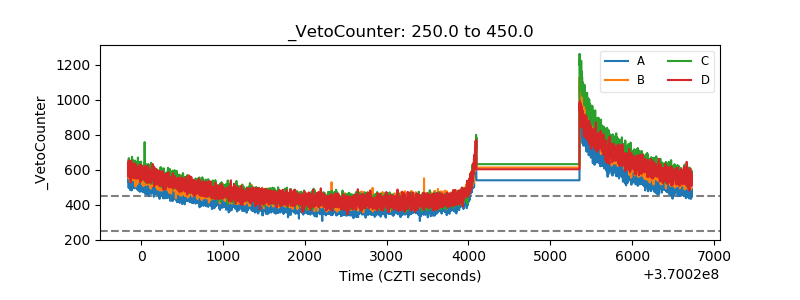 |