| Param | Original file | Final file |
|---|---|---|
| Filename | modeM0/AS1A09_131T01_9000004702_32367cztM0_level2.evt | modeM0/AS1A09_131T01_9000004702_32367cztM0_level2_quad_clean.evt |
| Size (bytes) | 636,710,400 | 125,009,280 |
| Size | 607.2 MB | 119.2 MB |
| Events in quadrant A | 2,982,992 | 890,180 |
| Events in quadrant B | 5,831,842 | 862,846 |
| Events in quadrant C | 4,303,267 | 871,185 |
| Events in quadrant D | 5,765,786 | 749,118 |
| Mode M0 | |||
|---|---|---|---|
| Quadrant | BADHDUFLAG | Total packets | Discarded packets |
| A | 0 | 12567 | 2 |
| B | 0 | 21547 | 1 |
| C | 0 | 16812 | 1 |
| D | 0 | 21095 | 1 |
| Mode SS | |||
|---|---|---|---|
| Quadrant | BADHDUFLAG | Total packets | Discarded packets |
| A | 0 | 118 | 0 |
| B | 0 | 118 | 0 |
| C | 0 | 118 | 0 |
| D | 0 | 118 | 0 |
| Mode M9 | |||
|---|---|---|---|
| Quadrant | BADHDUFLAG | Total packets | Discarded packets |
| A | 0 | 14 | 0 |
| B | 0 | 14 | 0 |
| C | 0 | 14 | 0 |
| D | 0 | 14 | 0 |
| Quadrant | Total seconds | Saturated seconds | Saturation percentage |
|---|---|---|---|
| A | 5906 | 63 | 1.066712% |
| B | 5906 | 504 | 8.533695% |
| C | 5906 | 474 | 8.025737% |
| D | 5906 | 1083 | 18.337284% |
Noise dominated data is calculated using 1-second bins in cleaned event files. If a bin has >2000 counts, and if more than 50% of those come from <1% of pixels, then it is considered to be noise-dominated and hence unusable.
| Quadrant | # 1 sec bins | Bins with >0 counts | Bins with >2000 counts | High rate bins dominated by noise | Noise dominated (total time) | Noise dominated (detector-on time) | Marked lightcurve |
|---|---|---|---|---|---|---|---|
| A | 7221 | 5907 | 0 | 0 | 0.00% | 0.00% | 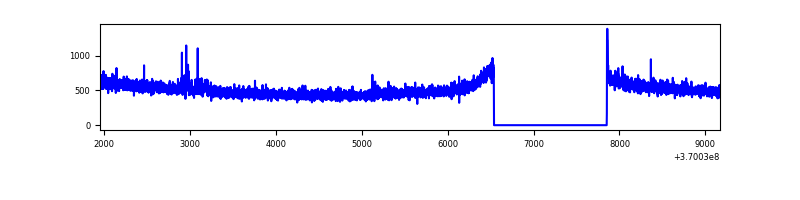 |
| B | 7221 | 5907 | 217 | 217 | 3.01% | 3.67% | 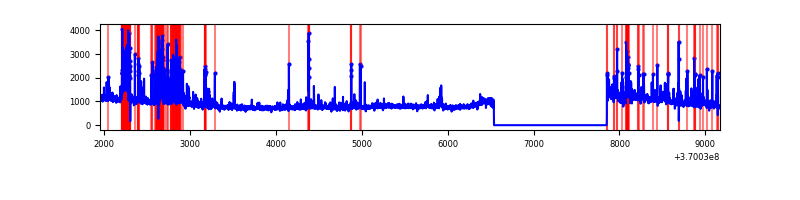 |
| C | 7221 | 5907 | 133 | 133 | 1.84% | 2.25% | 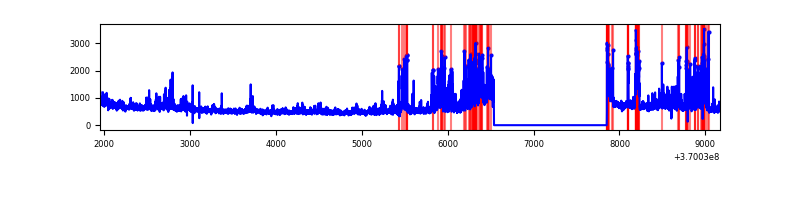 |
| D | 7221 | 5907 | 764 | 764 | 10.58% | 12.93% | 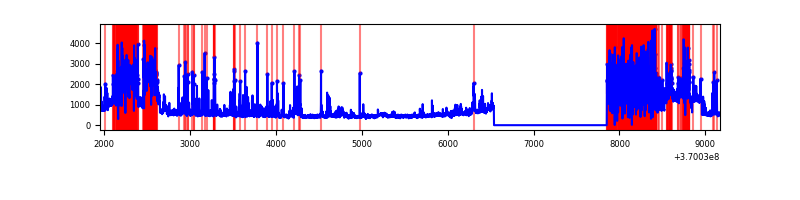 |
Top three noisy pixels from each quadrant. If the there are fewer than three noisy pixels in the level2.evt file, extra rows are filled as -1
| Pixel properties | Quadrant properties | ||||||
|---|---|---|---|---|---|---|---|
| Quadrant | DetID | PixID | Counts | Sigma | Mean | Median | Sigma |
| A | 15 | 174 | 17886 | 113.23 | 764 | 748 | 151.4 |
| A | 13 | 6 | 13808 | 86.28 | 764 | 748 | 151.4 |
| A | 13 | 254 | 12623 | 78.46 | 764 | 748 | 151.4 |
| B | 6 | 159 | 1817896 | 13270.29 | 739 | 722 | 136.9 |
| B | 5 | 172 | 555321 | 4050.08 | 739 | 722 | 136.9 |
| B | 4 | 80 | 133308 | 968.24 | 739 | 722 | 136.9 |
| C | 3 | 233 | 956954 | 5643.3 | 737 | 742 | 169.4 |
| C | 0 | 10 | 190807 | 1121.71 | 737 | 742 | 169.4 |
| C | 14 | 238 | 138075 | 810.5 | 737 | 742 | 169.4 |
| D | 8 | 195 | 802906 | 5071.98 | 661 | 643 | 158.2 |
| D | 1 | 47 | 747076 | 4719.02 | 661 | 643 | 158.2 |
| D | 12 | 218 | 597146 | 3771.15 | 661 | 643 | 158.2 |
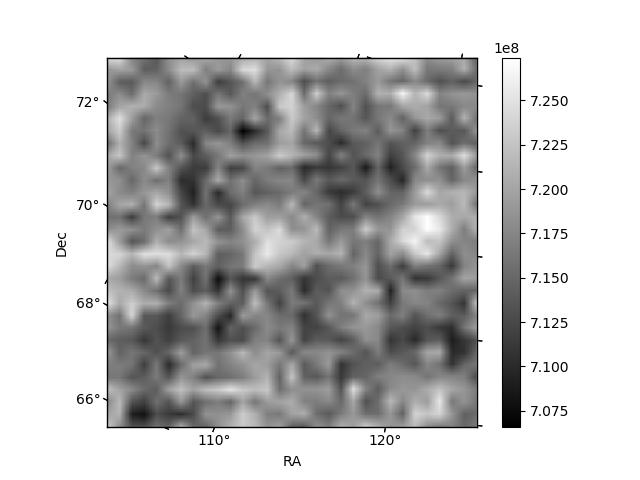
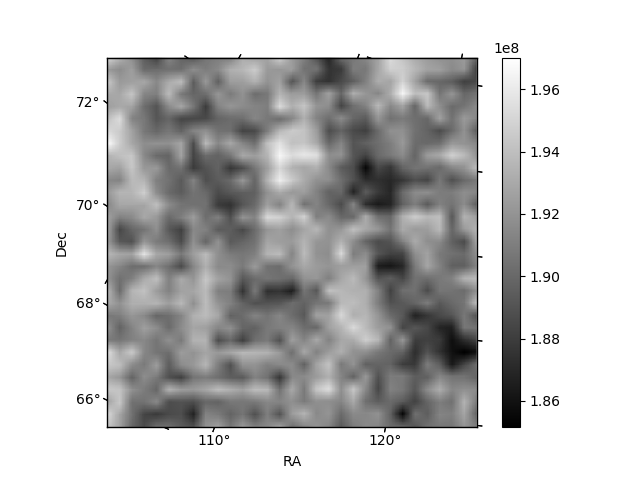
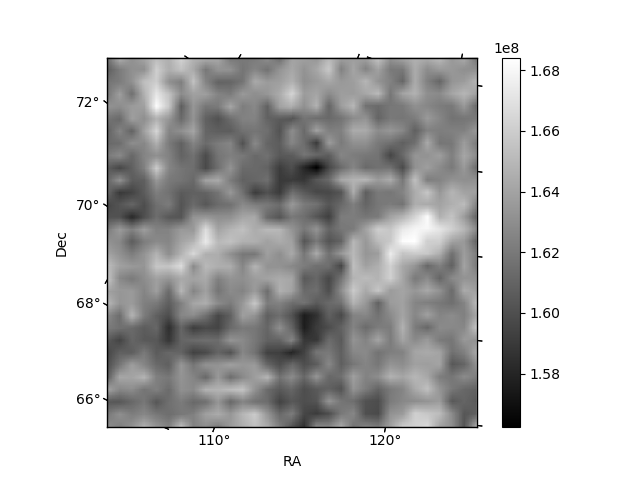
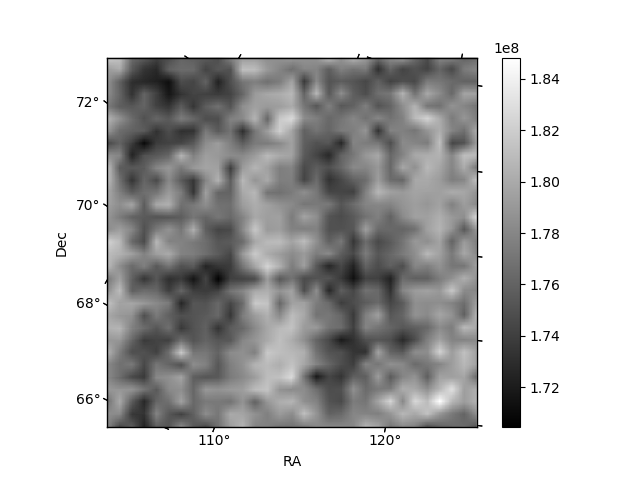
Histogram calculated using DETX and DETY for each event in the final _common_clean file
| Quadrant A | 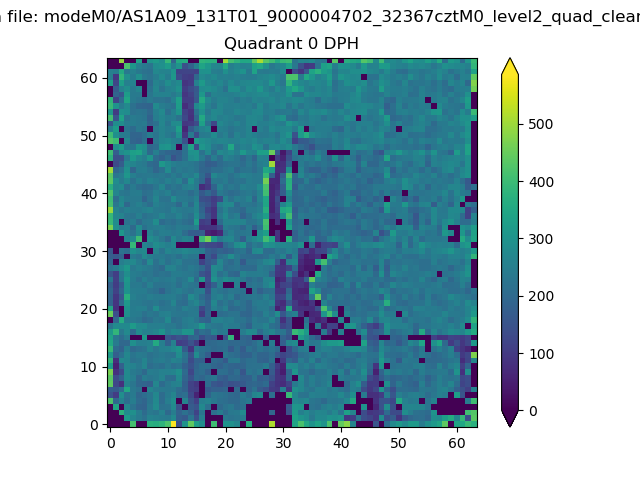 |
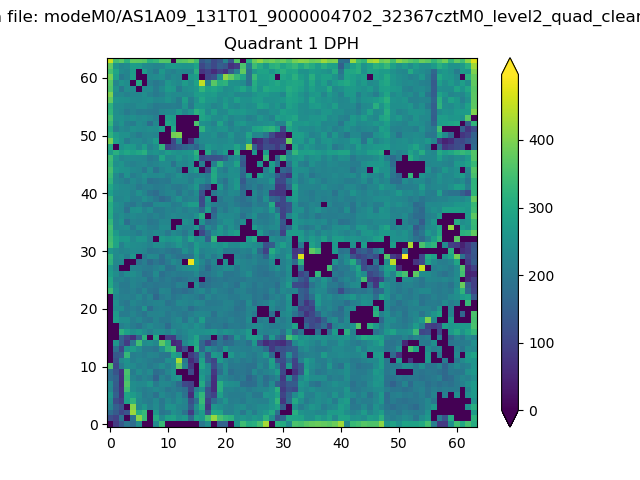 |
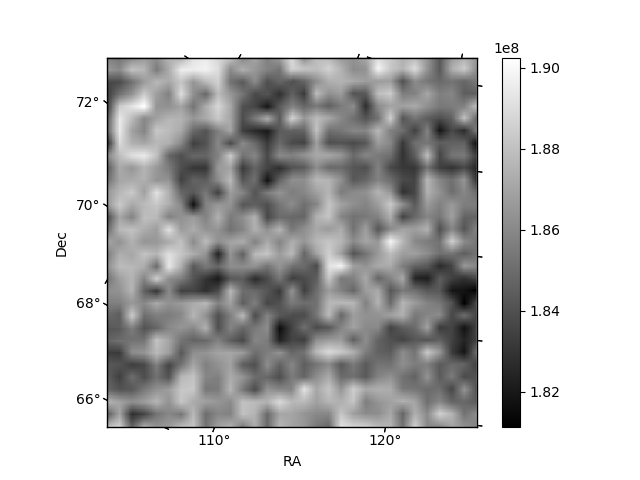
Quadrant B |
|---|---|---|---|
| Quadrant D |  |
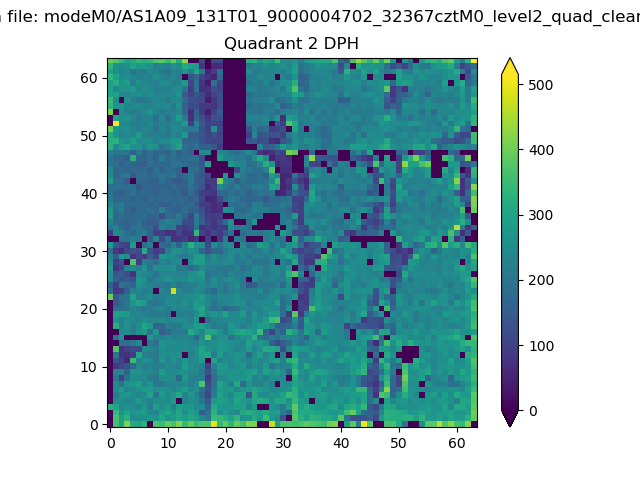 |
Quadrant C |
| Plot type | Count rate plots | Images |
|---|---|---|
| Comparison with Poisson distribution Blue bars denote a histogram of data divided into 1 sec bins. Red curve is a Poisson curve with rate = median count rate of data. |
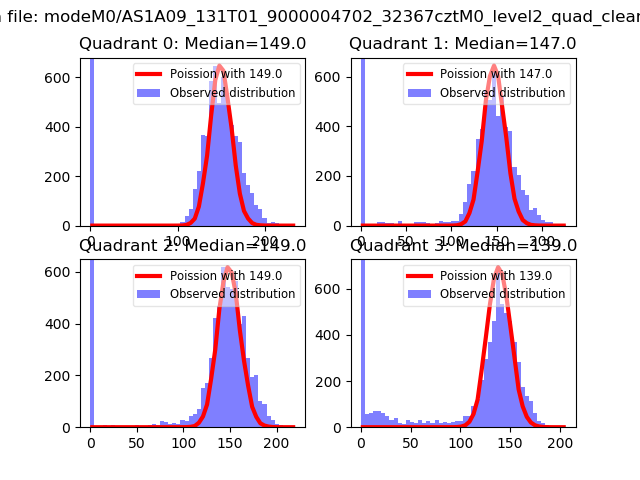 |
 |
| Quadrant-wise count rates Data is divided into 100 sec bins |
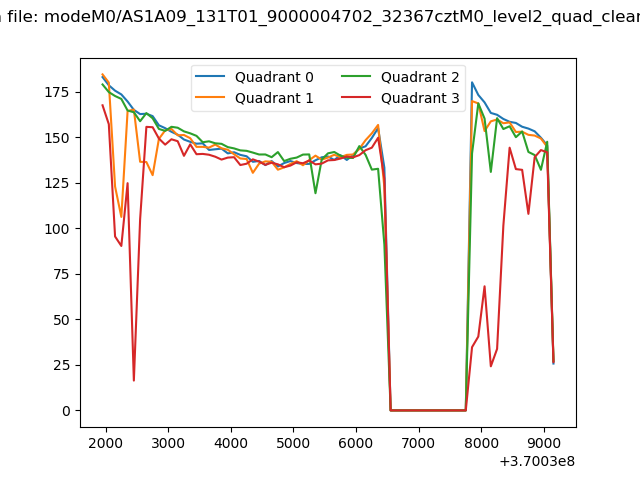 |
|
| Module-wise count rates for Quadrant A Data is divided into 100 sec bins |
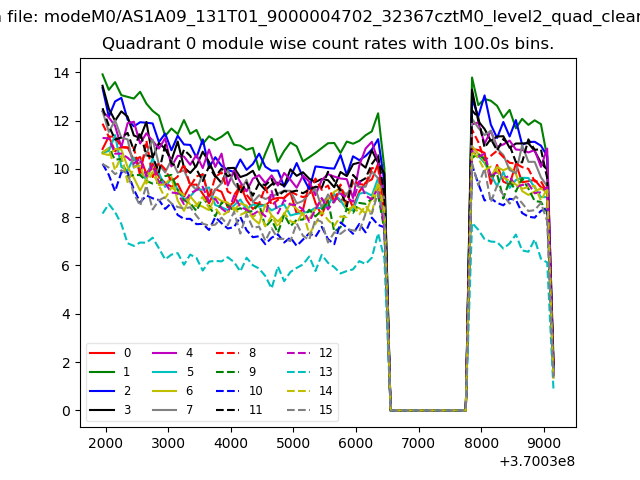 |
 |
| Module-wise count rates for Quadrant B Data is divided into 100 sec bins |
 |
 |
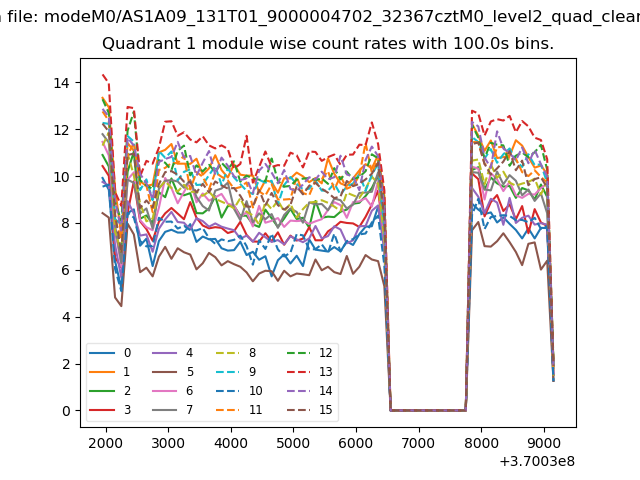
| Module-wise count rates for Quadrant C Data is divided into 100 sec bins |
 |
 |
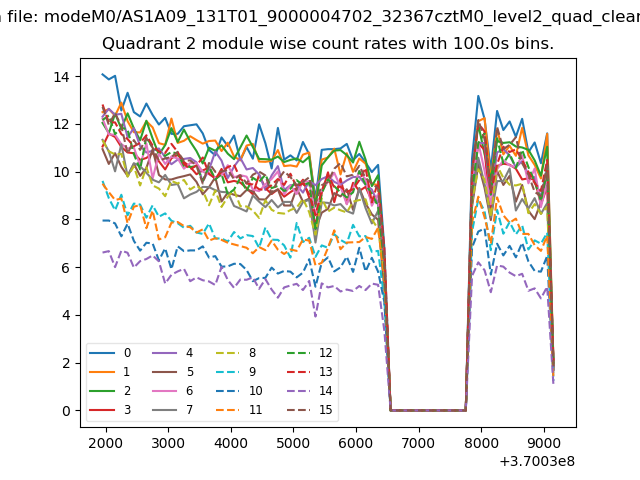
| Module-wise count rates for Quadrant D Data is divided into 100 sec bins |
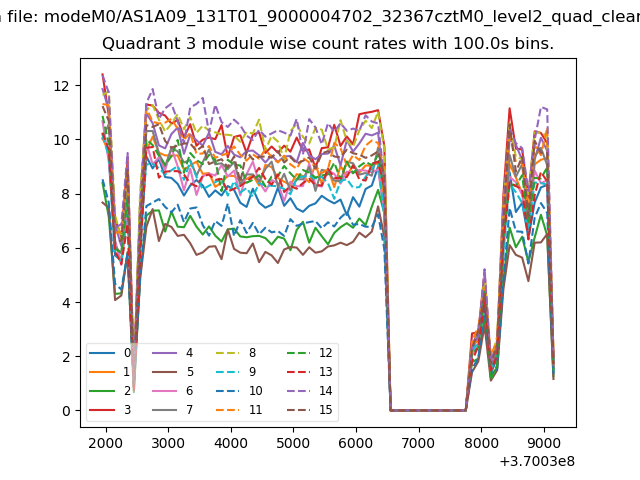 |
 |
| Parameter | Plot |
|---|---|
| CZT HV Monitor | 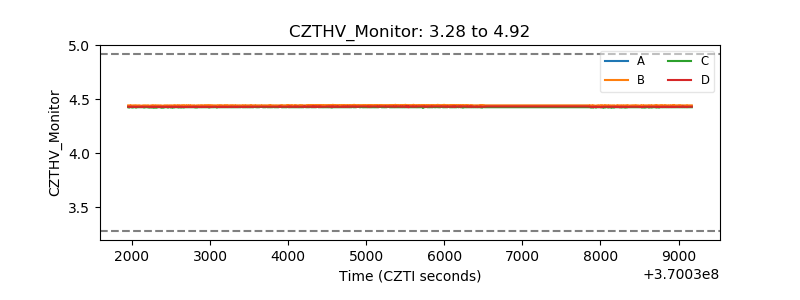 |
| D_VDD | 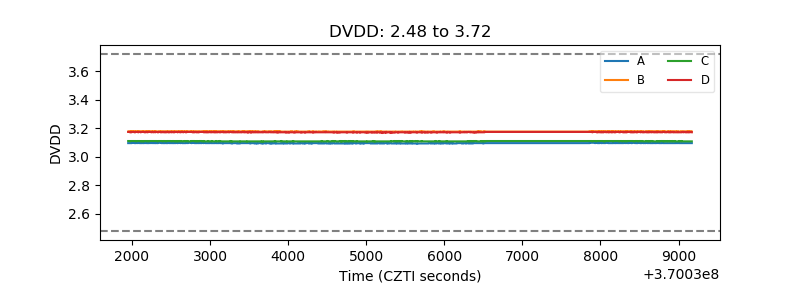 |
| Temperature 1 | 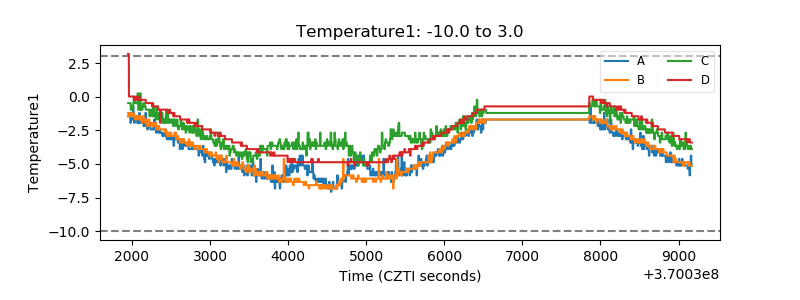 |
| Veto HV Monitor | 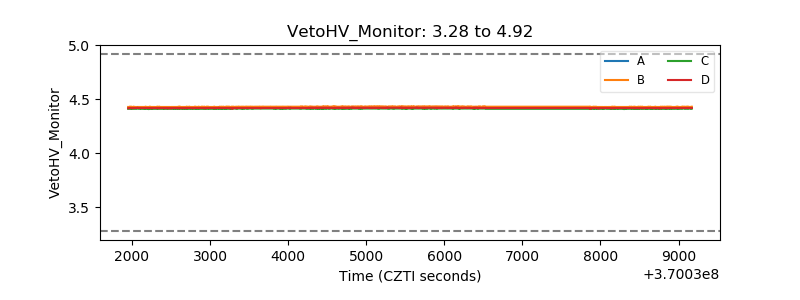 |
| Veto LLD | 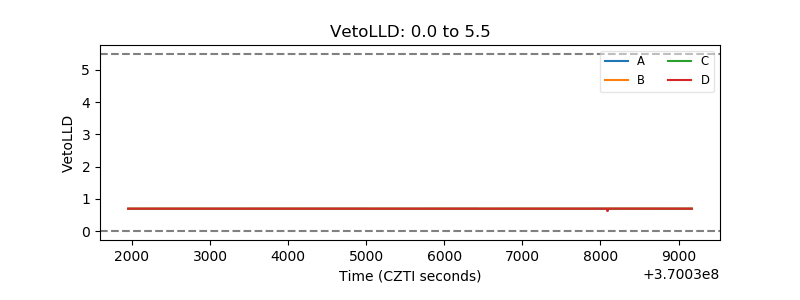 |
| Alpha Counter | 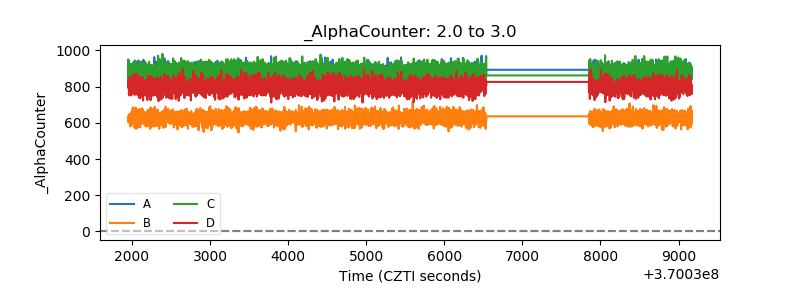 |
| _CPM_Rate | 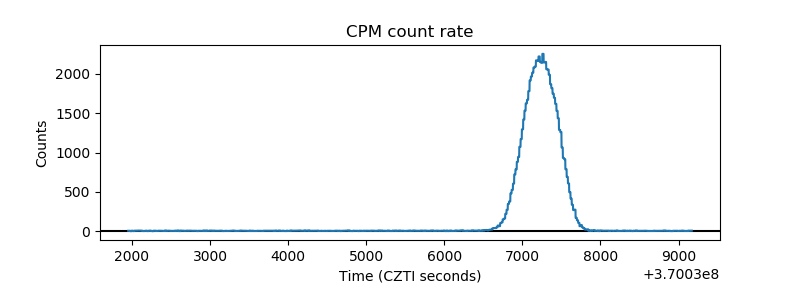 |
| CZT Counter | 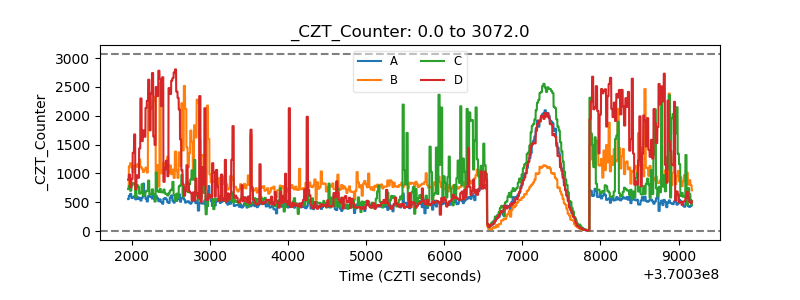 |
| +2.5 Volts monitor | 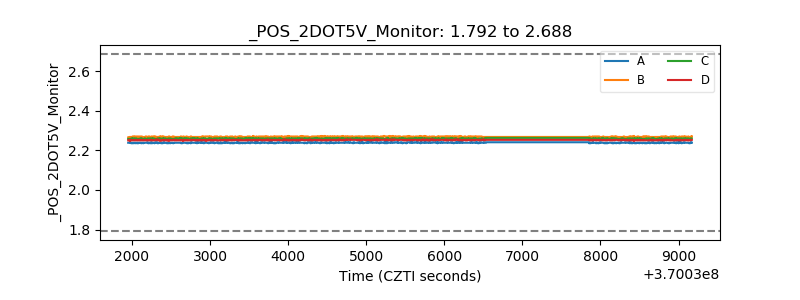 |
| +5 Volts monitor |  |
| _ROLL_ROT | 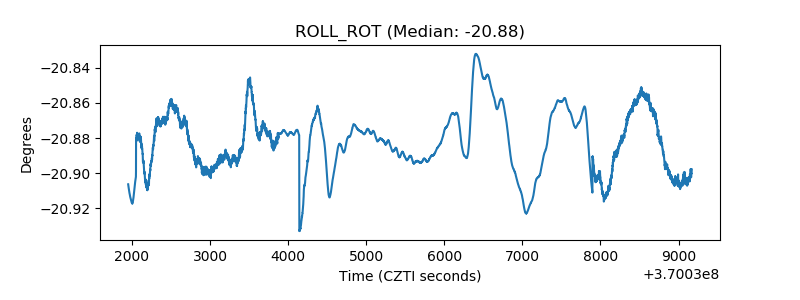 |
| _Roll_DEC | 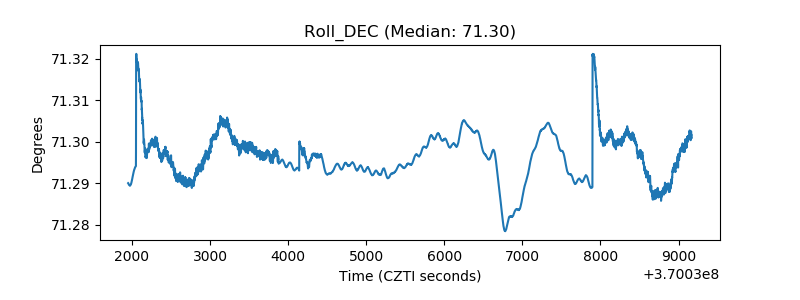 |
| _Roll_RA | 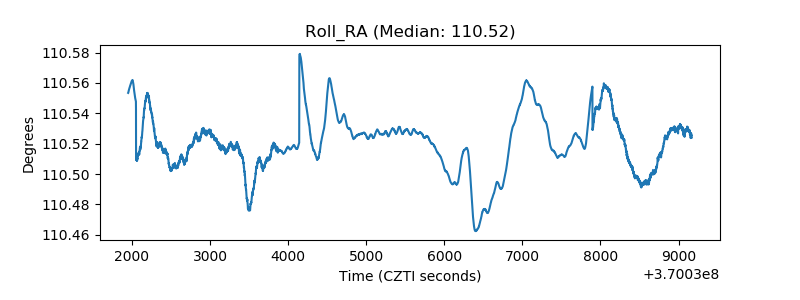 |
| Veto Counter | 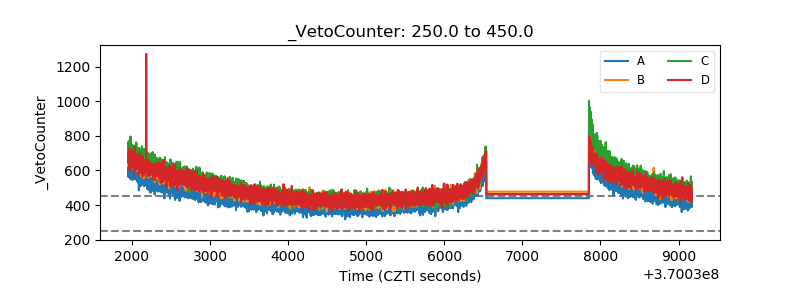 |