| Param | Original file | Final file |
|---|---|---|
| Filename | modeM0/AS1A09_131T01_9000004702_32368cztM0_level2.evt | modeM0/AS1A09_131T01_9000004702_32368cztM0_level2_quad_clean.evt |
| Size (bytes) | 657,060,480 | 129,268,800 |
| Size | 626.6 MB | 123.3 MB |
| Events in quadrant A | 3,122,257 | 905,600 |
| Events in quadrant B | 5,792,759 | 896,081 |
| Events in quadrant C | 4,138,709 | 890,531 |
| Events in quadrant D | 6,416,776 | 779,815 |
| Mode M0 | |||
|---|---|---|---|
| Quadrant | BADHDUFLAG | Total packets | Discarded packets |
| A | 0 | 13318 | 3 |
| B | 0 | 21858 | 2 |
| C | 0 | 16558 | 2 |
| D | 0 | 23373 | 2 |
| Mode SS | |||
|---|---|---|---|
| Quadrant | BADHDUFLAG | Total packets | Discarded packets |
| A | 0 | 128 | 0 |
| B | 0 | 128 | 0 |
| C | 0 | 128 | 0 |
| D | 0 | 128 | 0 |
| Mode M9 | |||
|---|---|---|---|
| Quadrant | BADHDUFLAG | Total packets | Discarded packets |
| A | 0 | 13 | 0 |
| B | 0 | 13 | 0 |
| C | 0 | 13 | 0 |
| D | 0 | 14 | 0 |
| Quadrant | Total seconds | Saturated seconds | Saturation percentage |
|---|---|---|---|
| A | 6345 | 22 | 0.346730% |
| B | 6345 | 375 | 5.910165% |
| C | 6345 | 386 | 6.083530% |
| D | 6345 | 1051 | 16.564224% |
Noise dominated data is calculated using 1-second bins in cleaned event files. If a bin has >2000 counts, and if more than 50% of those come from <1% of pixels, then it is considered to be noise-dominated and hence unusable.
| Quadrant | # 1 sec bins | Bins with >0 counts | Bins with >2000 counts | High rate bins dominated by noise | Noise dominated (total time) | Noise dominated (detector-on time) | Marked lightcurve |
|---|---|---|---|---|---|---|---|
| A | 7550 | 6346 | 0 | 0 | 0.00% | 0.00% | 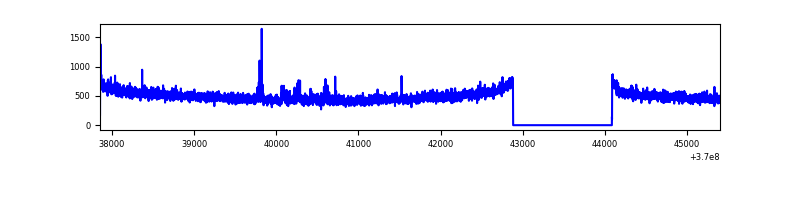 |
| B | 7550 | 6346 | 153 | 153 | 2.03% | 2.41% | 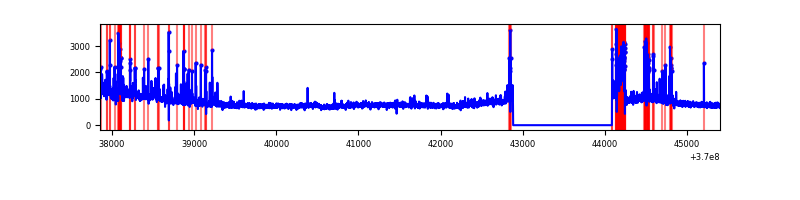 |
| C | 7550 | 6346 | 92 | 92 | 1.22% | 1.45% | 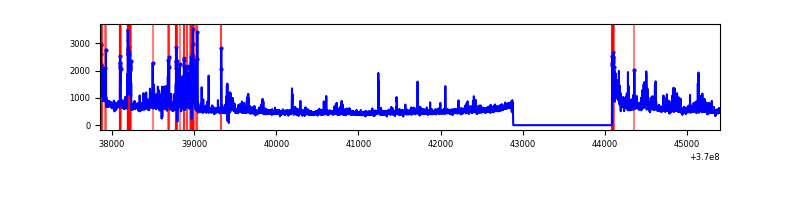 |
| D | 7550 | 6346 | 699 | 699 | 9.26% | 11.01% | 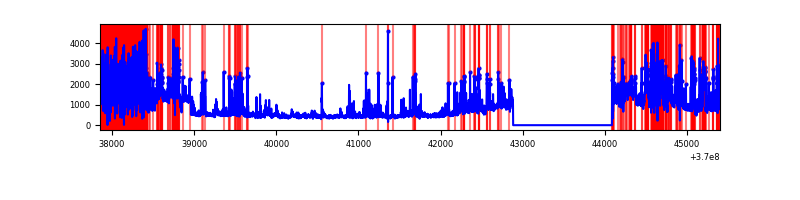 |
Top three noisy pixels from each quadrant. If the there are fewer than three noisy pixels in the level2.evt file, extra rows are filled as -1
| Pixel properties | Quadrant properties | ||||||
|---|---|---|---|---|---|---|---|
| Quadrant | DetID | PixID | Counts | Sigma | Mean | Median | Sigma |
| A | 12 | 96 | 47021 | 295.14 | 791 | 776 | 156.7 |
| A | 13 | 6 | 17985 | 109.83 | 791 | 776 | 156.7 |
| A | 13 | 254 | 12881 | 77.26 | 791 | 776 | 156.7 |
| B | 6 | 159 | 1923641 | 13223.78 | 776 | 757 | 145.4 |
| B | 0 | 155 | 287335 | 1970.81 | 776 | 757 | 145.4 |
| B | 5 | 172 | 179094 | 1226.43 | 776 | 757 | 145.4 |
| C | 3 | 233 | 595263 | 3387.95 | 765 | 773 | 175.5 |
| C | 0 | 10 | 244379 | 1388.29 | 765 | 773 | 175.5 |
| C | 14 | 238 | 153624 | 871.09 | 765 | 773 | 175.5 |
| D | 8 | 195 | 1293803 | 7774.75 | 699 | 679 | 166.3 |
| D | 1 | 47 | 614066 | 3687.91 | 699 | 679 | 166.3 |
| D | 12 | 218 | 582907 | 3500.57 | 699 | 679 | 166.3 |
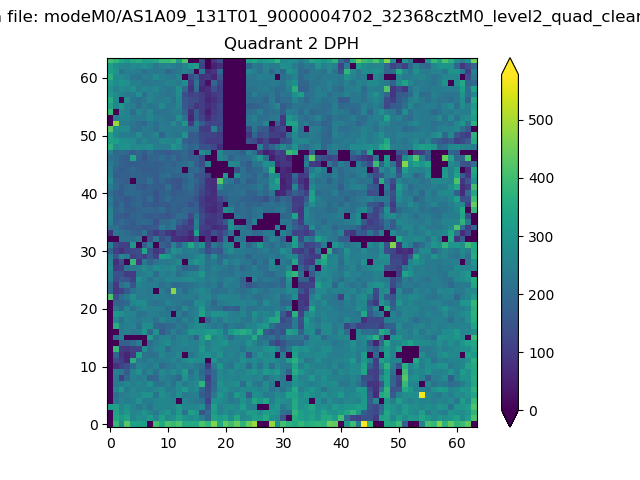
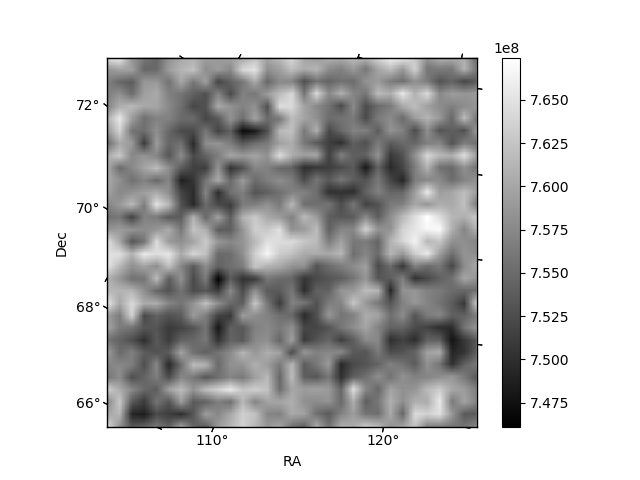
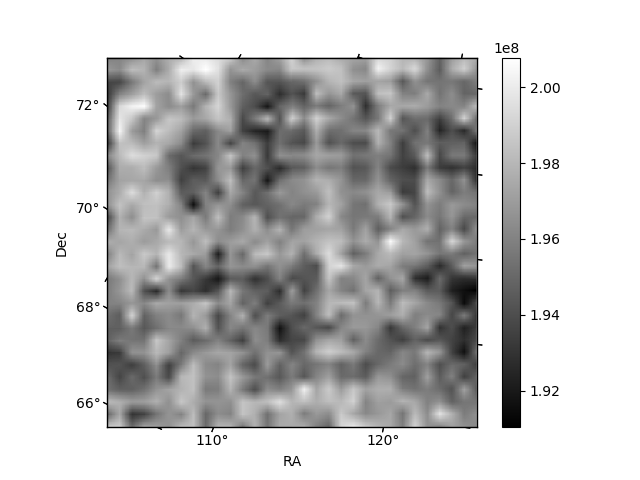
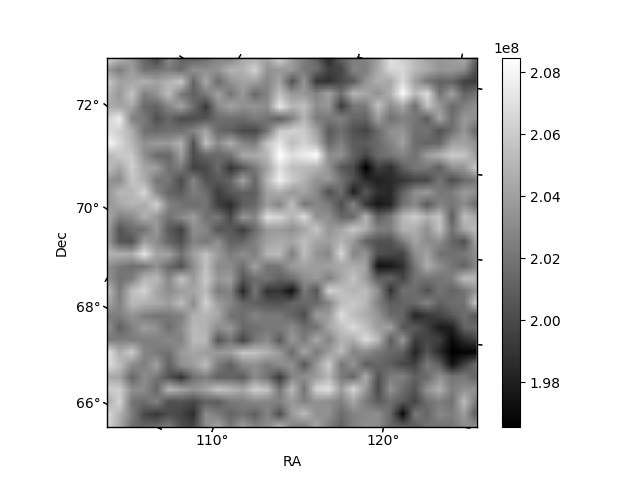
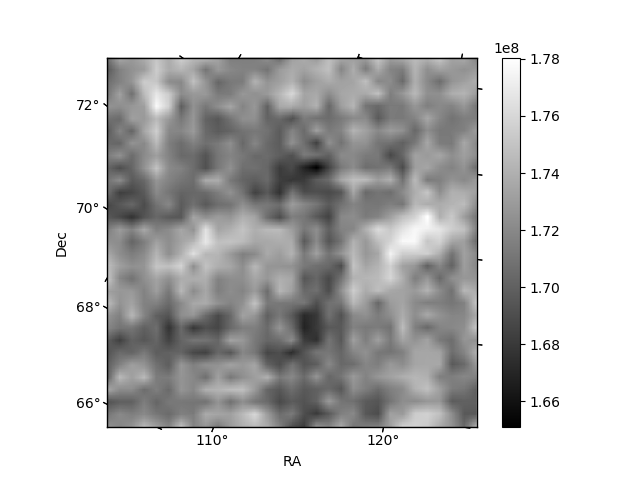
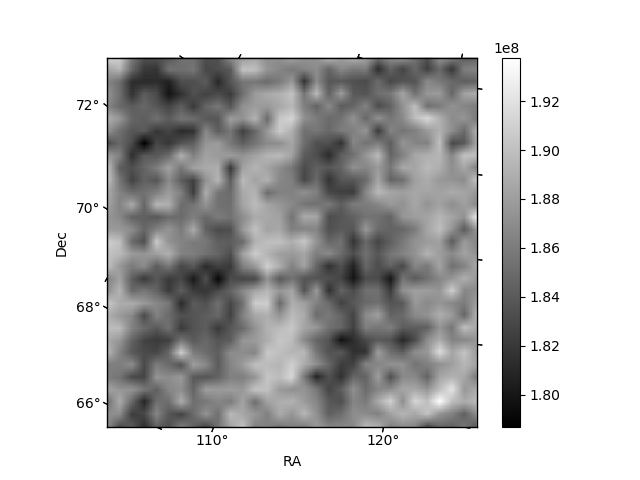
Histogram calculated using DETX and DETY for each event in the final _common_clean file
| Quadrant A | 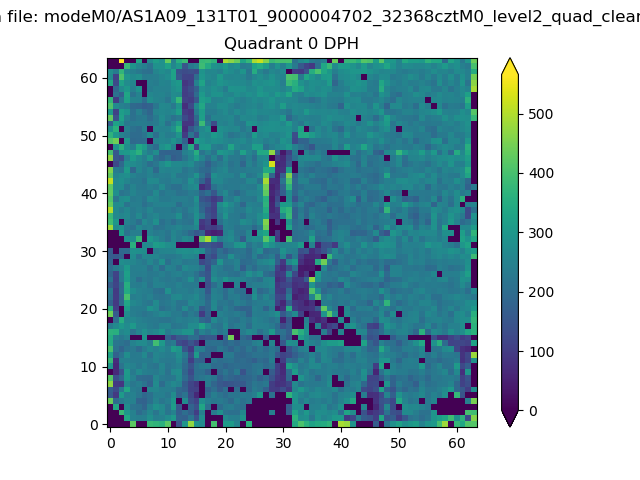 |
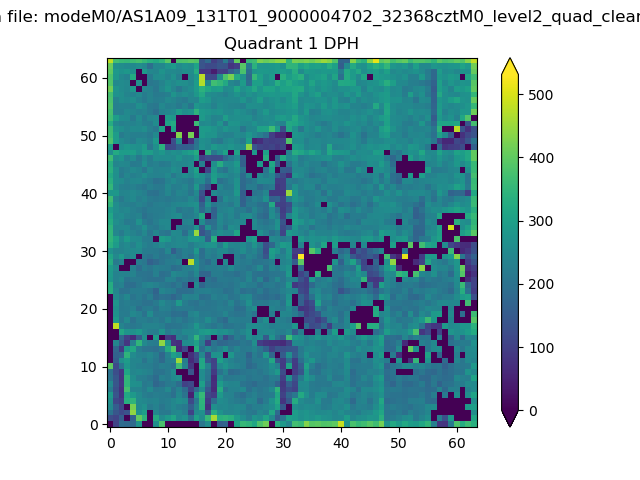 |
Quadrant B |
|---|---|---|---|
| Quadrant D | 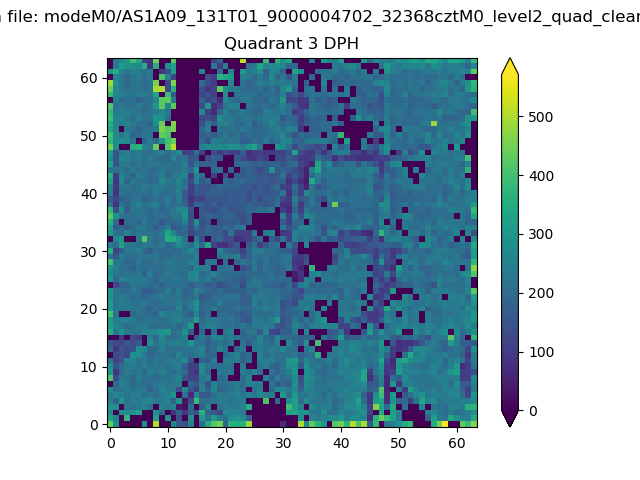 |
 |
Quadrant C |
| Plot type | Count rate plots | Images |
|---|---|---|
| Comparison with Poisson distribution Blue bars denote a histogram of data divided into 1 sec bins. Red curve is a Poisson curve with rate = median count rate of data. |
 |
 |
| Quadrant-wise count rates Data is divided into 100 sec bins |
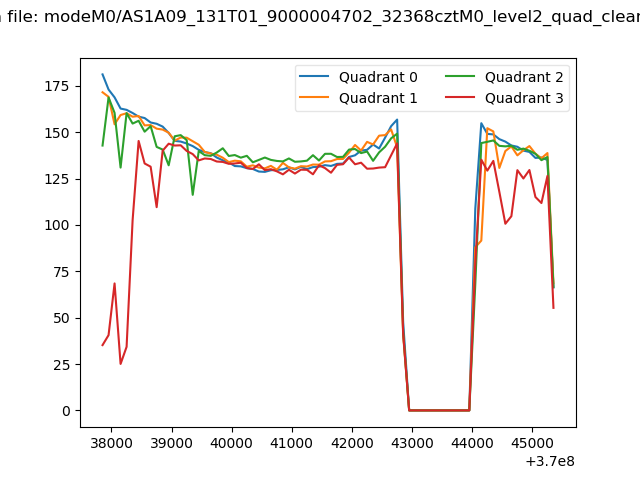 |
|
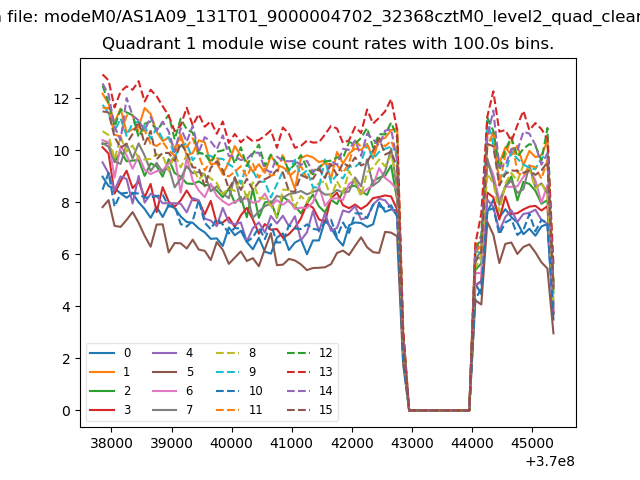
| Module-wise count rates for Quadrant A Data is divided into 100 sec bins |
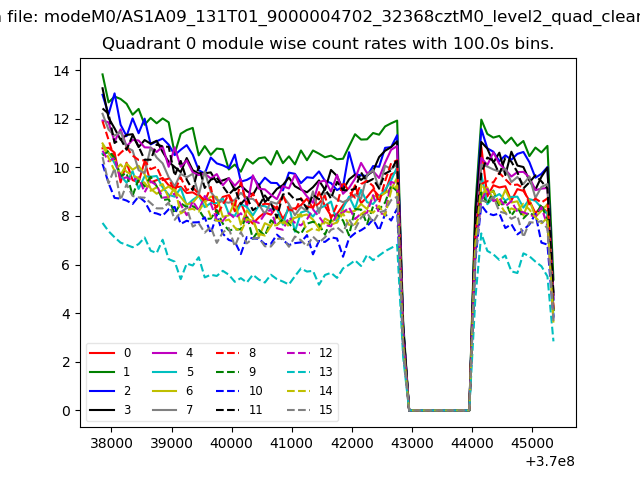 |
 |
| Module-wise count rates for Quadrant B Data is divided into 100 sec bins |
 |
 |
| Module-wise count rates for Quadrant C Data is divided into 100 sec bins |
 |
 |
| Module-wise count rates for Quadrant D Data is divided into 100 sec bins |
 |
 |
| Parameter | Plot |
|---|---|
| CZT HV Monitor |  |
| D_VDD | 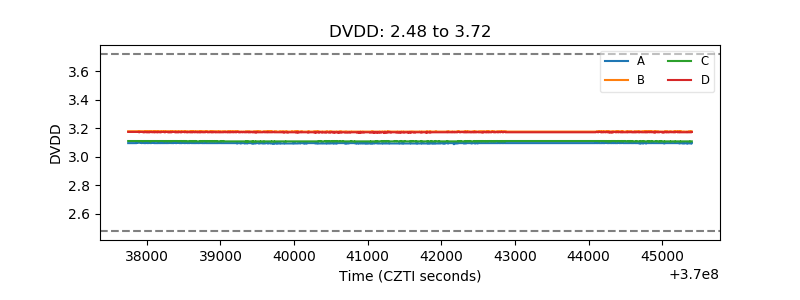 |
| Temperature 1 | 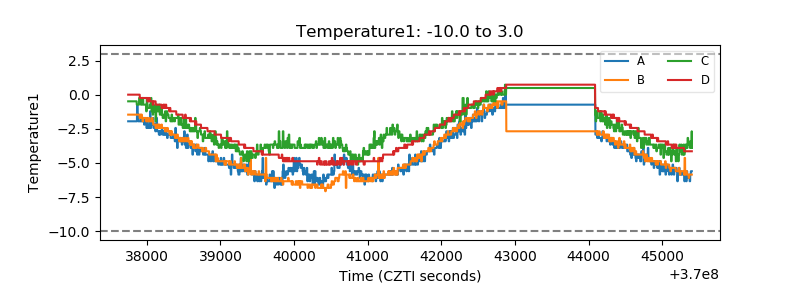 |
| Veto HV Monitor | 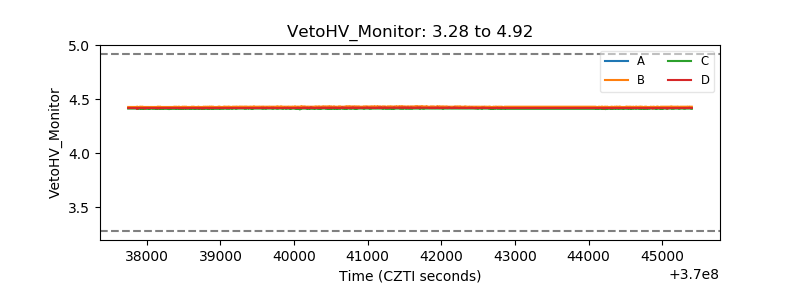 |
| Veto LLD | 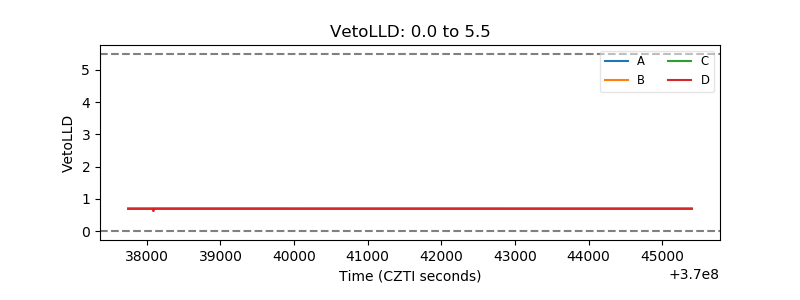 |
| Alpha Counter | 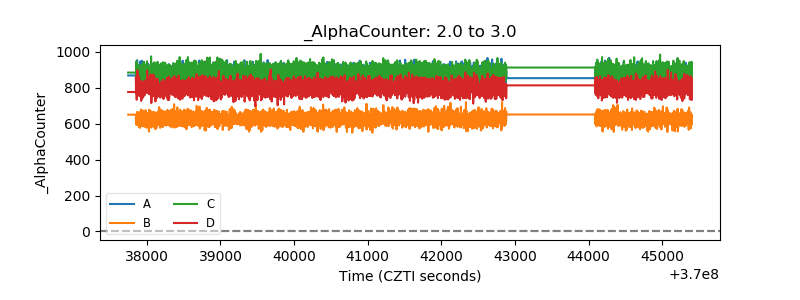 |
| _CPM_Rate | 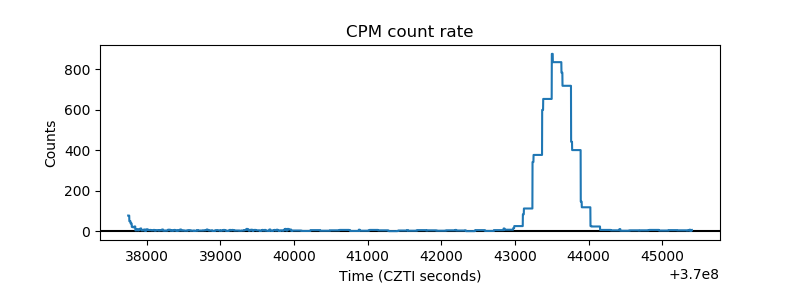 |
| CZT Counter | 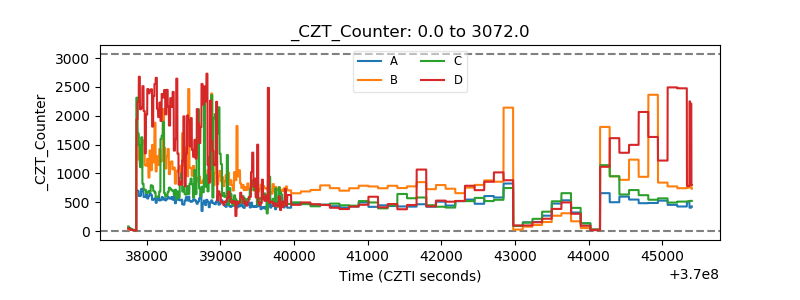 |
| +2.5 Volts monitor |  |
| +5 Volts monitor |  |
| _ROLL_ROT |  |
| _Roll_DEC | 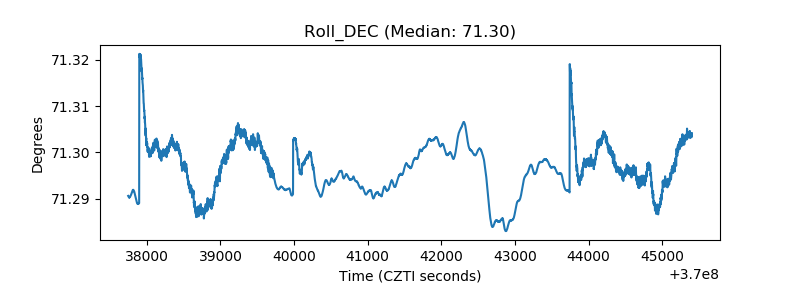 |
| _Roll_RA | 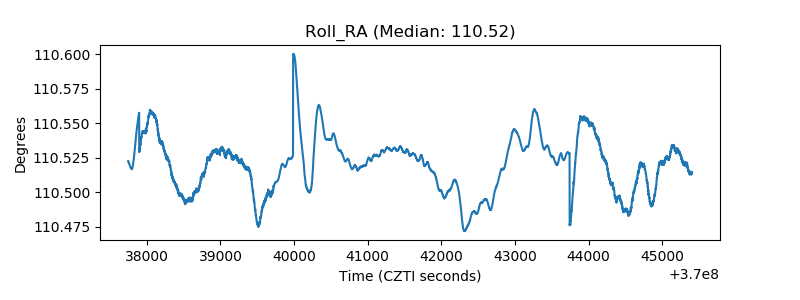 |
| Veto Counter |  |