| Param | Original file | Final file |
|---|---|---|
| Filename | modeM0/AS1A09_131T01_9000004702_32369cztM0_level2.evt | modeM0/AS1A09_131T01_9000004702_32369cztM0_level2_quad_clean.evt |
| Size (bytes) | 725,267,520 | 131,627,520 |
| Size | 691.7 MB | 125.5 MB |
| Events in quadrant A | 3,168,331 | 911,875 |
| Events in quadrant B | 5,870,167 | 902,031 |
| Events in quadrant C | 5,720,853 | 865,797 |
| Events in quadrant D | 6,746,174 | 832,058 |
| Mode M0 | |||
|---|---|---|---|
| Quadrant | BADHDUFLAG | Total packets | Discarded packets |
| A | 0 | 13985 | 3 |
| B | 0 | 22495 | 2 |
| C | 0 | 21705 | 2 |
| D | 0 | 24775 | 2 |
| Mode SS | |||
|---|---|---|---|
| Quadrant | BADHDUFLAG | Total packets | Discarded packets |
| A | 0 | 138 | 0 |
| B | 0 | 138 | 0 |
| C | 0 | 138 | 0 |
| D | 0 | 138 | 0 |
| Mode M9 | |||
|---|---|---|---|
| Quadrant | BADHDUFLAG | Total packets | Discarded packets |
| A | 0 | 16 | 0 |
| B | 0 | 16 | 0 |
| C | 0 | 16 | 0 |
| D | 0 | 17 | 0 |
| Quadrant | Total seconds | Saturated seconds | Saturation percentage |
|---|---|---|---|
| A | 6809 | 19 | 0.279042% |
| B | 6809 | 331 | 4.861213% |
| C | 6809 | 697 | 10.236452% |
| D | 6809 | 650 | 9.546189% |
Noise dominated data is calculated using 1-second bins in cleaned event files. If a bin has >2000 counts, and if more than 50% of those come from <1% of pixels, then it is considered to be noise-dominated and hence unusable.
| Quadrant | # 1 sec bins | Bins with >0 counts | Bins with >2000 counts | High rate bins dominated by noise | Noise dominated (total time) | Noise dominated (detector-on time) | Marked lightcurve |
|---|---|---|---|---|---|---|---|
| A | 7649 | 6810 | 0 | 0 | 0.00% | 0.00% | 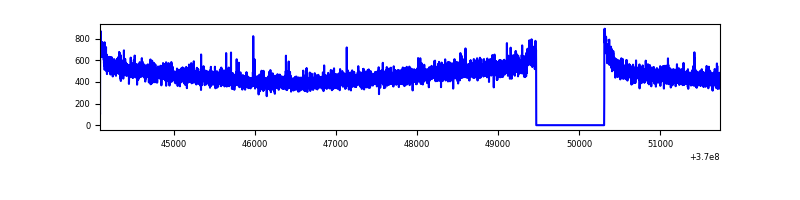 |
| B | 7649 | 6810 | 132 | 132 | 1.73% | 1.94% | 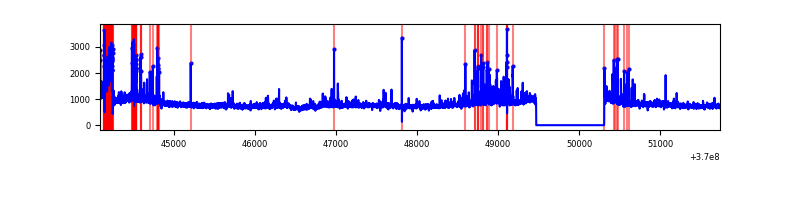 |
| C | 7649 | 6810 | 377 | 377 | 4.93% | 5.54% | 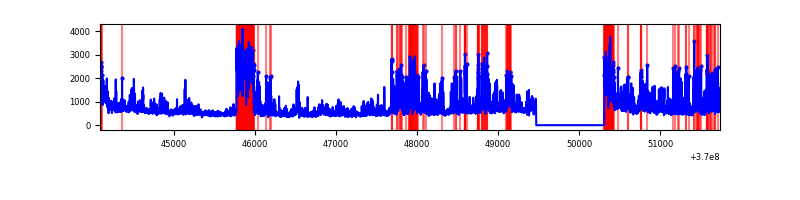 |
| D | 7649 | 6810 | 465 | 465 | 6.08% | 6.83% |  |
Top three noisy pixels from each quadrant. If the there are fewer than three noisy pixels in the level2.evt file, extra rows are filled as -1
| Pixel properties | Quadrant properties | ||||||
|---|---|---|---|---|---|---|---|
| Quadrant | DetID | PixID | Counts | Sigma | Mean | Median | Sigma |
| A | 13 | 6 | 15452 | 90.29 | 813 | 798 | 162.3 |
| A | 13 | 254 | 13782 | 80.0 | 813 | 798 | 162.3 |
| A | 3 | 137 | 8018 | 44.48 | 813 | 798 | 162.3 |
| B | 6 | 159 | 1993835 | 13161.64 | 802 | 781 | 151.4 |
| B | 5 | 172 | 225577 | 1484.5 | 802 | 781 | 151.4 |
| B | 0 | 155 | 178103 | 1170.99 | 802 | 781 | 151.4 |
| C | 3 | 233 | 1841953 | 10417.64 | 766 | 771 | 176.7 |
| C | 0 | 10 | 635333 | 3590.43 | 766 | 771 | 176.7 |
| C | 14 | 238 | 136768 | 769.49 | 766 | 771 | 176.7 |
| D | 8 | 195 | 1780801 | 9847.27 | 765 | 744 | 180.8 |
| D | 12 | 1 | 549283 | 3034.52 | 765 | 744 | 180.8 |
| D | 12 | 3 | 361504 | 1995.72 | 765 | 744 | 180.8 |
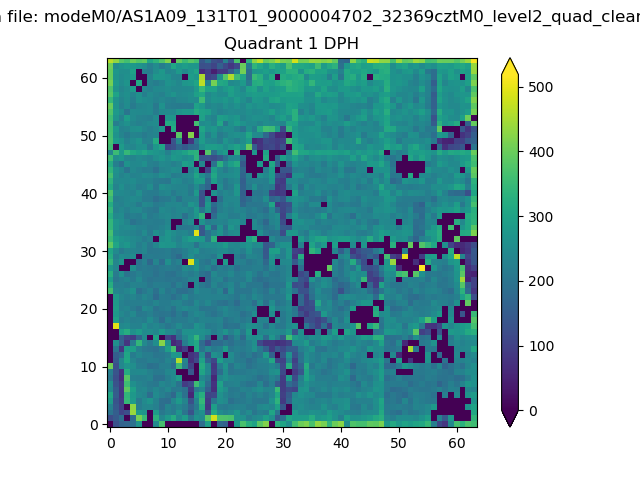
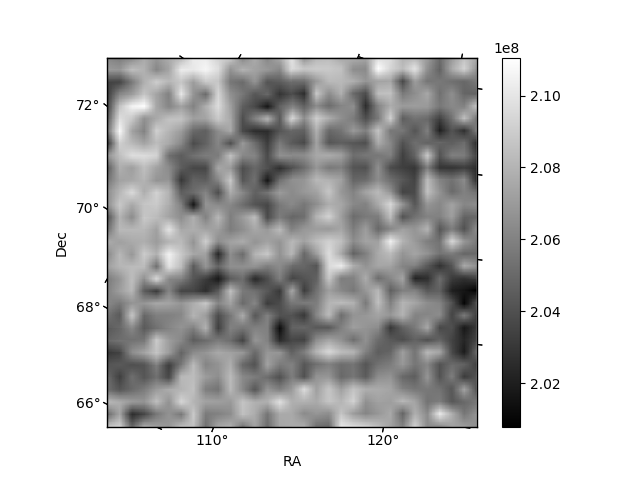
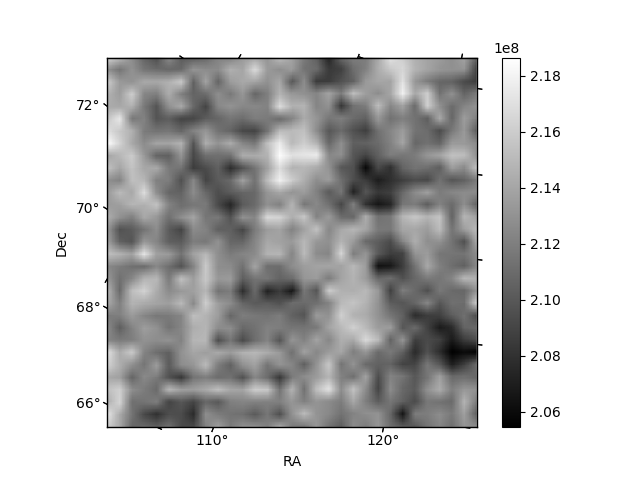
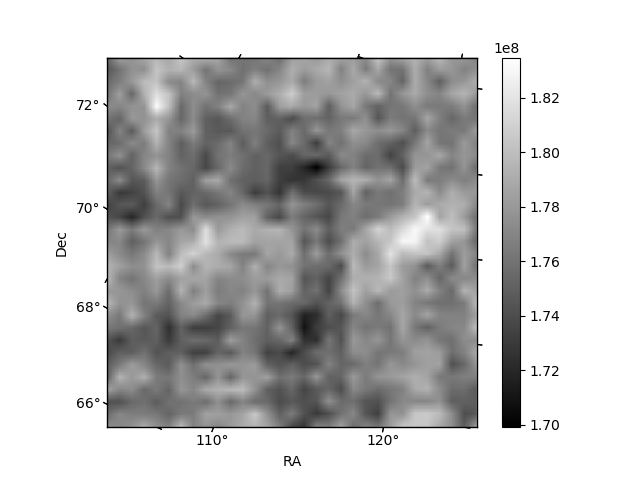
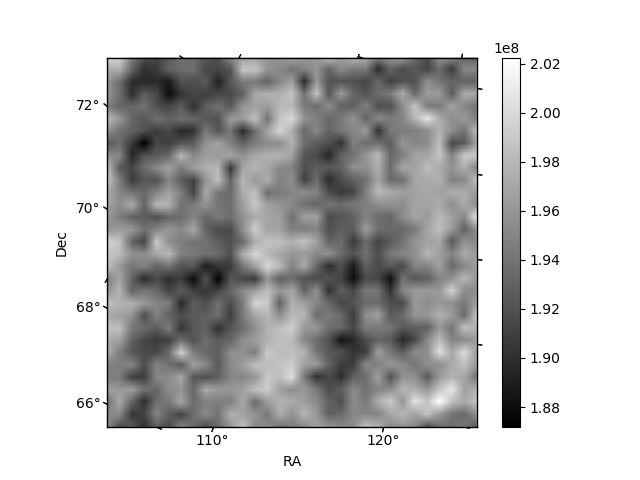
Histogram calculated using DETX and DETY for each event in the final _common_clean file
| Quadrant A | 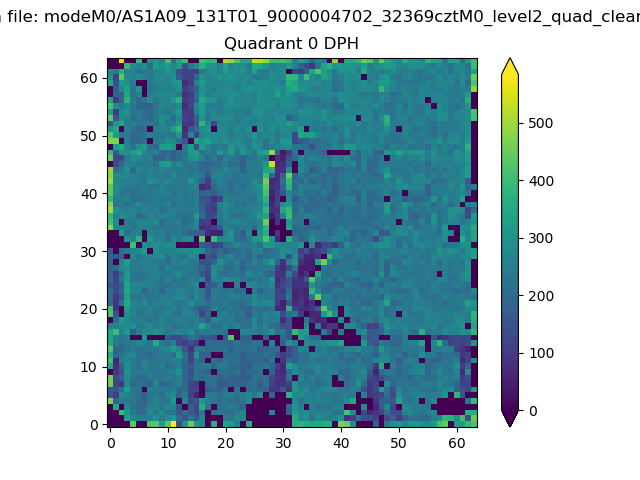 |
 |
Quadrant B |
|---|---|---|---|
| Quadrant D | 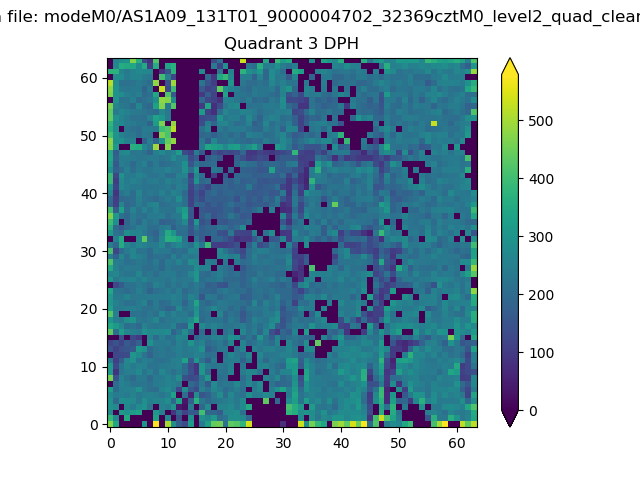 |
 |
Quadrant C |
| Plot type | Count rate plots | Images |
|---|---|---|
| Comparison with Poisson distribution Blue bars denote a histogram of data divided into 1 sec bins. Red curve is a Poisson curve with rate = median count rate of data. |
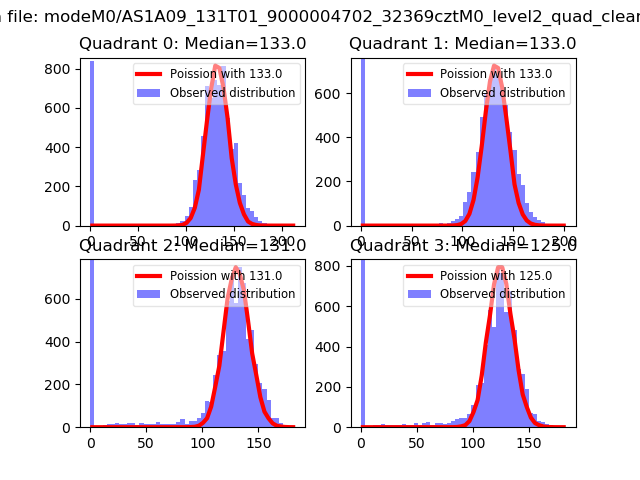 |
 |
| Quadrant-wise count rates Data is divided into 100 sec bins |
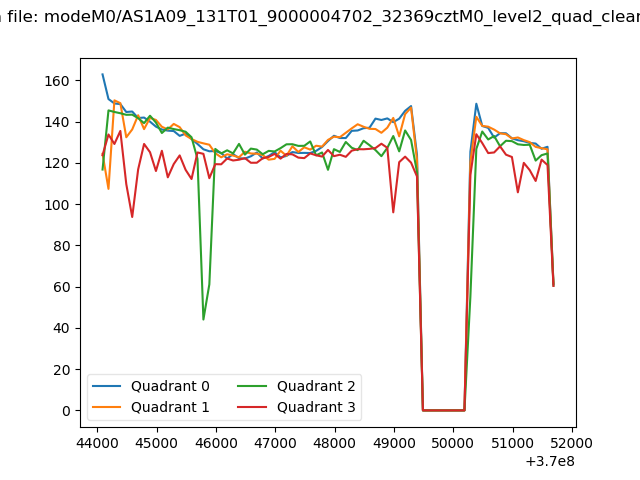 |
|
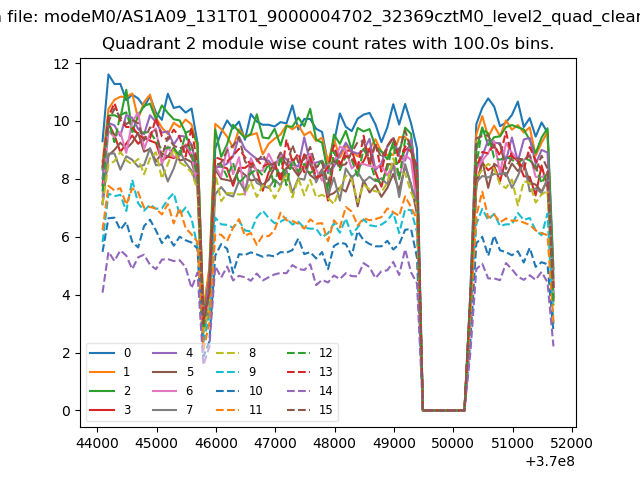
| Module-wise count rates for Quadrant A Data is divided into 100 sec bins |
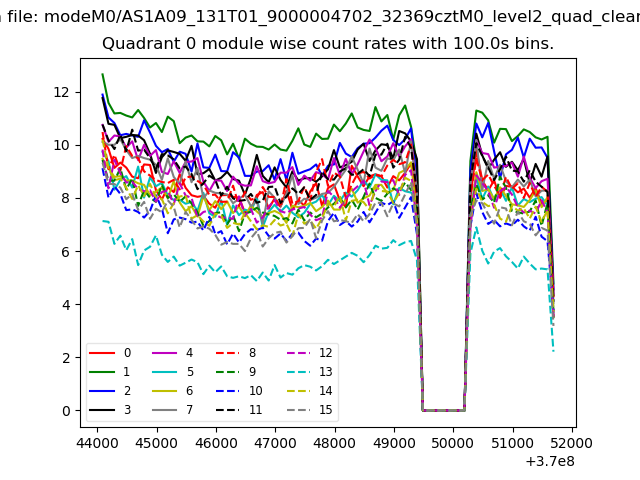 |
 |
| Module-wise count rates for Quadrant B Data is divided into 100 sec bins |
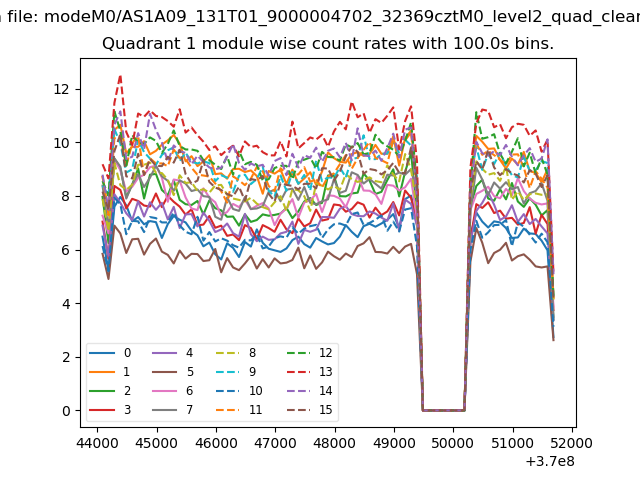 |
 |
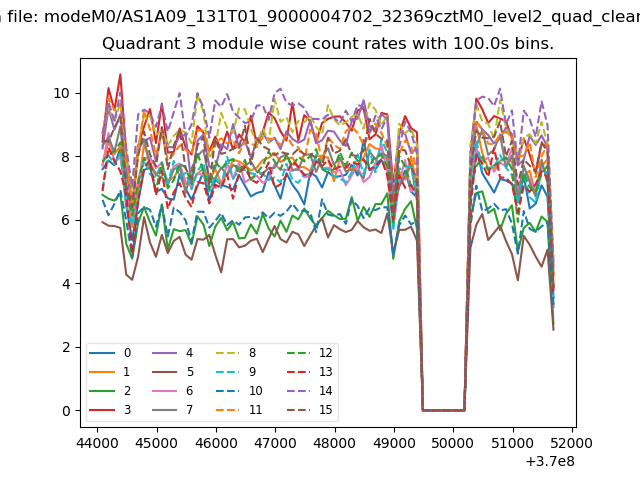
| Module-wise count rates for Quadrant C Data is divided into 100 sec bins |
 |
 |
| Module-wise count rates for Quadrant D Data is divided into 100 sec bins |
 |
 |
| Parameter | Plot |
|---|---|
| CZT HV Monitor | 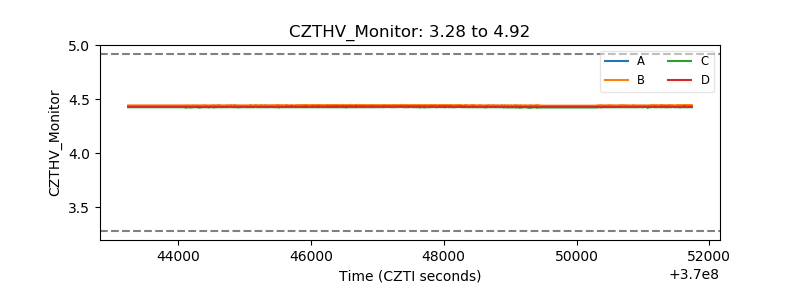 |
| D_VDD | 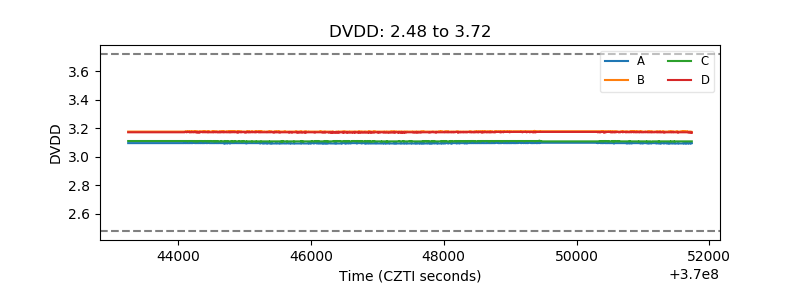 |
| Temperature 1 | 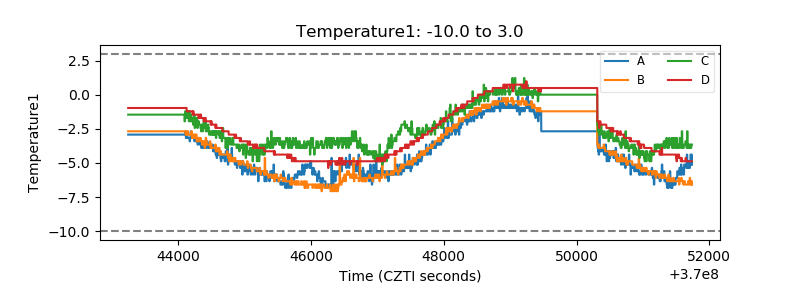 |
| Veto HV Monitor |  |
| Veto LLD |  |
| Alpha Counter |  |
| _CPM_Rate | 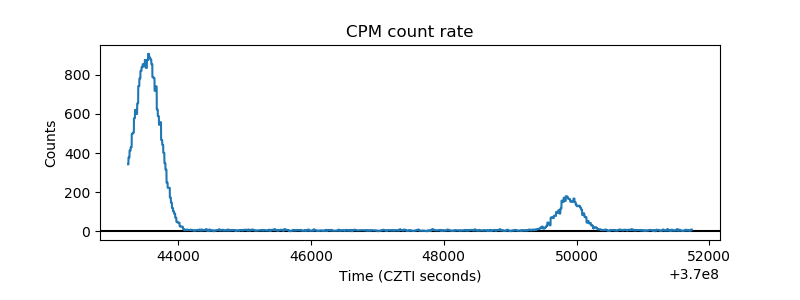 |
| CZT Counter | 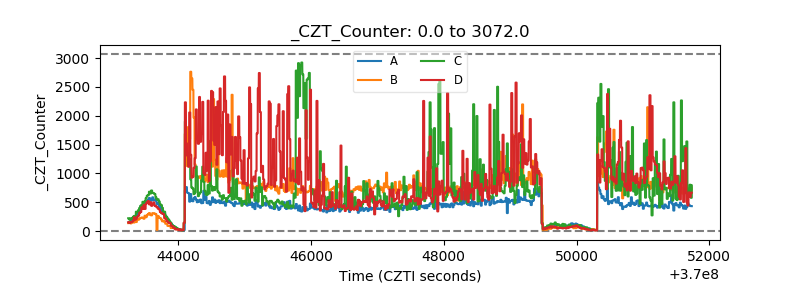 |
| +2.5 Volts monitor | 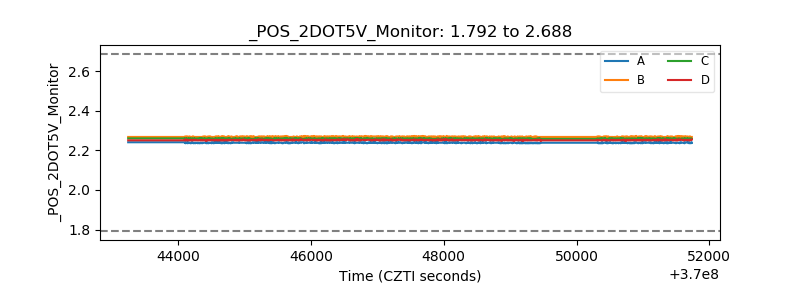 |
| +5 Volts monitor |  |
| _ROLL_ROT | 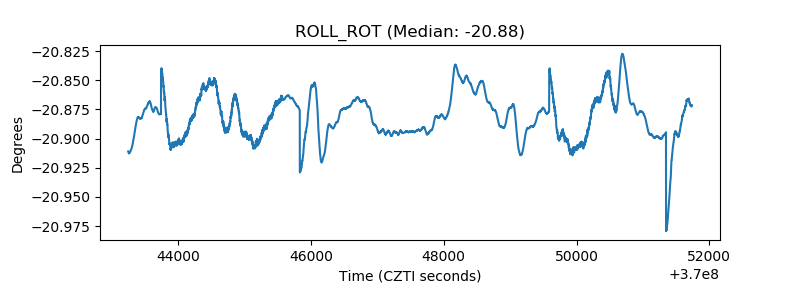 |
| _Roll_DEC | 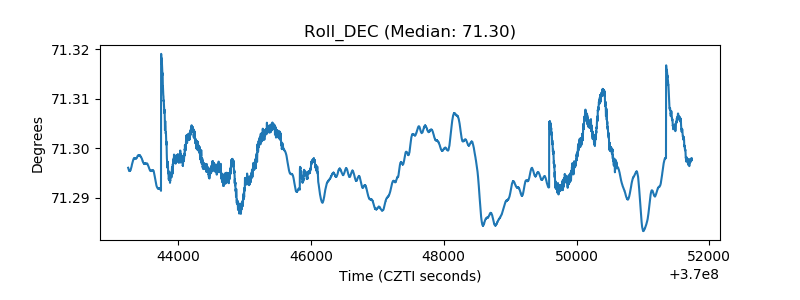 |
| _Roll_RA | 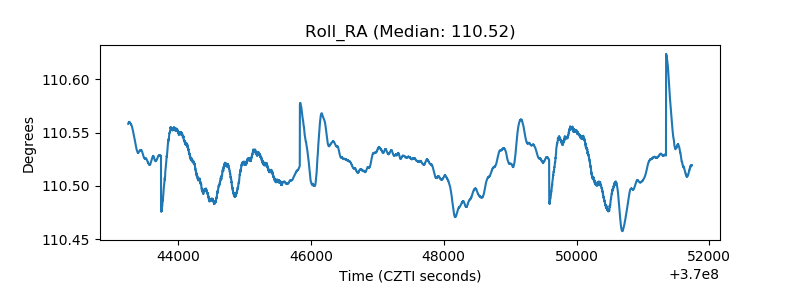 |
| Veto Counter | 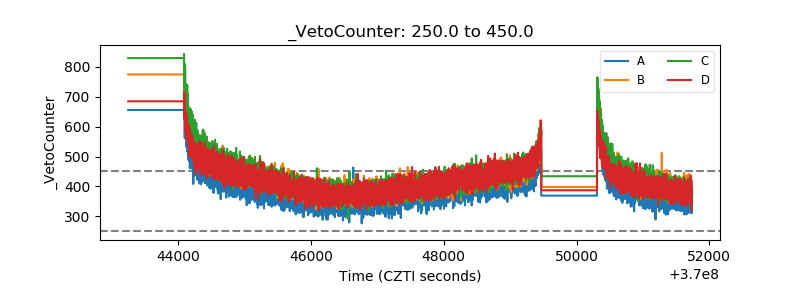 |