| Param | Original file | Final file |
|---|---|---|
| Filename | modeM0/AS1A09_131T01_9000004702_32370cztM0_level2.evt | modeM0/AS1A09_131T01_9000004702_32370cztM0_level2_quad_clean.evt |
| Size (bytes) | 889,634,880 | 135,823,680 |
| Size | 848.4 MB | 129.5 MB |
| Events in quadrant A | 5,254,722 | 943,432 |
| Events in quadrant B | 6,111,956 | 960,572 |
| Events in quadrant C | 9,366,282 | 775,212 |
| Events in quadrant D | 5,703,734 | 910,480 |
| Mode M0 | |||
|---|---|---|---|
| Quadrant | BADHDUFLAG | Total packets | Discarded packets |
| A | 0 | 20783 | 3 |
| B | 0 | 24042 | 2 |
| C | 0 | 32915 | 2 |
| D | 0 | 22239 | 2 |
| Mode SS | |||
|---|---|---|---|
| Quadrant | BADHDUFLAG | Total packets | Discarded packets |
| A | 0 | 154 | 0 |
| B | 0 | 154 | 0 |
| C | 0 | 154 | 0 |
| D | 0 | 154 | 0 |
| Mode M9 | |||
|---|---|---|---|
| Quadrant | BADHDUFLAG | Total packets | Discarded packets |
| A | 0 | 11 | 0 |
| B | 0 | 11 | 0 |
| C | 0 | 11 | 0 |
| D | 0 | 11 | 0 |
| Quadrant | Total seconds | Saturated seconds | Saturation percentage |
|---|---|---|---|
| A | 7508 | 442 | 5.887054% |
| B | 7508 | 245 | 3.263186% |
| C | 7508 | 2225 | 29.635056% |
| D | 7508 | 313 | 4.168887% |
Noise dominated data is calculated using 1-second bins in cleaned event files. If a bin has >2000 counts, and if more than 50% of those come from <1% of pixels, then it is considered to be noise-dominated and hence unusable.
| Quadrant | # 1 sec bins | Bins with >0 counts | Bins with >2000 counts | High rate bins dominated by noise | Noise dominated (total time) | Noise dominated (detector-on time) | Marked lightcurve |
|---|---|---|---|---|---|---|---|
| A | 7978 | 7509 | 205 | 205 | 2.57% | 2.73% | 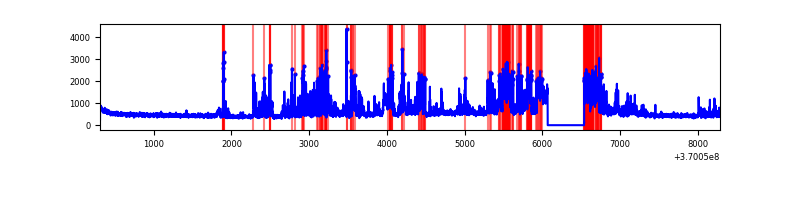 |
| B | 7978 | 7509 | 67 | 67 | 0.84% | 0.89% | 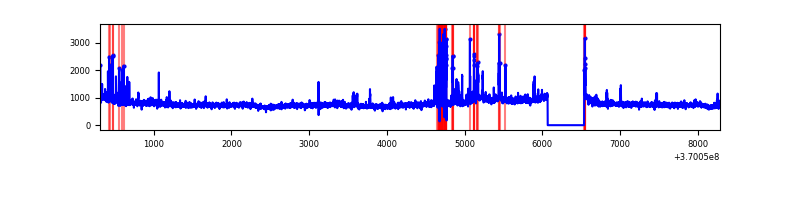 |
| C | 7978 | 7509 | 1590 | 1590 | 19.93% | 21.17% | 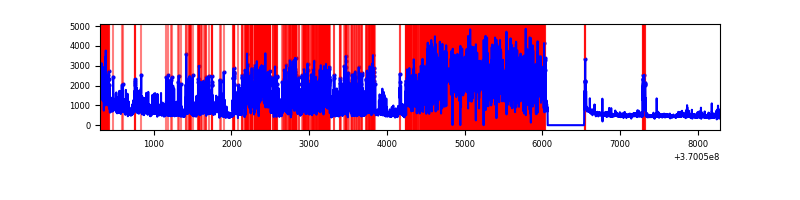 |
| D | 7978 | 7509 | 220 | 220 | 2.76% | 2.93% | 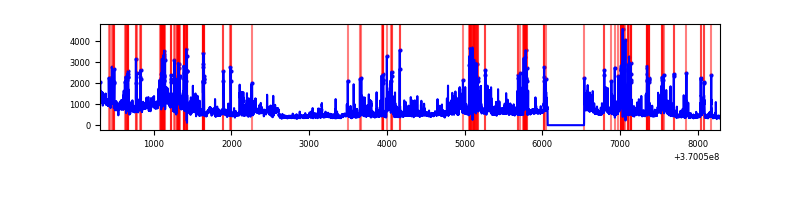 |
Top three noisy pixels from each quadrant. If the there are fewer than three noisy pixels in the level2.evt file, extra rows are filled as -1
| Pixel properties | Quadrant properties | ||||||
|---|---|---|---|---|---|---|---|
| Quadrant | DetID | PixID | Counts | Sigma | Mean | Median | Sigma |
| A | 12 | 96 | 1865114 | 10740.24 | 867 | 848 | 173.6 |
| A | 13 | 6 | 24426 | 135.84 | 867 | 848 | 173.6 |
| A | 0 | 6 | 19351 | 106.6 | 867 | 848 | 173.6 |
| B | 6 | 159 | 2183449 | 13216.83 | 874 | 851 | 165.1 |
| B | 5 | 172 | 252747 | 1525.37 | 874 | 851 | 165.1 |
| B | 10 | 245 | 58686 | 350.22 | 874 | 851 | 165.1 |
| C | 3 | 233 | 6187966 | 37243.53 | 708 | 713 | 166.1 |
| C | 0 | 10 | 151780 | 909.33 | 708 | 713 | 166.1 |
| C | 14 | 238 | 122939 | 735.73 | 708 | 713 | 166.1 |
| D | 8 | 195 | 950511 | 4711.76 | 845 | 821 | 201.6 |
| D | 12 | 1 | 444173 | 2199.63 | 845 | 821 | 201.6 |
| D | 12 | 233 | 317340 | 1570.37 | 845 | 821 | 201.6 |
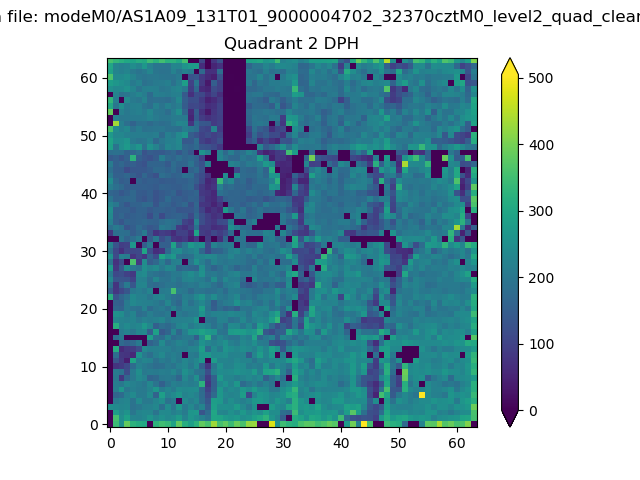
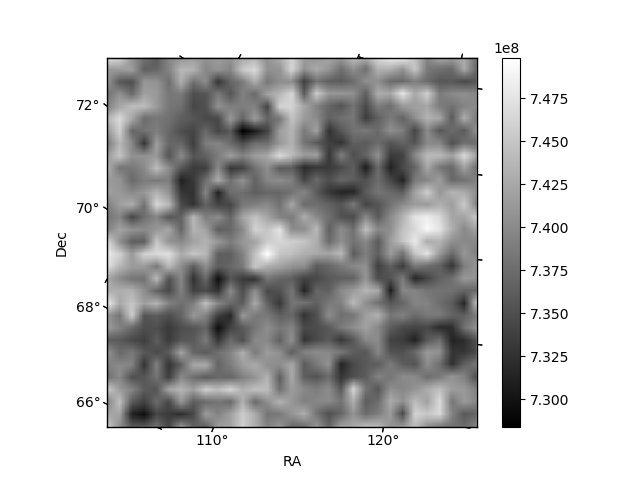
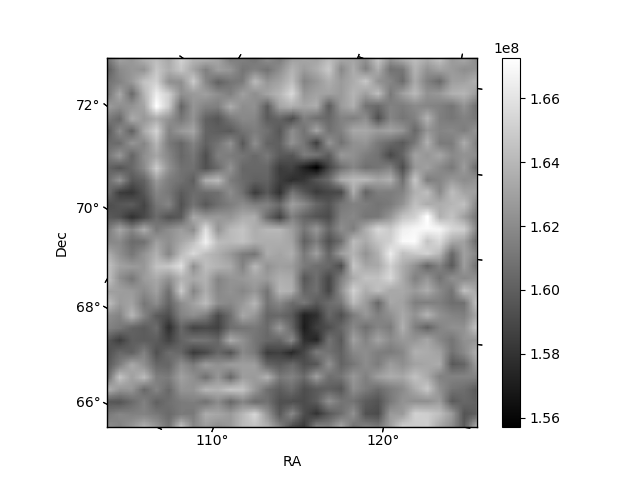
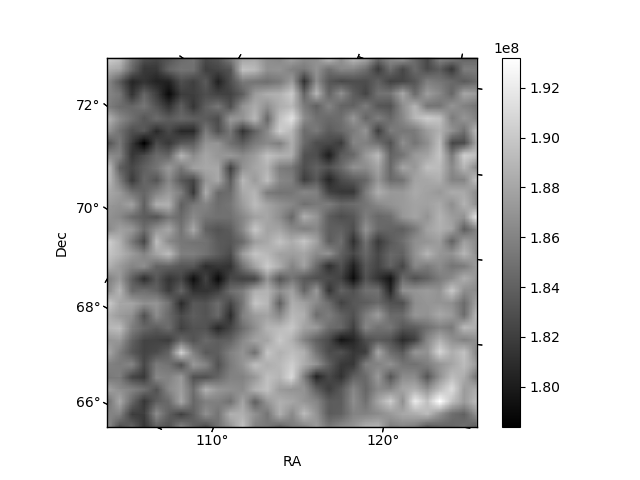
Histogram calculated using DETX and DETY for each event in the final _common_clean file
| Quadrant A | 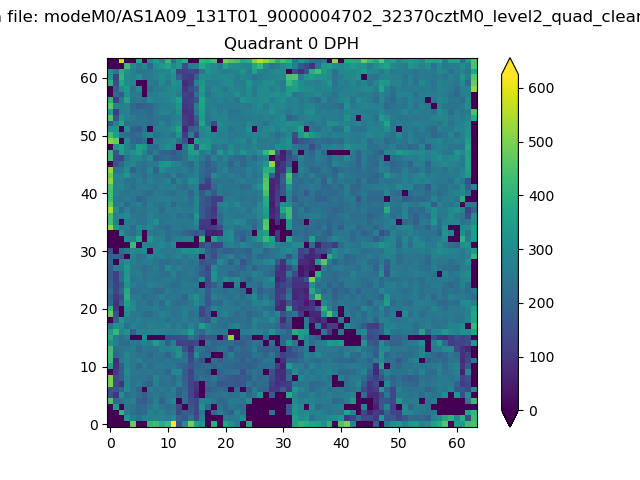 |
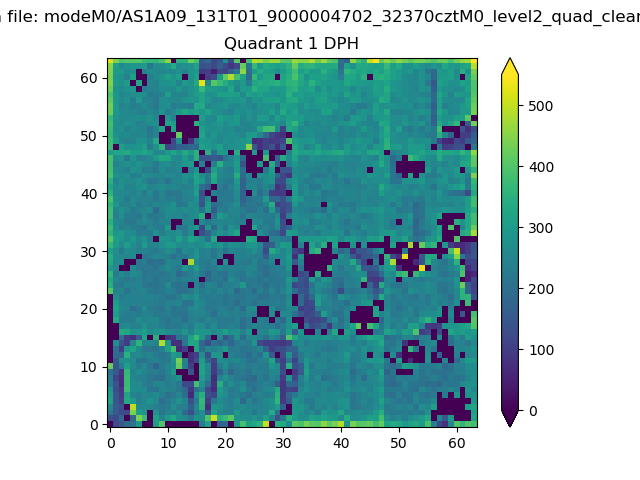 |
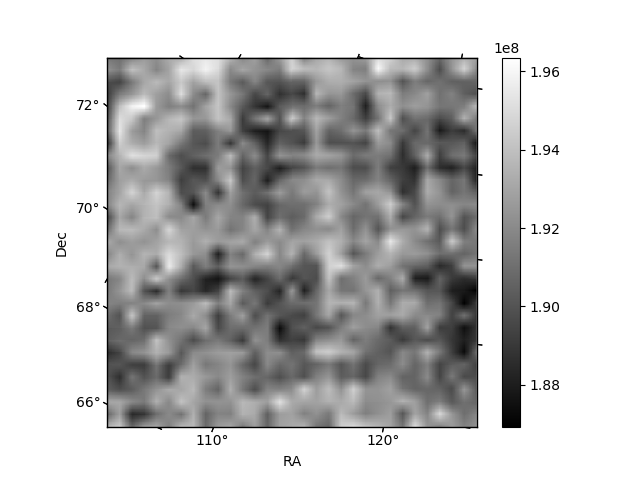
Quadrant B |
|---|---|---|---|
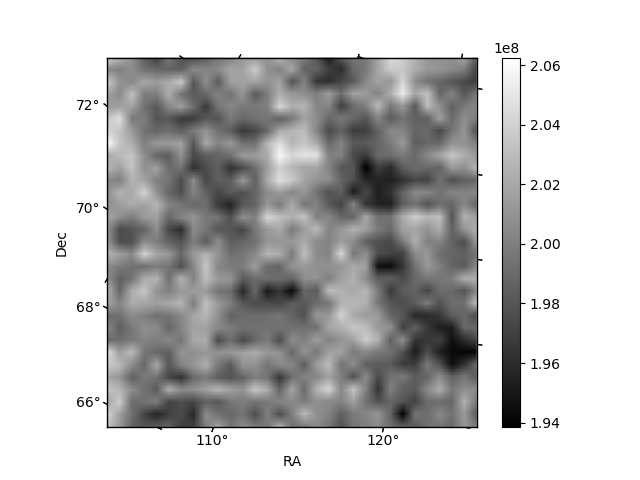
| Quadrant D | 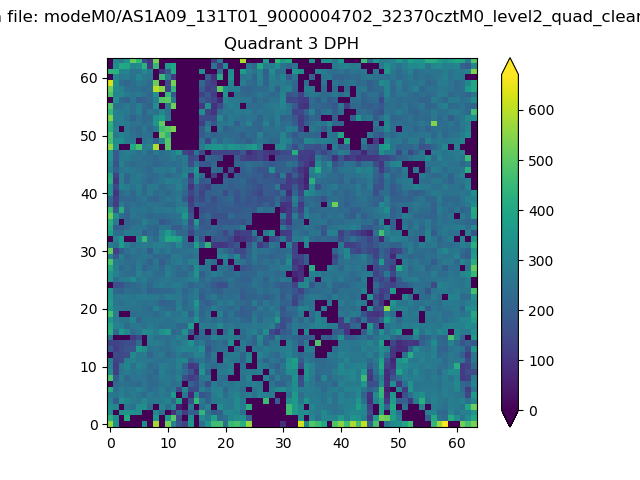 |
 |
Quadrant C |
| Plot type | Count rate plots | Images |
|---|---|---|
| Comparison with Poisson distribution Blue bars denote a histogram of data divided into 1 sec bins. Red curve is a Poisson curve with rate = median count rate of data. |
 |
 |
| Quadrant-wise count rates Data is divided into 100 sec bins |
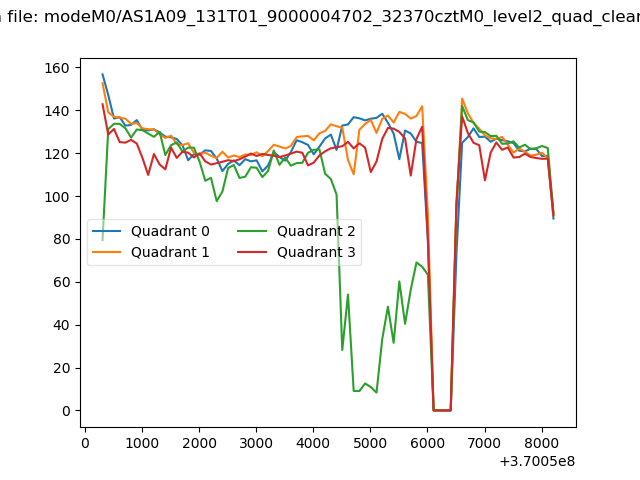 |
|
| Module-wise count rates for Quadrant A Data is divided into 100 sec bins |
 |
 |
| Module-wise count rates for Quadrant B Data is divided into 100 sec bins |
 |
 |
| Module-wise count rates for Quadrant C Data is divided into 100 sec bins |
 |
 |
| Module-wise count rates for Quadrant D Data is divided into 100 sec bins |
 |
 |
| Parameter | Plot |
|---|---|
| CZT HV Monitor | 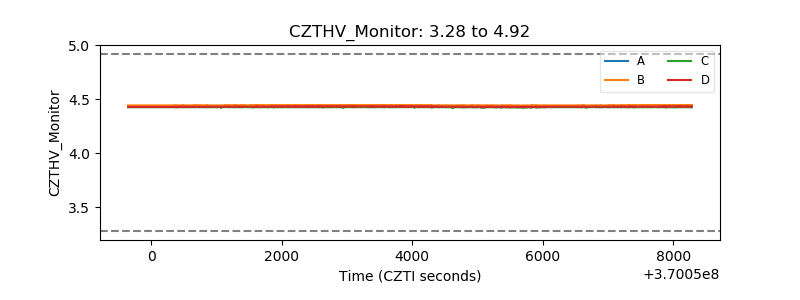 |
| D_VDD | 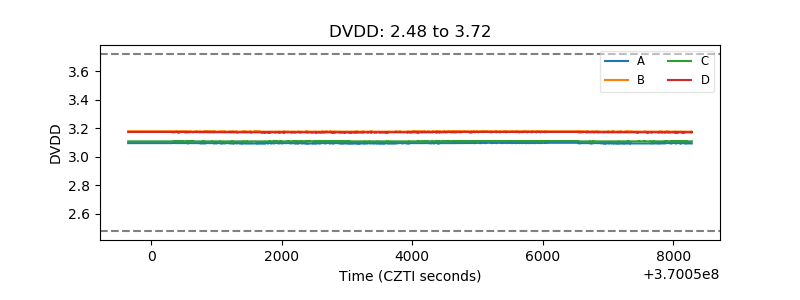 |
| Temperature 1 | 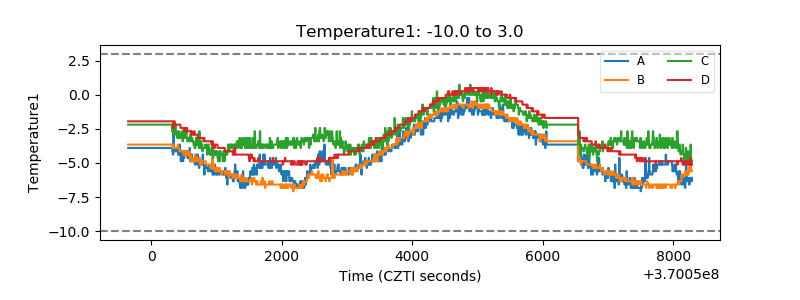 |
| Veto HV Monitor | 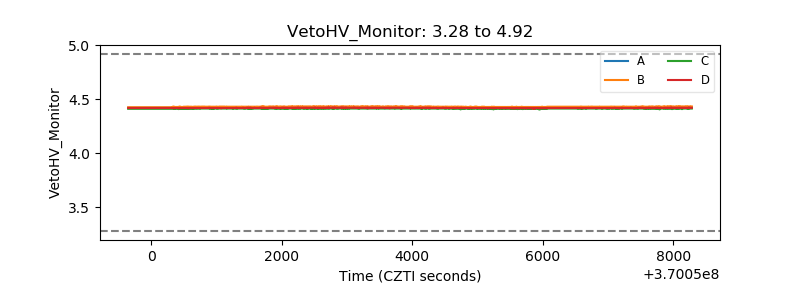 |
| Veto LLD | 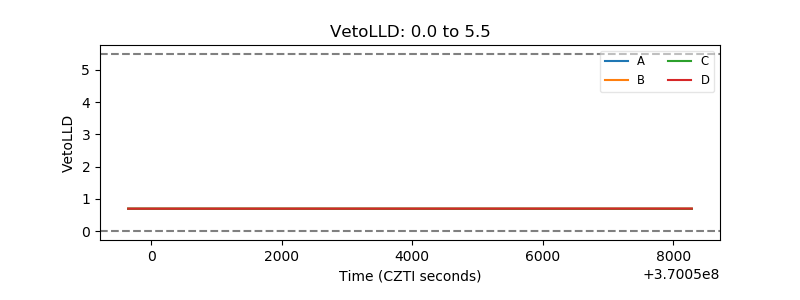 |
| Alpha Counter | 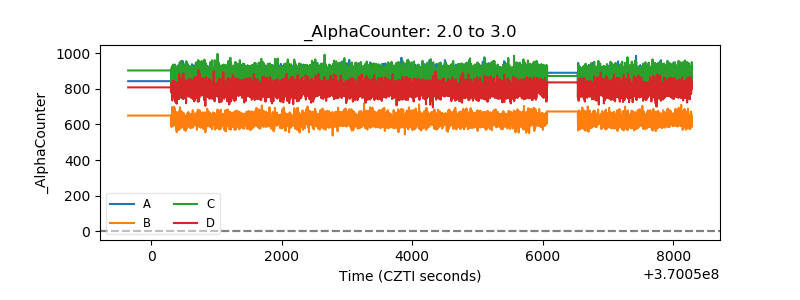 |
| _CPM_Rate | 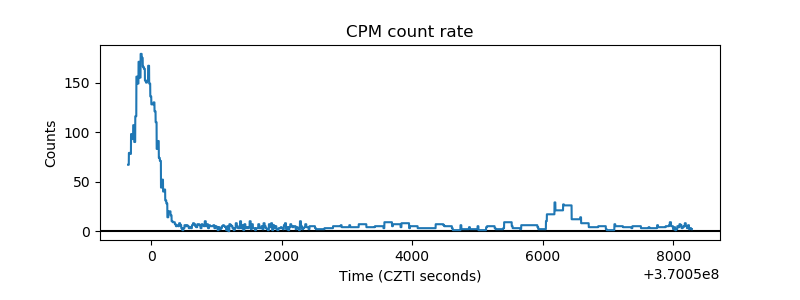 |
| CZT Counter | 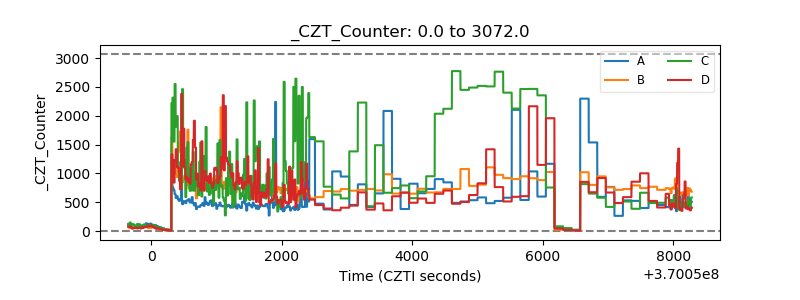 |
| +2.5 Volts monitor |  |
| +5 Volts monitor |  |
| _ROLL_ROT | 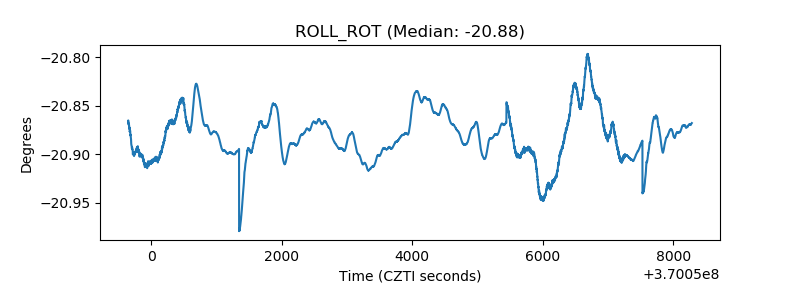 |
| _Roll_DEC | 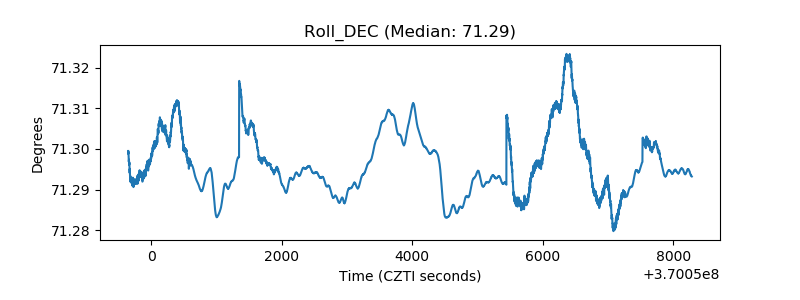 |
| _Roll_RA | 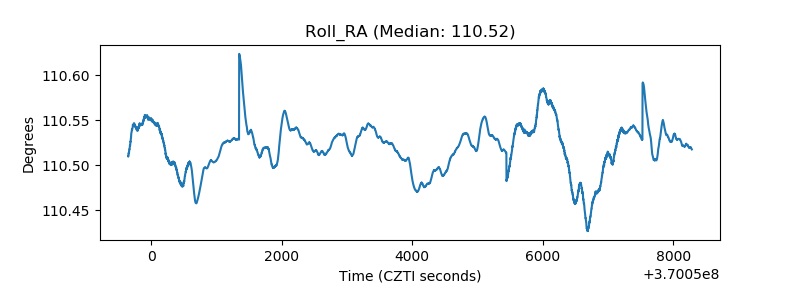 |
| Veto Counter |  |