| Param | Original file | Final file |
|---|---|---|
| Filename | modeM0/AS1A09_131T01_9000004702_32371cztM0_level2.evt | modeM0/AS1A09_131T01_9000004702_32371cztM0_level2_quad_clean.evt |
| Size (bytes) | 673,084,800 | 134,628,480 |
| Size | 641.9 MB | 128.4 MB |
| Events in quadrant A | 3,966,484 | 916,698 |
| Events in quadrant B | 6,019,965 | 903,135 |
| Events in quadrant C | 5,282,168 | 876,718 |
| Events in quadrant D | 4,623,682 | 874,040 |
| Mode M0 | |||
|---|---|---|---|
| Quadrant | BADHDUFLAG | Total packets | Discarded packets |
| A | 0 | 16590 | 4 |
| B | 0 | 23687 | 3 |
| C | 0 | 20711 | 3 |
| D | 0 | 18868 | 3 |
| Mode SS | |||
|---|---|---|---|
| Quadrant | BADHDUFLAG | Total packets | Discarded packets |
| A | 0 | 148 | 0 |
| B | 0 | 148 | 0 |
| C | 0 | 148 | 0 |
| D | 0 | 148 | 0 |
| Quadrant | Total seconds | Saturated seconds | Saturation percentage |
|---|---|---|---|
| A | 7266 | 111 | 1.527663% |
| B | 7266 | 415 | 5.711533% |
| C | 7266 | 707 | 9.730250% |
| D | 7266 | 324 | 4.459125% |
Noise dominated data is calculated using 1-second bins in cleaned event files. If a bin has >2000 counts, and if more than 50% of those come from <1% of pixels, then it is considered to be noise-dominated and hence unusable.
| Quadrant | # 1 sec bins | Bins with >0 counts | Bins with >2000 counts | High rate bins dominated by noise | Noise dominated (total time) | Noise dominated (detector-on time) | Marked lightcurve |
|---|---|---|---|---|---|---|---|
| A | 7406 | 7270 | 29 | 29 | 0.39% | 0.40% | 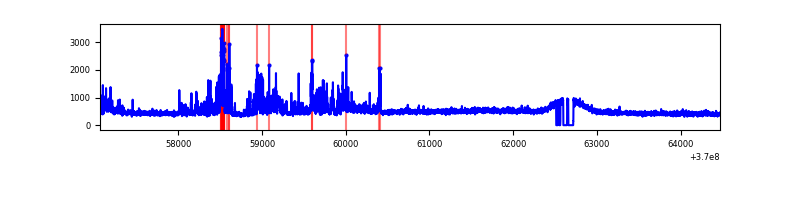 |
| B | 7406 | 7270 | 125 | 125 | 1.69% | 1.72% | 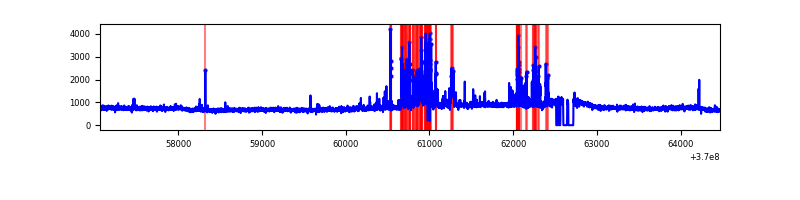 |
| C | 7406 | 7270 | 232 | 232 | 3.13% | 3.19% | 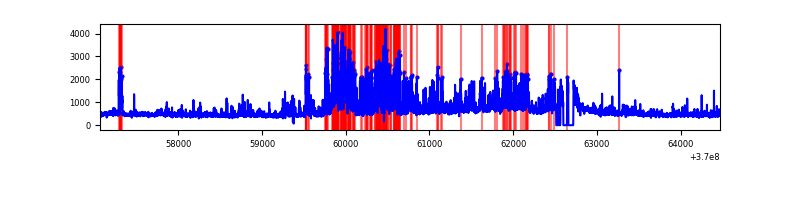 |
| D | 7406 | 7270 | 211 | 211 | 2.85% | 2.90% | 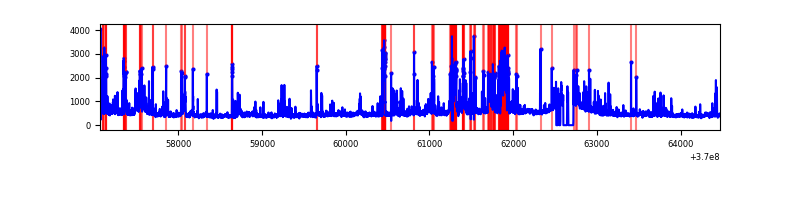 |
Top three noisy pixels from each quadrant. If the there are fewer than three noisy pixels in the level2.evt file, extra rows are filled as -1
| Pixel properties | Quadrant properties | ||||||
|---|---|---|---|---|---|---|---|
| Quadrant | DetID | PixID | Counts | Sigma | Mean | Median | Sigma |
| A | 12 | 96 | 640466 | 3704.82 | 855 | 837 | 172.6 |
| A | 13 | 6 | 22612 | 126.12 | 855 | 837 | 172.6 |
| A | 13 | 254 | 14134 | 77.02 | 855 | 837 | 172.6 |
| B | 6 | 159 | 2065032 | 12919.88 | 840 | 818 | 159.8 |
| B | 5 | 172 | 490587 | 3065.46 | 840 | 818 | 159.8 |
| B | 4 | 80 | 58622 | 361.79 | 840 | 818 | 159.8 |
| C | 3 | 233 | 1624261 | 8603.02 | 805 | 811 | 188.7 |
| C | 14 | 238 | 172252 | 908.5 | 805 | 811 | 188.7 |
| C | 0 | 10 | 163072 | 859.86 | 805 | 811 | 188.7 |
| D | 12 | 233 | 314261 | 1609.33 | 818 | 795 | 194.8 |
| D | 8 | 195 | 262892 | 1345.6 | 818 | 795 | 194.8 |
| D | 12 | 3 | 183406 | 937.52 | 818 | 795 | 194.8 |
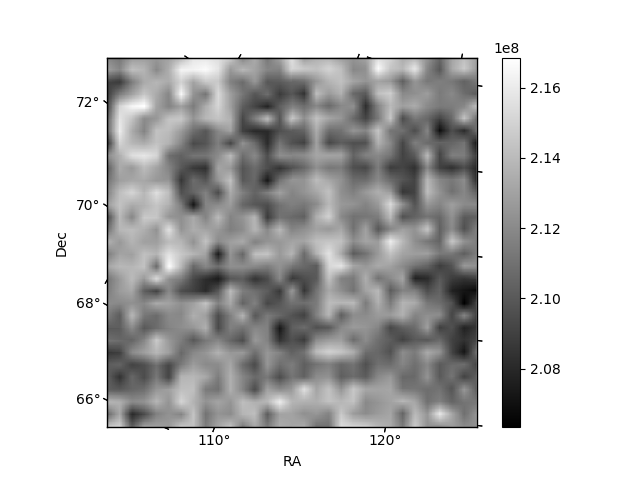
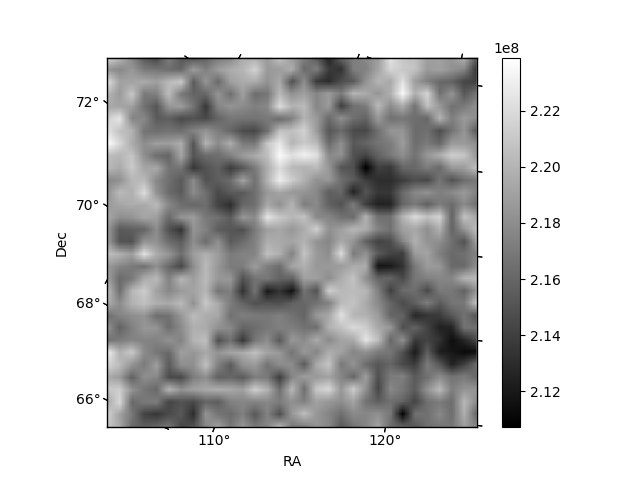
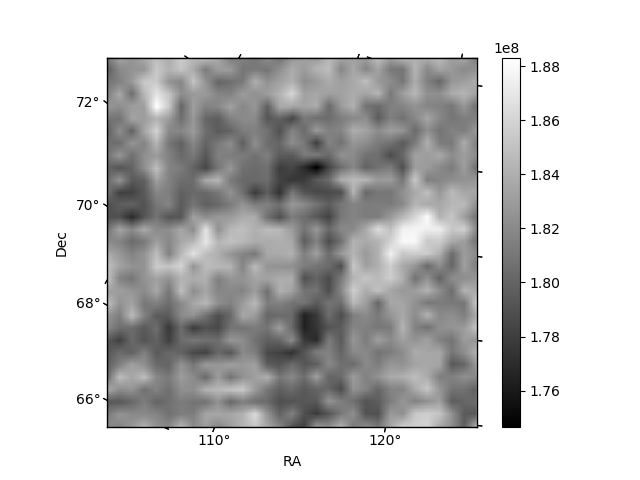
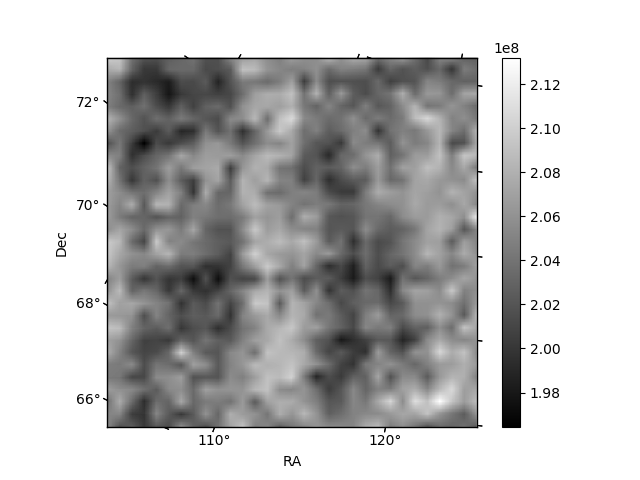
Histogram calculated using DETX and DETY for each event in the final _common_clean file
| Quadrant A | 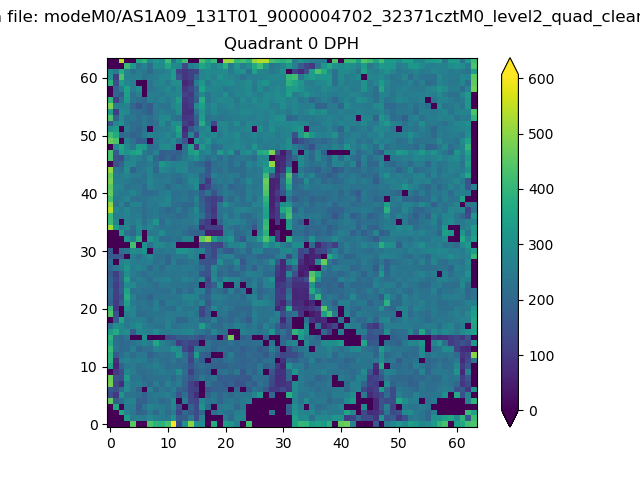 |
 |
Quadrant B |
|---|---|---|---|
| Quadrant D |  |
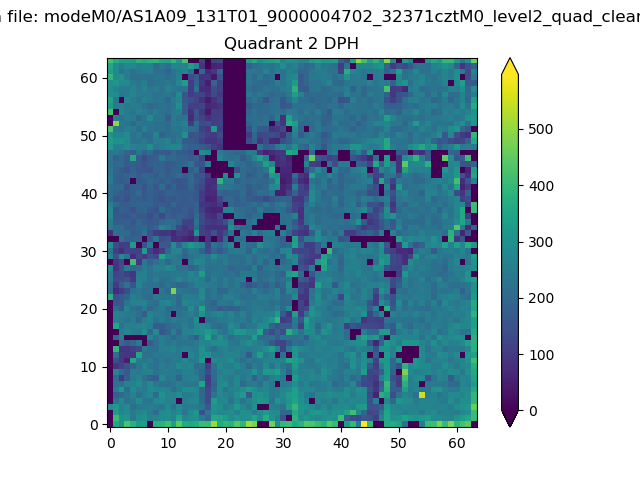 |
Quadrant C |
| Plot type | Count rate plots | Images |
|---|---|---|
| Comparison with Poisson distribution Blue bars denote a histogram of data divided into 1 sec bins. Red curve is a Poisson curve with rate = median count rate of data. |
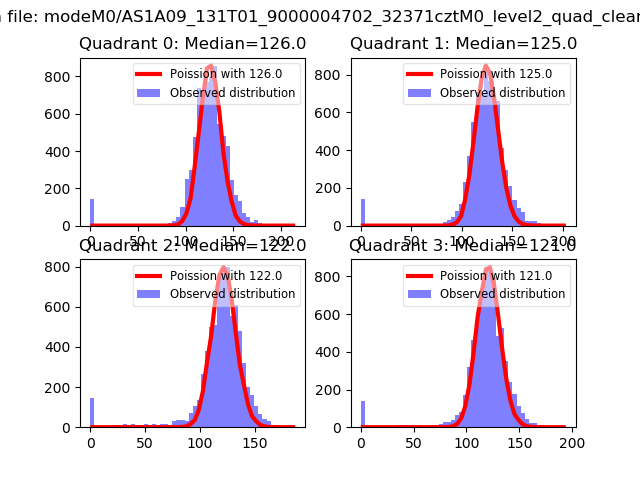 |
 |
| Quadrant-wise count rates Data is divided into 100 sec bins |
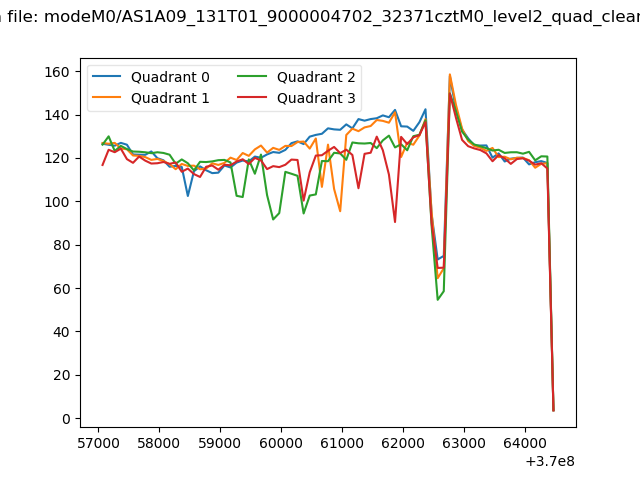 |
|
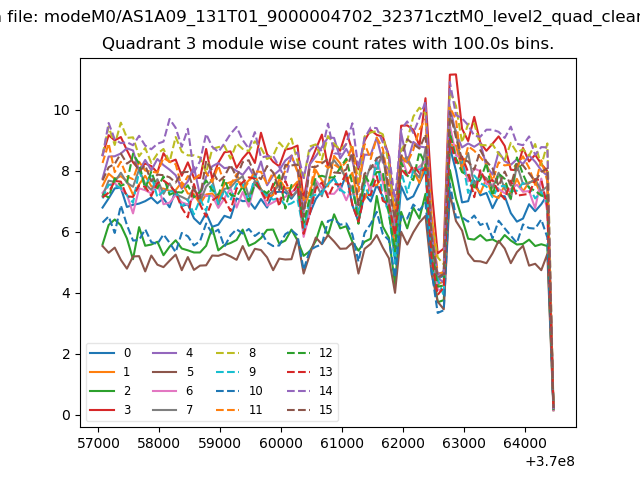
| Module-wise count rates for Quadrant A Data is divided into 100 sec bins |
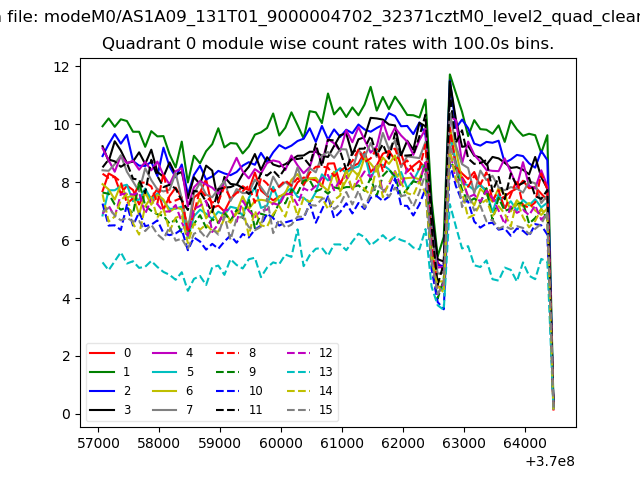 |
 |
| Module-wise count rates for Quadrant B Data is divided into 100 sec bins |
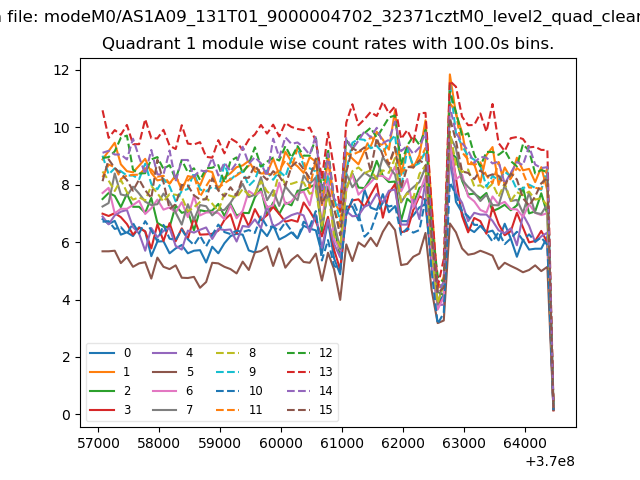 |
 |
| Module-wise count rates for Quadrant C Data is divided into 100 sec bins |
 |
 |
| Module-wise count rates for Quadrant D Data is divided into 100 sec bins |
 |
 |
| Parameter | Plot |
|---|---|
| CZT HV Monitor | 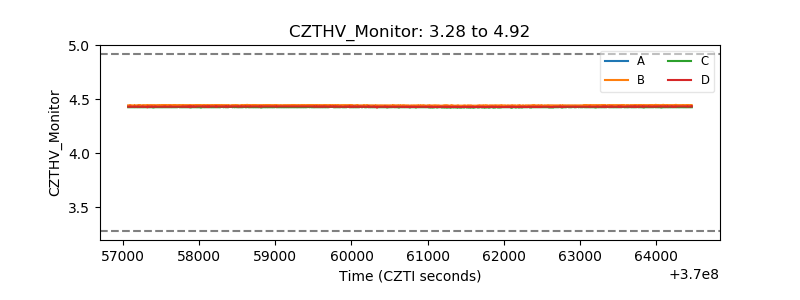 |
| D_VDD | 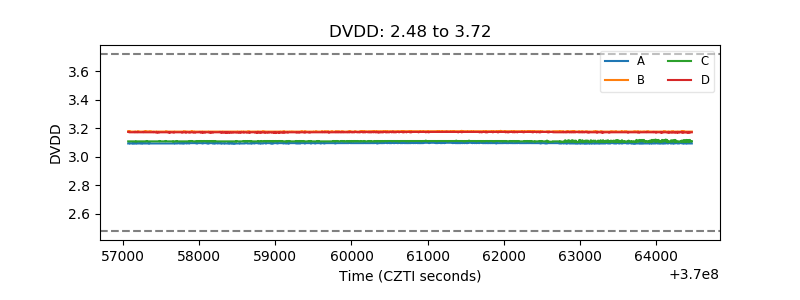 |
| Temperature 1 | 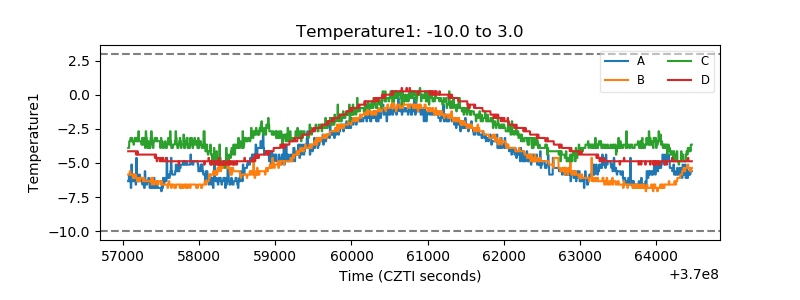 |
| Veto HV Monitor | 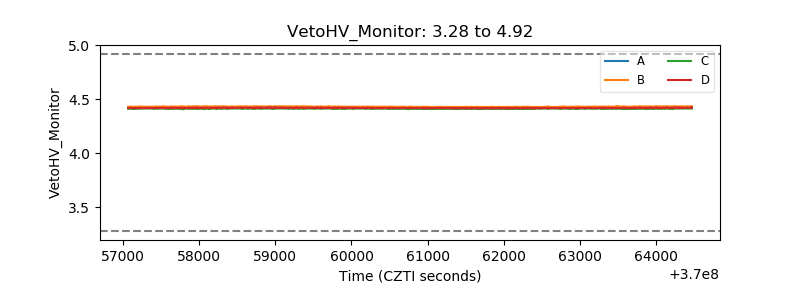 |
| Veto LLD | 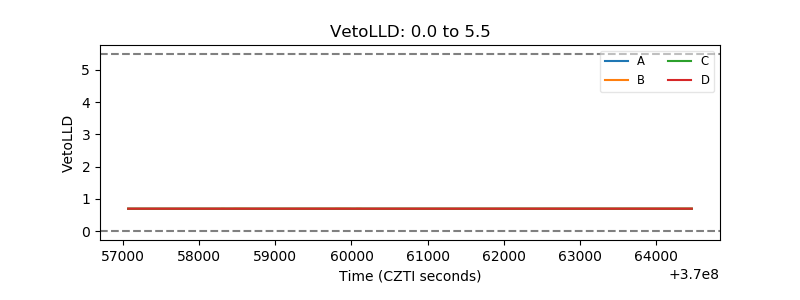 |
| Alpha Counter | 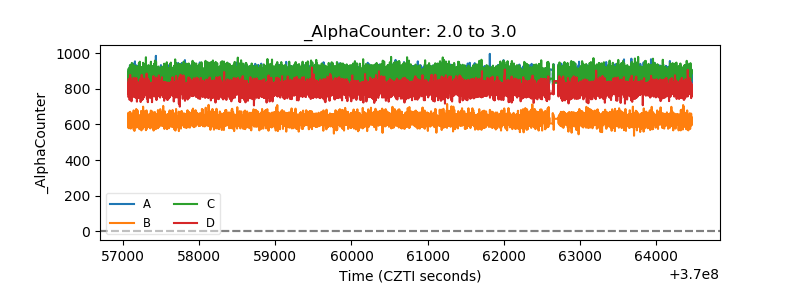 |
| _CPM_Rate | 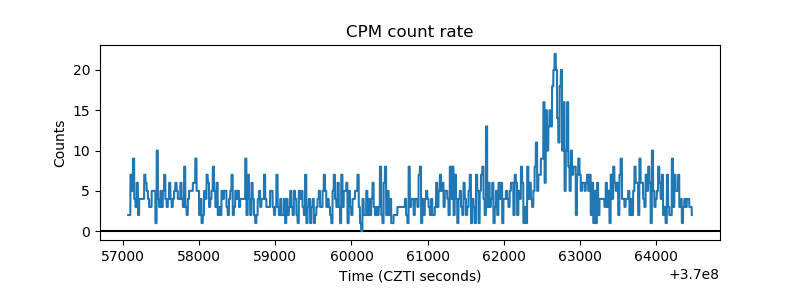 |
| CZT Counter | 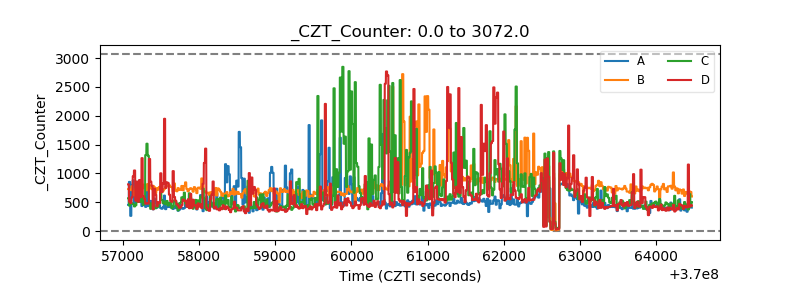 |
| +2.5 Volts monitor | 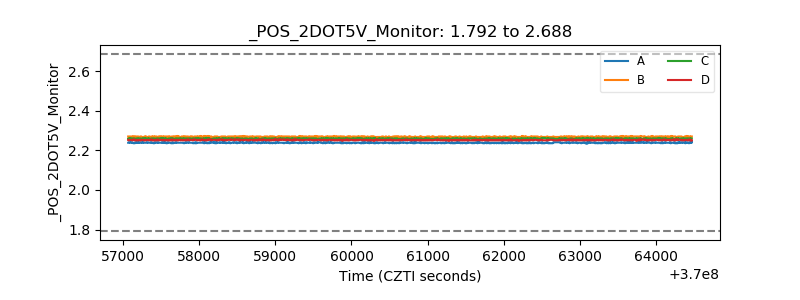 |
| +5 Volts monitor | 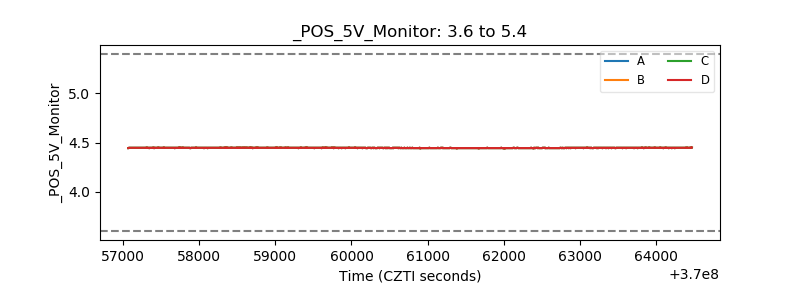 |
| _ROLL_ROT | 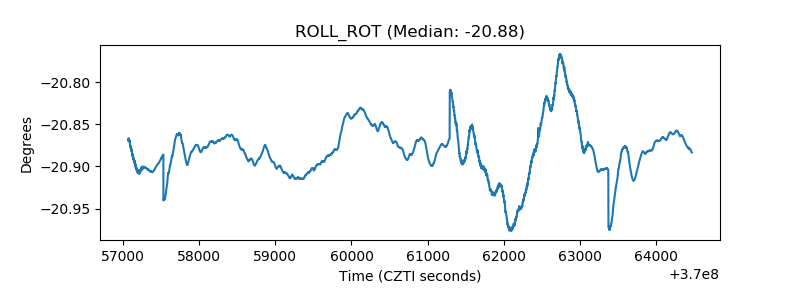 |
| _Roll_DEC | 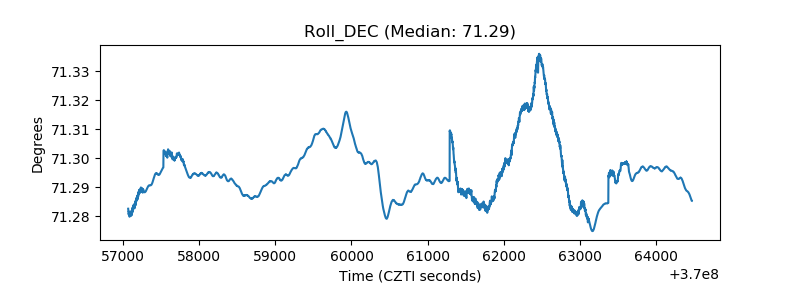 |
| _Roll_RA | 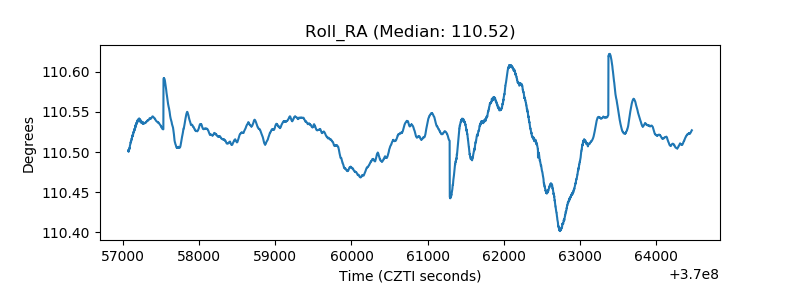 |
| Veto Counter |  |