| Param | Original file | Final file |
|---|---|---|
| Filename | modeM0/AS1A09_131T01_9000004702_32372cztM0_level2.evt | modeM0/AS1A09_131T01_9000004702_32372cztM0_level2_quad_clean.evt |
| Size (bytes) | 654,122,880 | 127,068,480 |
| Size | 623.8 MB | 121.2 MB |
| Events in quadrant A | 3,196,666 | 873,654 |
| Events in quadrant B | 6,047,207 | 847,127 |
| Events in quadrant C | 6,073,930 | 807,710 |
| Events in quadrant D | 4,020,372 | 833,556 |
| Mode M0 | |||
|---|---|---|---|
| Quadrant | BADHDUFLAG | Total packets | Discarded packets |
| A | 0 | 14324 | 2 |
| B | 0 | 23330 | 1 |
| C | 0 | 22807 | 1 |
| D | 0 | 16821 | 1 |
| Mode SS | |||
|---|---|---|---|
| Quadrant | BADHDUFLAG | Total packets | Discarded packets |
| A | 0 | 140 | 0 |
| B | 0 | 140 | 0 |
| C | 0 | 140 | 0 |
| D | 0 | 140 | 0 |
| Mode M9 | |||
|---|---|---|---|
| Quadrant | BADHDUFLAG | Total packets | Discarded packets |
| A | 0 | 3 | 0 |
| B | 0 | 3 | 0 |
| C | 0 | 3 | 0 |
| D | 0 | 3 | 0 |
| Quadrant | Total seconds | Saturated seconds | Saturation percentage |
|---|---|---|---|
| A | 6979 | 96 | 1.375555% |
| B | 6979 | 517 | 7.407938% |
| C | 6979 | 1096 | 15.704256% |
| D | 6979 | 218 | 3.123657% |
Noise dominated data is calculated using 1-second bins in cleaned event files. If a bin has >2000 counts, and if more than 50% of those come from <1% of pixels, then it is considered to be noise-dominated and hence unusable.
| Quadrant | # 1 sec bins | Bins with >0 counts | Bins with >2000 counts | High rate bins dominated by noise | Noise dominated (total time) | Noise dominated (detector-on time) | Marked lightcurve |
|---|---|---|---|---|---|---|---|
| A | 7234 | 6980 | 0 | 0 | 0.00% | 0.00% | 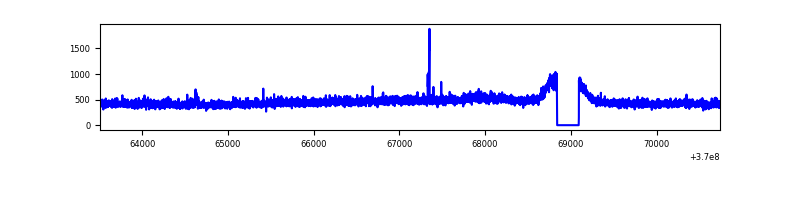 |
| B | 7234 | 6980 | 268 | 268 | 3.70% | 3.84% | 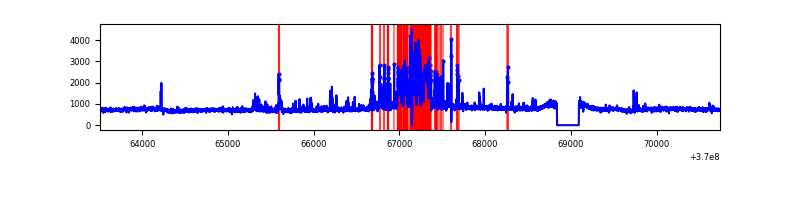 |
| C | 7234 | 6980 | 481 | 481 | 6.65% | 6.89% | 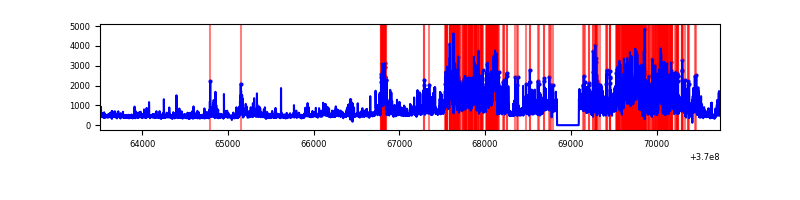 |
| D | 7234 | 6980 | 105 | 105 | 1.45% | 1.50% | 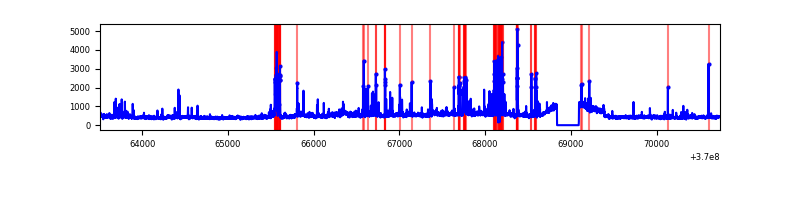 |
Top three noisy pixels from each quadrant. If the there are fewer than three noisy pixels in the level2.evt file, extra rows are filled as -1
| Pixel properties | Quadrant properties | ||||||
|---|---|---|---|---|---|---|---|
| Quadrant | DetID | PixID | Counts | Sigma | Mean | Median | Sigma |
| A | 13 | 6 | 19972 | 115.15 | 818 | 799 | 166.5 |
| A | 0 | 6 | 17294 | 99.07 | 818 | 799 | 166.5 |
| A | 13 | 254 | 12981 | 73.16 | 818 | 799 | 166.5 |
| B | 6 | 159 | 1937568 | 12792.01 | 791 | 768 | 151.4 |
| B | 5 | 172 | 753713 | 4972.99 | 791 | 768 | 151.4 |
| B | 0 | 190 | 108306 | 710.26 | 791 | 768 | 151.4 |
| C | 3 | 233 | 2727454 | 15470.85 | 749 | 754 | 176.2 |
| C | 14 | 238 | 152003 | 858.16 | 749 | 754 | 176.2 |
| C | 0 | 10 | 105015 | 591.56 | 749 | 754 | 176.2 |
| D | 8 | 195 | 424935 | 2251.82 | 789 | 765 | 188.4 |
| D | 1 | 47 | 163170 | 862.17 | 789 | 765 | 188.4 |
| D | 12 | 3 | 109749 | 578.57 | 789 | 765 | 188.4 |
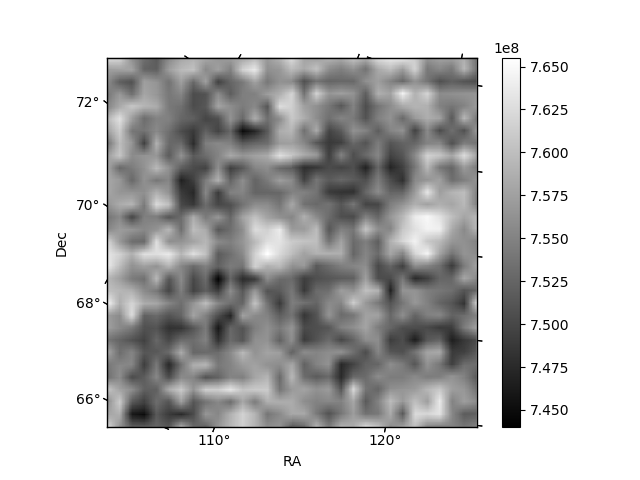
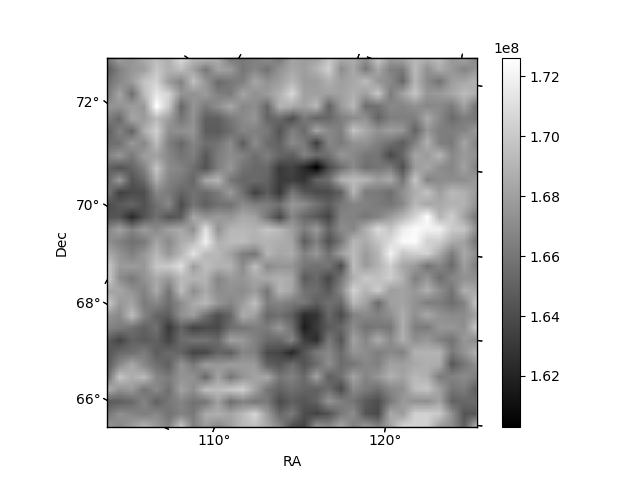
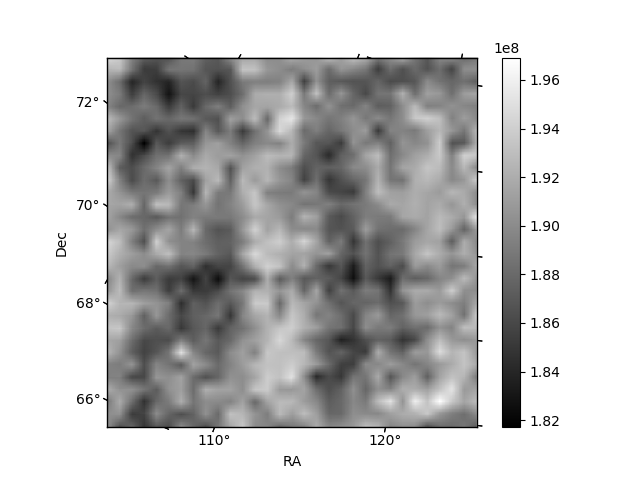
Histogram calculated using DETX and DETY for each event in the final _common_clean file
| Quadrant A | 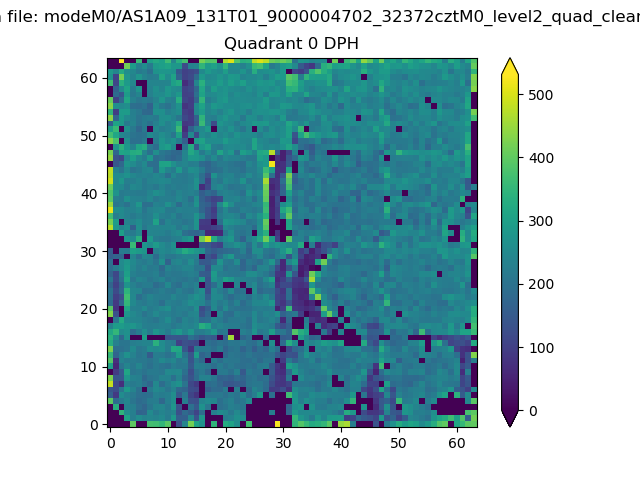 |
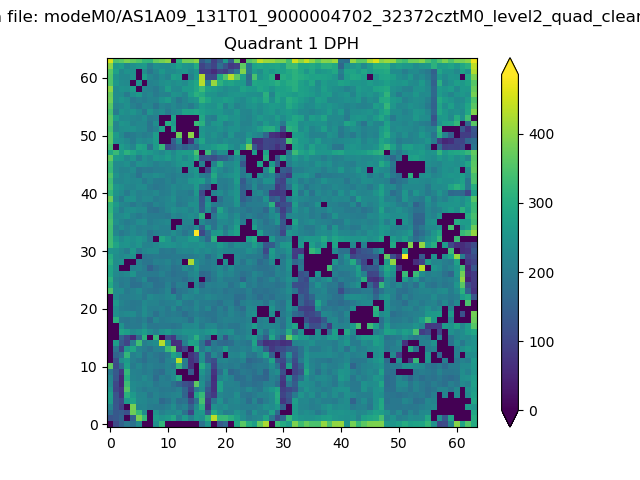 |
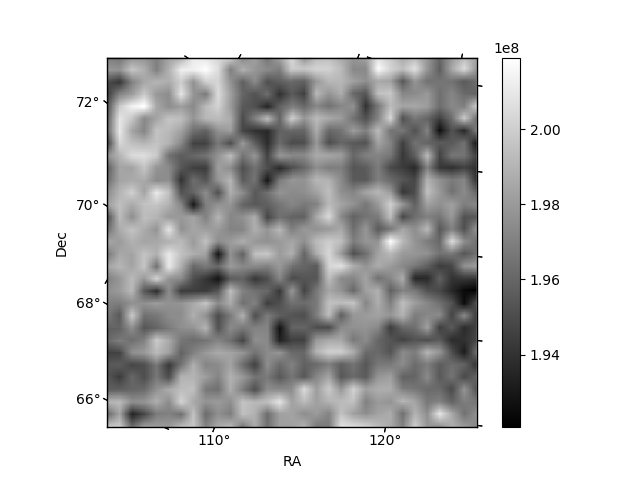
Quadrant B |
|---|---|---|---|
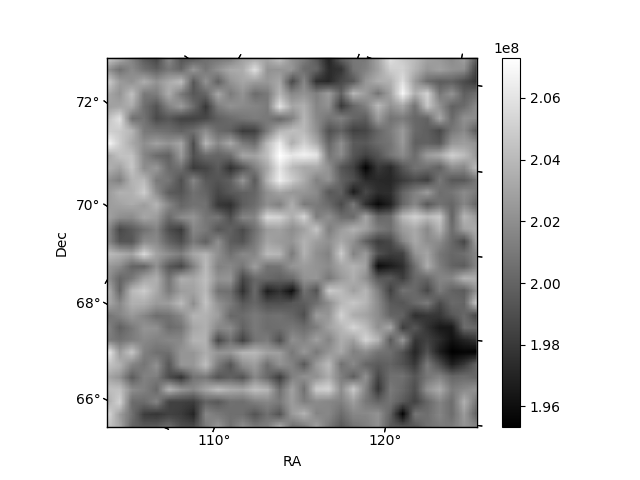
| Quadrant D | 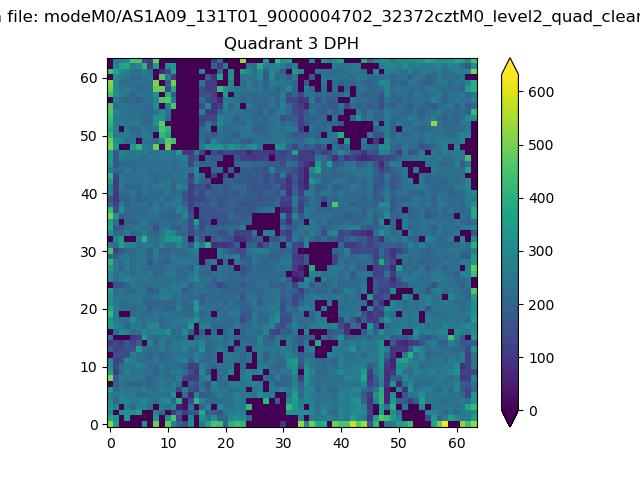 |
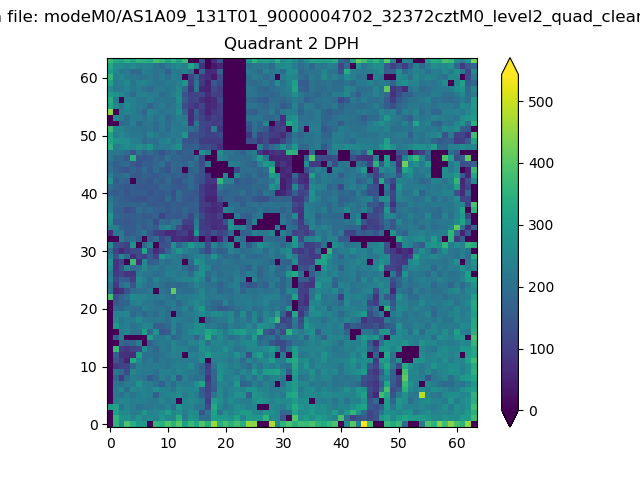 |
Quadrant C |
| Plot type | Count rate plots | Images |
|---|---|---|
| Comparison with Poisson distribution Blue bars denote a histogram of data divided into 1 sec bins. Red curve is a Poisson curve with rate = median count rate of data. |
 |
 |
| Quadrant-wise count rates Data is divided into 100 sec bins |
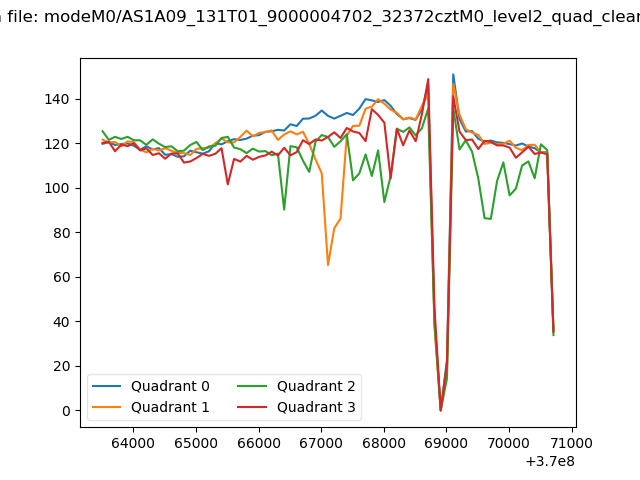 |
|
| Module-wise count rates for Quadrant A Data is divided into 100 sec bins |
 |
 |
| Module-wise count rates for Quadrant B Data is divided into 100 sec bins |
 |
 |
| Module-wise count rates for Quadrant C Data is divided into 100 sec bins |
 |
 |
| Module-wise count rates for Quadrant D Data is divided into 100 sec bins |
 |
 |
| Parameter | Plot |
|---|---|
| CZT HV Monitor | 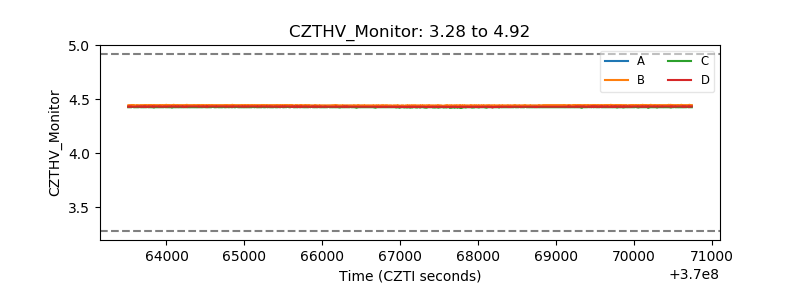 |
| D_VDD | 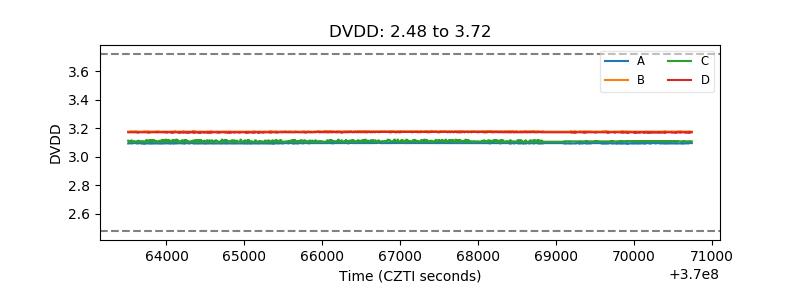 |
| Temperature 1 |  |
| Veto HV Monitor | 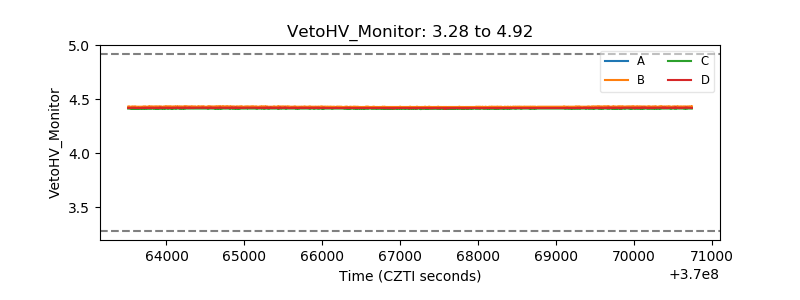 |
| Veto LLD | 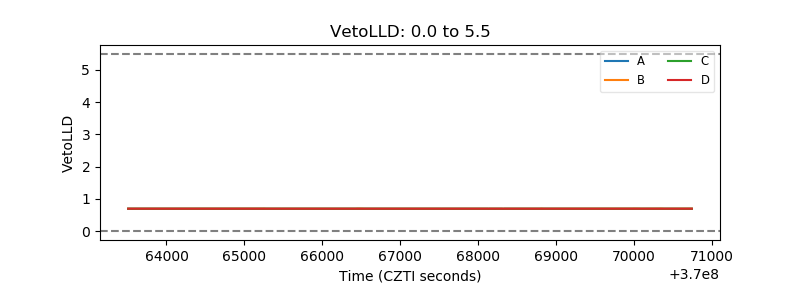 |
| Alpha Counter | 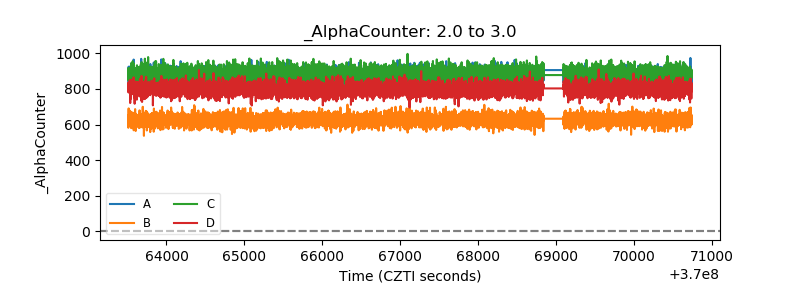 |
| _CPM_Rate | 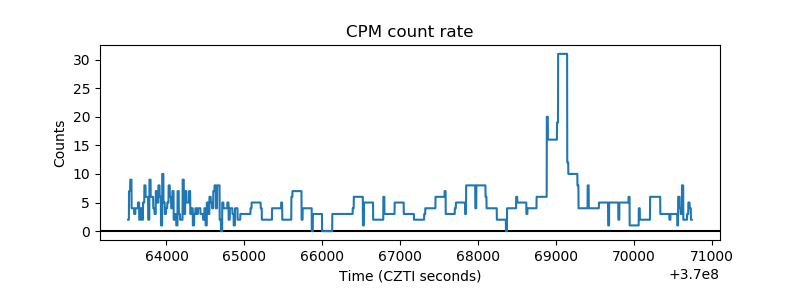 |
| CZT Counter | 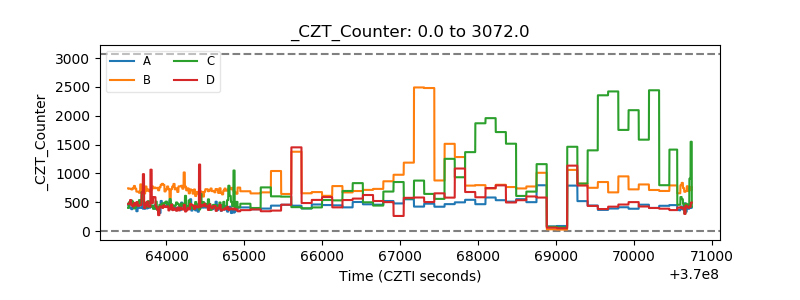 |
| +2.5 Volts monitor |  |
| +5 Volts monitor |  |
| _ROLL_ROT |  |
| _Roll_DEC |  |
| _Roll_RA | 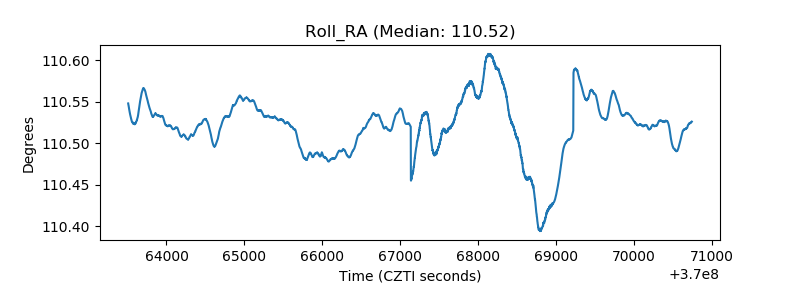 |
| Veto Counter |  |