| Param | Original file | Final file |
|---|---|---|
| Filename | modeM0/AS1A09_131T01_9000004702_32375cztM0_level2.evt | modeM0/AS1A09_131T01_9000004702_32375cztM0_level2_quad_clean.evt |
| Size (bytes) | 1,560,712,320 | 326,998,080 |
| Size | 1.5 GB | 311.8 MB |
| Events in quadrant A | 8,148,373 | 2,241,538 |
| Events in quadrant B | 16,026,151 | 2,174,539 |
| Events in quadrant C | 9,545,335 | 2,165,703 |
| Events in quadrant D | 12,352,126 | 2,100,416 |
| Mode M0 | |||
|---|---|---|---|
| Quadrant | BADHDUFLAG | Total packets | Discarded packets |
| A | 0 | 35929 | 4 |
| B | 0 | 60602 | 3 |
| C | 0 | 39519 | 3 |
| D | 0 | 48701 | 3 |
| Mode SS | |||
|---|---|---|---|
| Quadrant | BADHDUFLAG | Total packets | Discarded packets |
| A | 0 | 360 | 0 |
| B | 0 | 360 | 0 |
| C | 0 | 360 | 0 |
| D | 0 | 360 | 0 |
| Mode M9 | |||
|---|---|---|---|
| Quadrant | BADHDUFLAG | Total packets | Discarded packets |
| A | 0 | 22 | 0 |
| B | 0 | 22 | 0 |
| C | 0 | 22 | 0 |
| D | 0 | 22 | 0 |
| Quadrant | Total seconds | Saturated seconds | Saturation percentage |
|---|---|---|---|
| A | 17736 | 92 | 0.518719% |
| B | 17736 | 1088 | 6.134416% |
| C | 17736 | 706 | 3.980604% |
| D | 17736 | 515 | 2.903699% |
Noise dominated data is calculated using 1-second bins in cleaned event files. If a bin has >2000 counts, and if more than 50% of those come from <1% of pixels, then it is considered to be noise-dominated and hence unusable.
| Quadrant | # 1 sec bins | Bins with >0 counts | Bins with >2000 counts | High rate bins dominated by noise | Noise dominated (total time) | Noise dominated (detector-on time) | Marked lightcurve |
|---|---|---|---|---|---|---|---|
| A | 19811 | 17739 | 0 | 0 | 0.00% | 0.00% | 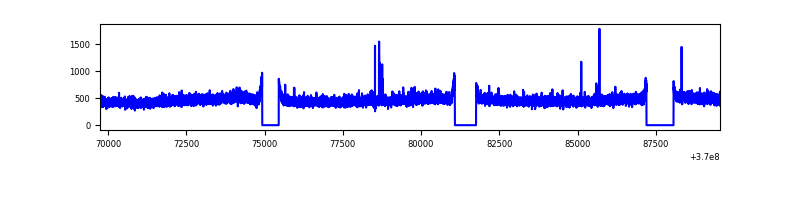 |
| B | 19811 | 17739 | 603 | 603 | 3.04% | 3.40% | 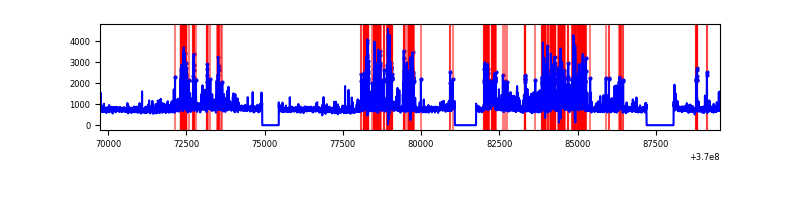 |
| C | 19811 | 17739 | 180 | 180 | 0.91% | 1.01% | 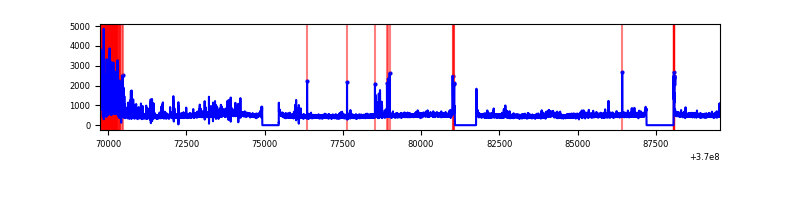 |
| D | 19811 | 17739 | 358 | 358 | 1.81% | 2.02% | 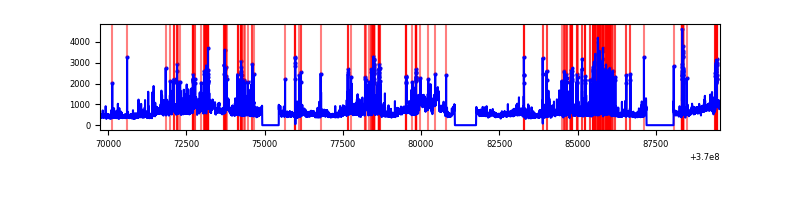 |
Top three noisy pixels from each quadrant. If the there are fewer than three noisy pixels in the level2.evt file, extra rows are filled as -1
| Pixel properties | Quadrant properties | ||||||
|---|---|---|---|---|---|---|---|
| Quadrant | DetID | PixID | Counts | Sigma | Mean | Median | Sigma |
| A | 13 | 6 | 60506 | 140.14 | 2088 | 2040 | 417.2 |
| A | 13 | 254 | 33395 | 75.16 | 2088 | 2040 | 417.2 |
| A | 3 | 137 | 20983 | 45.4 | 2088 | 2040 | 417.2 |
| B | 6 | 159 | 4790231 | 12513.27 | 2024 | 1972 | 382.7 |
| B | 5 | 172 | 1691639 | 4415.65 | 2024 | 1972 | 382.7 |
| B | 10 | 245 | 706909 | 1842.23 | 2024 | 1972 | 382.7 |
| C | 3 | 233 | 863543 | 1876.68 | 1983 | 1995 | 459.1 |
| C | 14 | 238 | 425499 | 922.5 | 1983 | 1995 | 459.1 |
| C | 14 | 254 | 149170 | 320.59 | 1983 | 1995 | 459.1 |
| D | 8 | 195 | 2756753 | 5863.55 | 2000 | 1947 | 469.8 |
| D | 12 | 233 | 608827 | 1291.73 | 2000 | 1947 | 469.8 |
| D | 14 | 52 | 408093 | 864.47 | 2000 | 1947 | 469.8 |
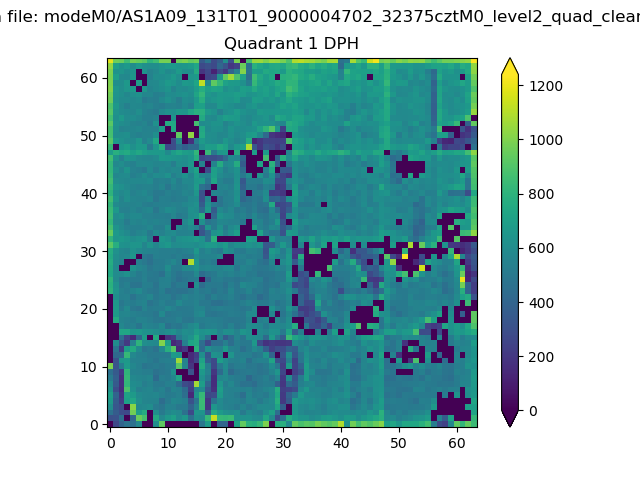
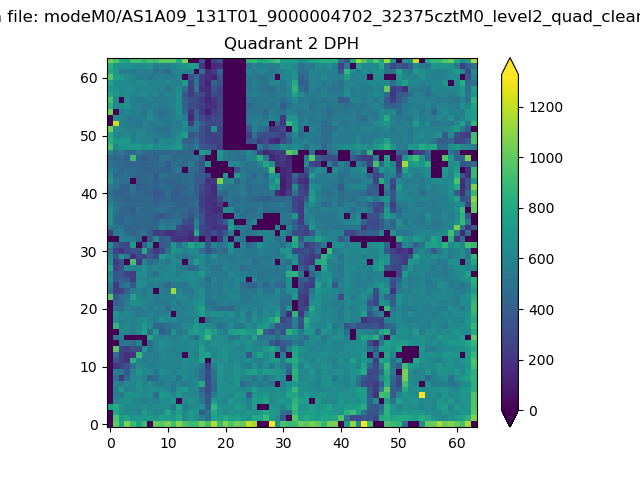
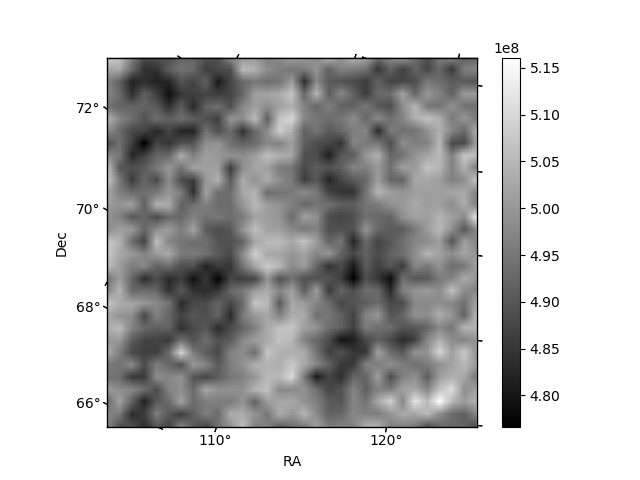
Histogram calculated using DETX and DETY for each event in the final _common_clean file
| Quadrant A |  |
 |
Quadrant B |
|---|---|---|---|
| Quadrant D | 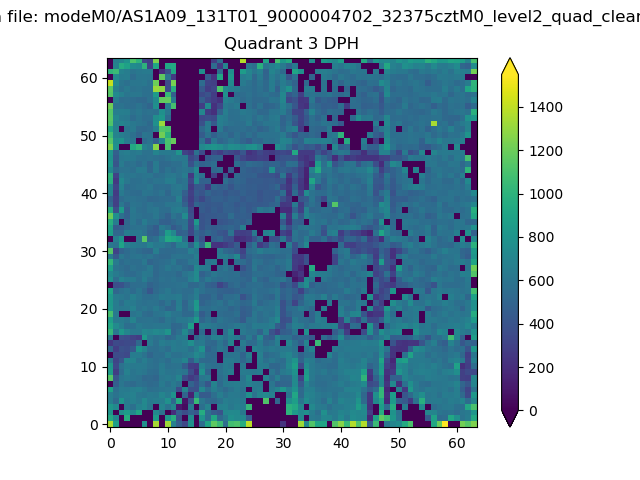 |
 |
Quadrant C |
| Plot type | Count rate plots | Images |
|---|---|---|
| Comparison with Poisson distribution Blue bars denote a histogram of data divided into 1 sec bins. Red curve is a Poisson curve with rate = median count rate of data. |
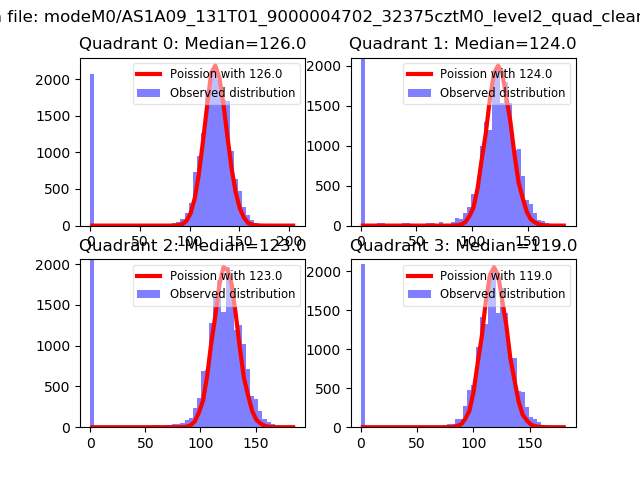 |
 |
| Quadrant-wise count rates Data is divided into 100 sec bins |
 |
|
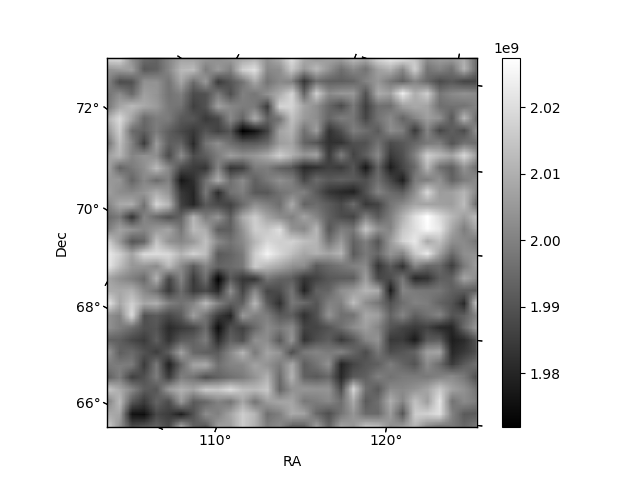
| Module-wise count rates for Quadrant A Data is divided into 100 sec bins |
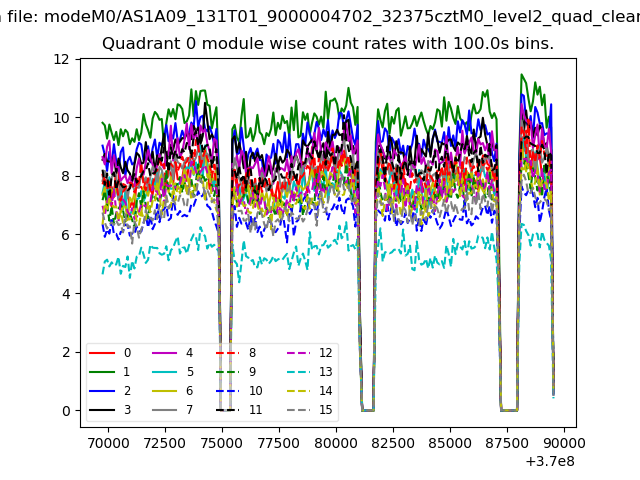 |
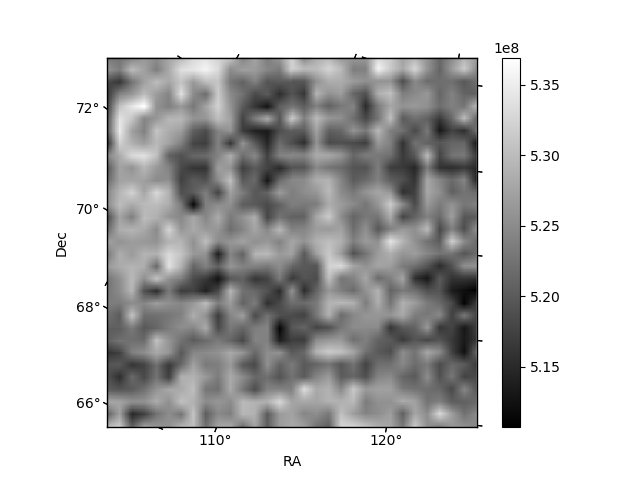 |
| Module-wise count rates for Quadrant B Data is divided into 100 sec bins |
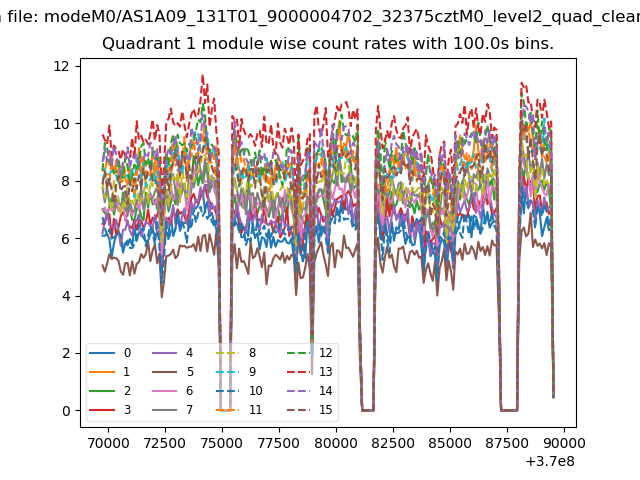 |
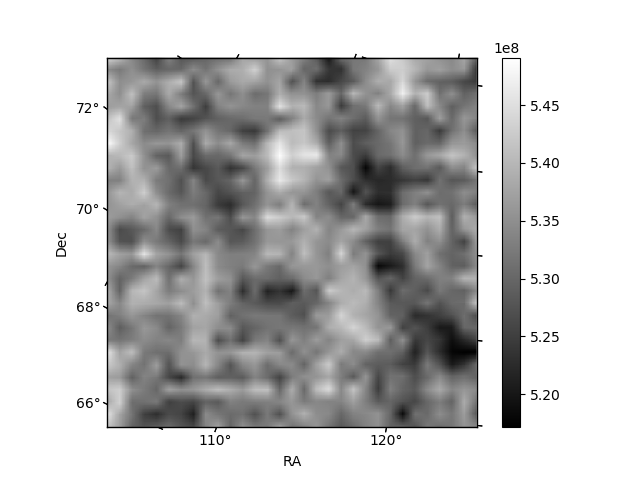 |
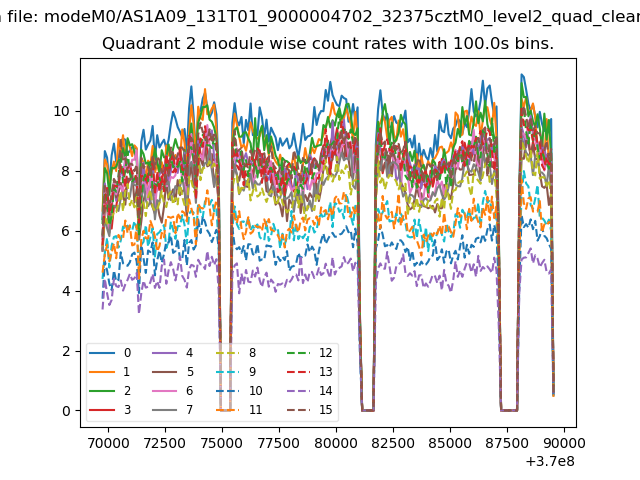
| Module-wise count rates for Quadrant C Data is divided into 100 sec bins |
 |
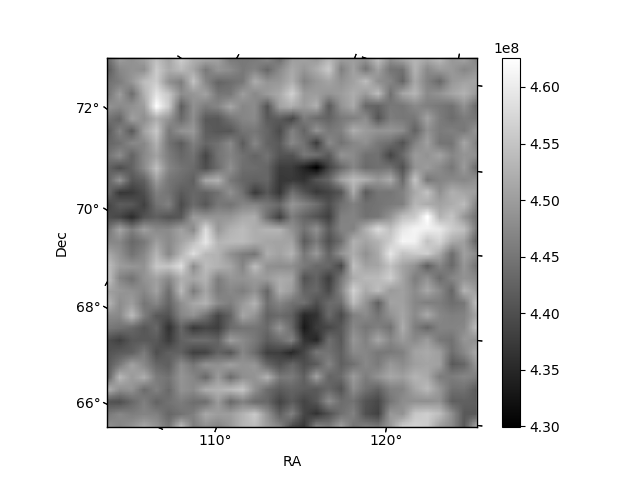 |
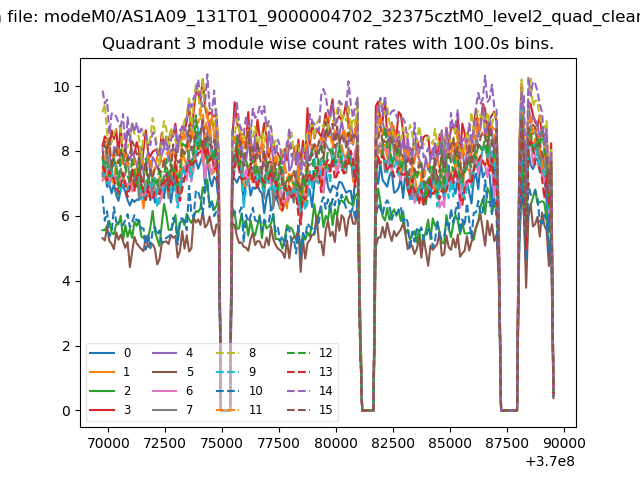
| Module-wise count rates for Quadrant D Data is divided into 100 sec bins |
 |
 |
| Parameter | Plot |
|---|---|
| CZT HV Monitor | 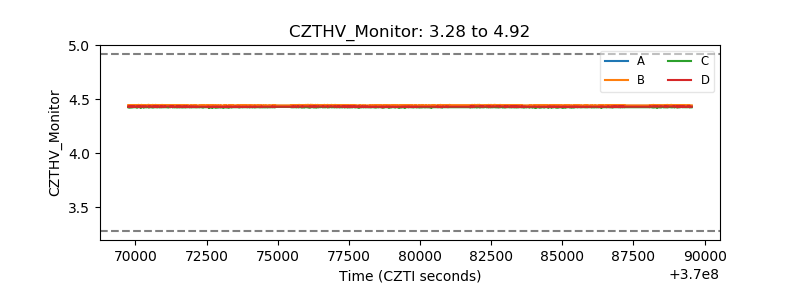 |
| D_VDD | 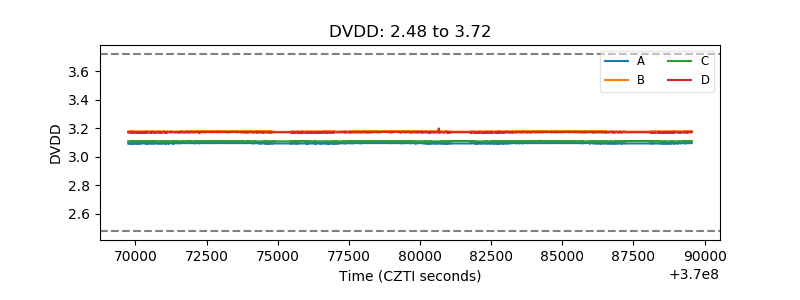 |
| Temperature 1 | 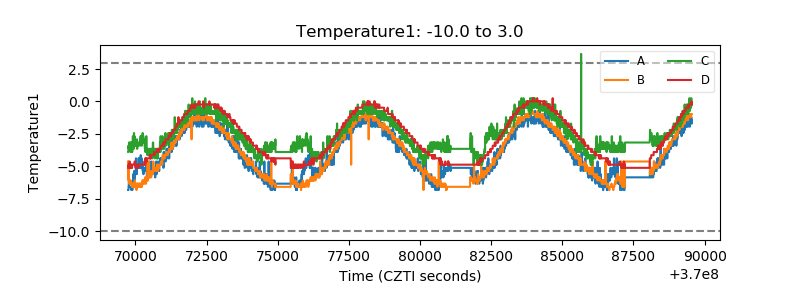 |
| Veto HV Monitor | 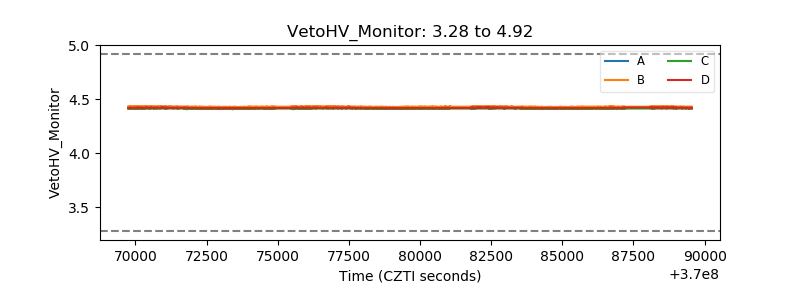 |
| Veto LLD | 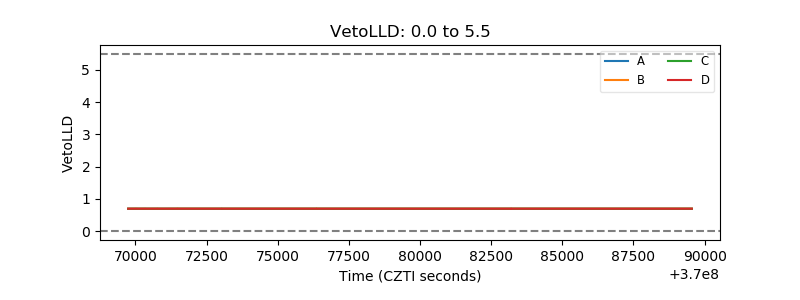 |
| Alpha Counter | 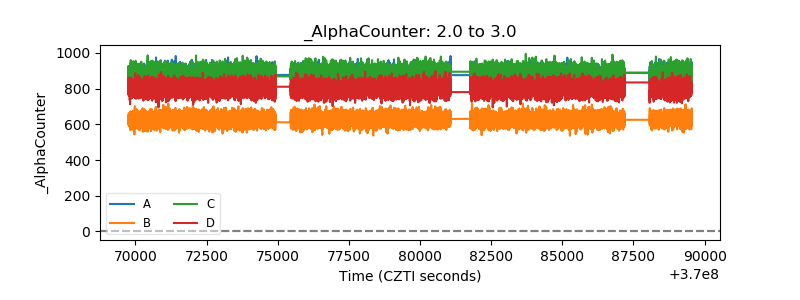 |
| _CPM_Rate | 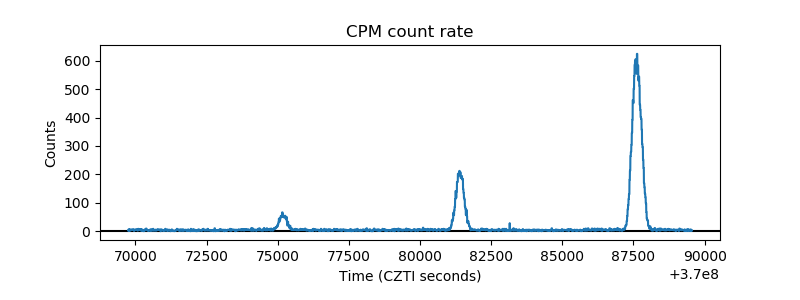 |
| CZT Counter | 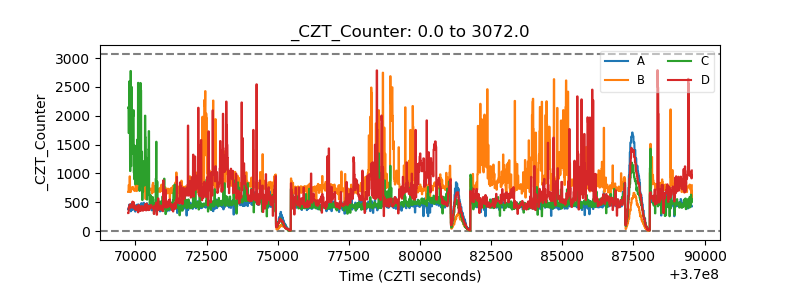 |
| +2.5 Volts monitor |  |
| +5 Volts monitor |  |
| _ROLL_ROT | 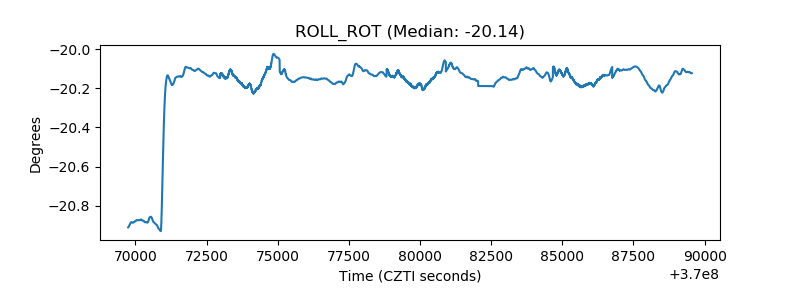 |
| _Roll_DEC | 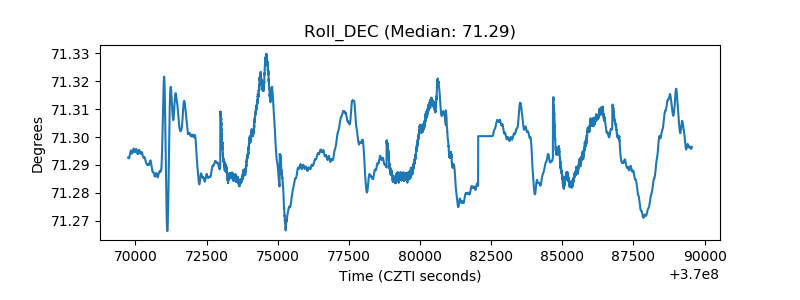 |
| _Roll_RA | 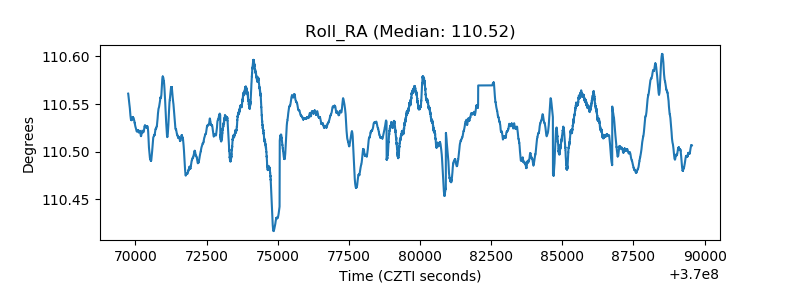 |
| Veto Counter | 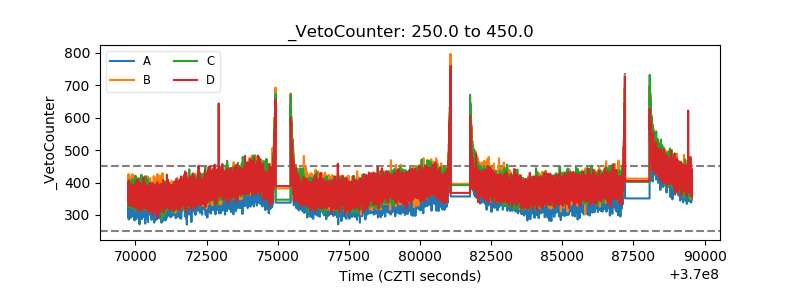 |