| Param | Original file | Final file |
|---|---|---|
| Filename | modeM0/AS1A09_131T01_9000004702_32379cztM0_level2.evt | modeM0/AS1A09_131T01_9000004702_32379cztM0_level2_quad_clean.evt |
| Size (bytes) | 633,395,520 | 122,048,640 |
| Size | 604.1 MB | 116.4 MB |
| Events in quadrant A | 2,937,295 | 871,754 |
| Events in quadrant B | 8,063,817 | 768,128 |
| Events in quadrant C | 3,846,513 | 831,687 |
| Events in quadrant D | 3,946,426 | 822,795 |
| Mode M0 | |||
|---|---|---|---|
| Quadrant | BADHDUFLAG | Total packets | Discarded packets |
| A | 0 | 12458 | 2 |
| B | 0 | 28015 | 1 |
| C | 0 | 15180 | 1 |
| D | 0 | 15697 | 1 |
| Mode SS | |||
|---|---|---|---|
| Quadrant | BADHDUFLAG | Total packets | Discarded packets |
| A | 0 | 118 | 0 |
| B | 0 | 118 | 0 |
| C | 0 | 118 | 0 |
| D | 0 | 118 | 0 |
| Mode M9 | |||
|---|---|---|---|
| Quadrant | BADHDUFLAG | Total packets | Discarded packets |
| A | 0 | 12 | 0 |
| B | 0 | 12 | 0 |
| C | 0 | 12 | 0 |
| D | 0 | 12 | 0 |
| Quadrant | Total seconds | Saturated seconds | Saturation percentage |
|---|---|---|---|
| A | 5736 | 58 | 1.011158% |
| B | 5736 | 1829 | 31.886332% |
| C | 5736 | 426 | 7.426778% |
| D | 5736 | 175 | 3.050907% |
Noise dominated data is calculated using 1-second bins in cleaned event files. If a bin has >2000 counts, and if more than 50% of those come from <1% of pixels, then it is considered to be noise-dominated and hence unusable.
| Quadrant | # 1 sec bins | Bins with >0 counts | Bins with >2000 counts | High rate bins dominated by noise | Noise dominated (total time) | Noise dominated (detector-on time) | Marked lightcurve |
|---|---|---|---|---|---|---|---|
| A | 6971 | 5737 | 0 | 0 | 0.00% | 0.00% | 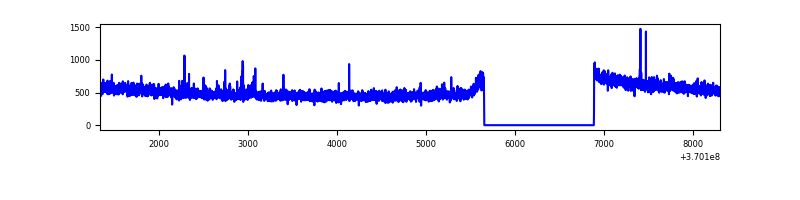 |
| B | 6971 | 5737 | 1342 | 1342 | 19.25% | 23.39% | 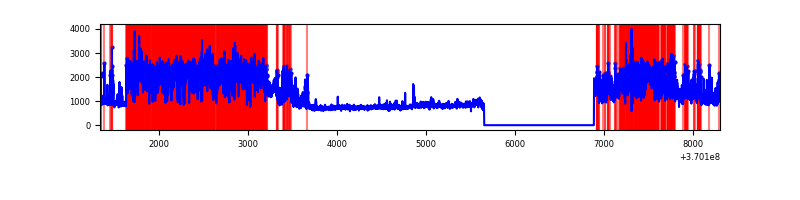 |
| C | 6971 | 5737 | 188 | 188 | 2.70% | 3.28% | 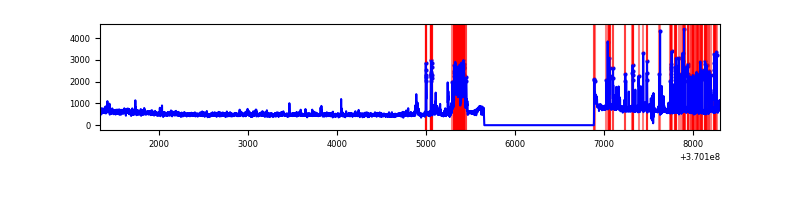 |
| D | 6971 | 5737 | 99 | 99 | 1.42% | 1.73% | 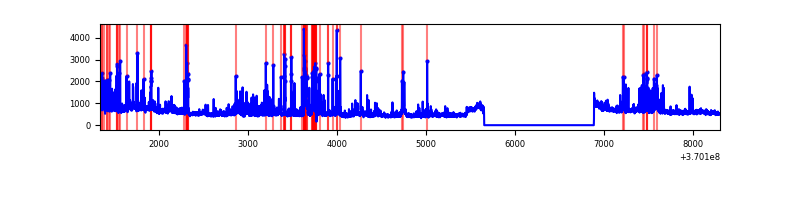 |
Top three noisy pixels from each quadrant. If the there are fewer than three noisy pixels in the level2.evt file, extra rows are filled as -1
| Pixel properties | Quadrant properties | ||||||
|---|---|---|---|---|---|---|---|
| Quadrant | DetID | PixID | Counts | Sigma | Mean | Median | Sigma |
| A | 0 | 6 | 25916 | 170.17 | 749 | 734 | 148.0 |
| A | 13 | 6 | 13327 | 85.1 | 749 | 734 | 148.0 |
| A | 13 | 254 | 10658 | 67.06 | 749 | 734 | 148.0 |
| B | 4 | 80 | 3286093 | 26475.33 | 674 | 660 | 124.1 |
| B | 6 | 159 | 1558019 | 12549.82 | 674 | 660 | 124.1 |
| B | 5 | 172 | 429649 | 3456.96 | 674 | 660 | 124.1 |
| C | 3 | 233 | 784478 | 4780.47 | 715 | 720 | 164.0 |
| C | 14 | 238 | 126244 | 765.62 | 715 | 720 | 164.0 |
| C | 14 | 67 | 54117 | 325.69 | 715 | 720 | 164.0 |
| D | 13 | 249 | 349432 | 2032.64 | 732 | 713 | 171.6 |
| D | 8 | 195 | 349074 | 2030.55 | 732 | 713 | 171.6 |
| D | 12 | 1 | 154977 | 899.19 | 732 | 713 | 171.6 |
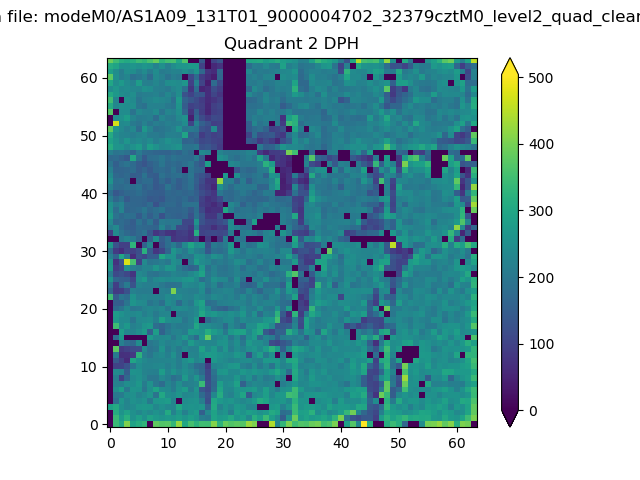
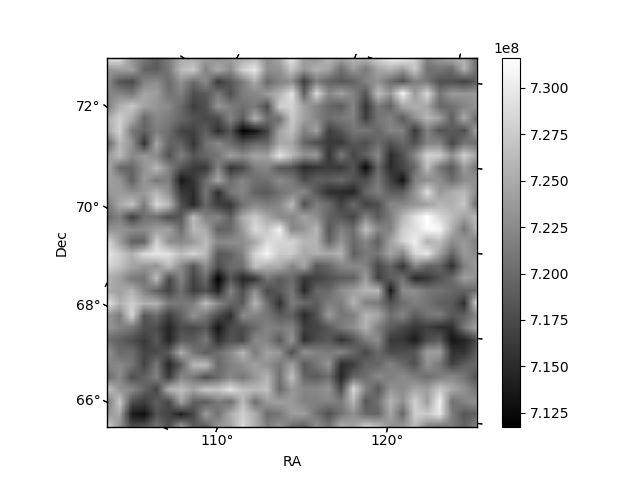
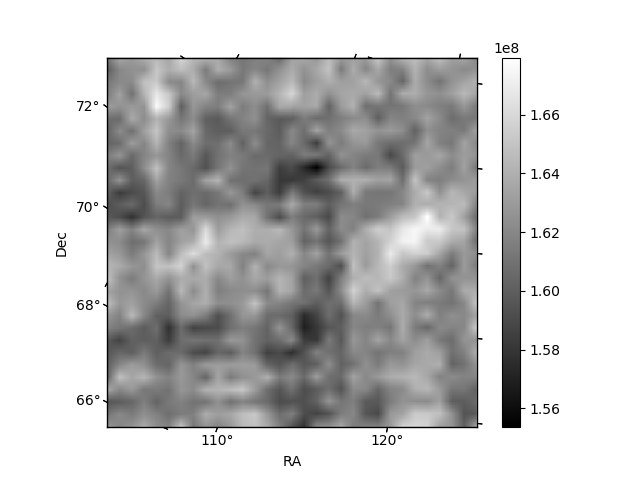
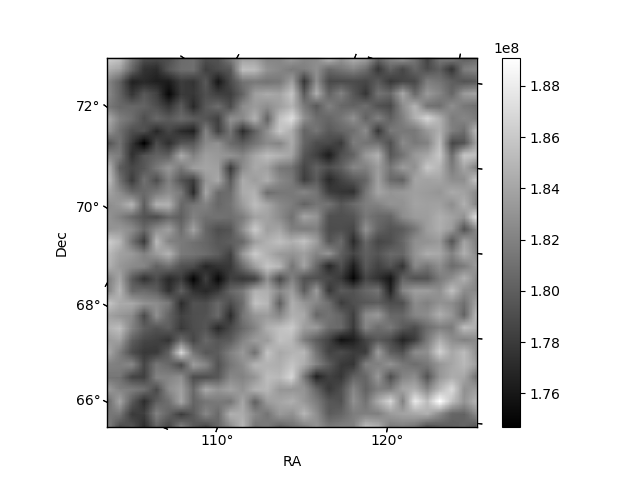
Histogram calculated using DETX and DETY for each event in the final _common_clean file
| Quadrant A | 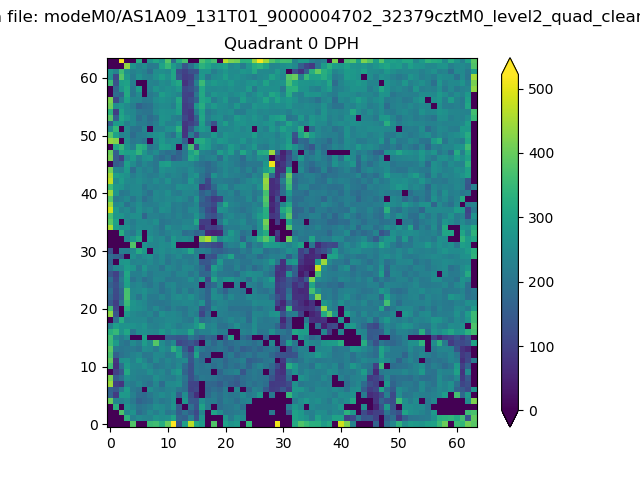 |
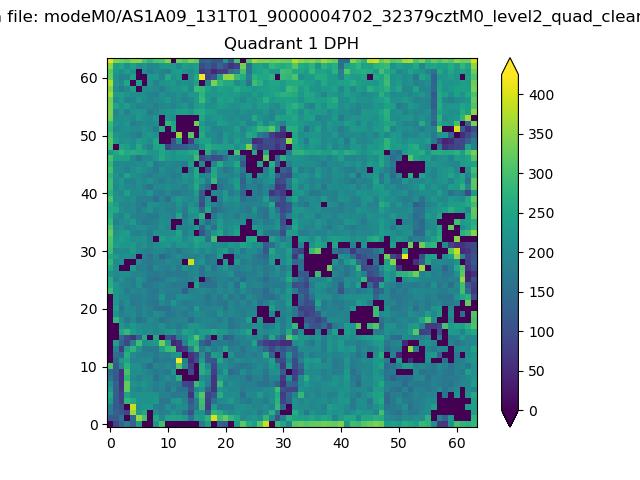 |
Quadrant B |
|---|---|---|---|
| Quadrant D | 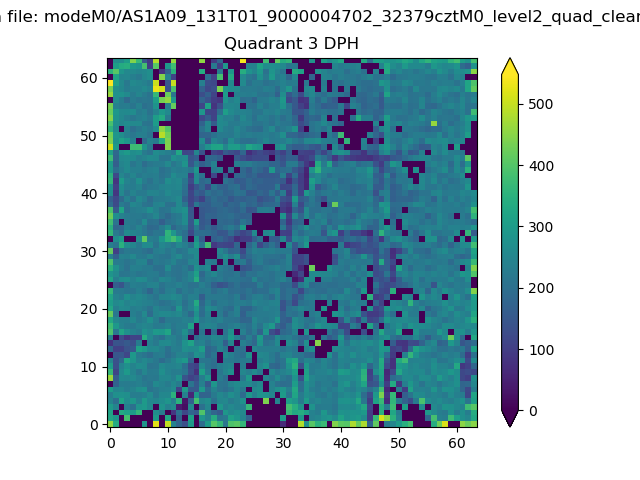 |
 |
Quadrant C |
| Plot type | Count rate plots | Images |
|---|---|---|
| Comparison with Poisson distribution Blue bars denote a histogram of data divided into 1 sec bins. Red curve is a Poisson curve with rate = median count rate of data. |
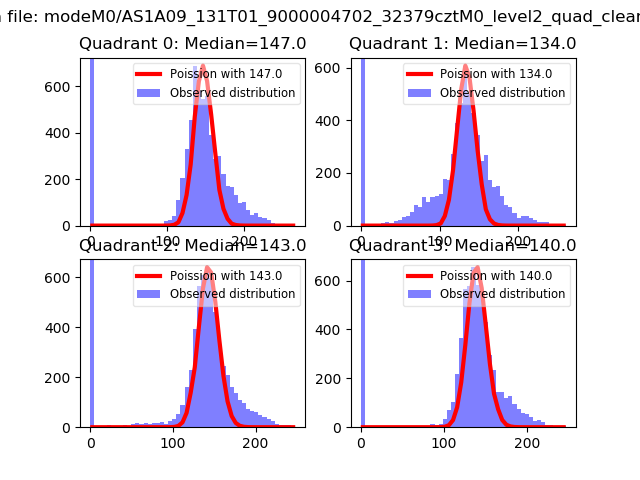 |
 |
| Quadrant-wise count rates Data is divided into 100 sec bins |
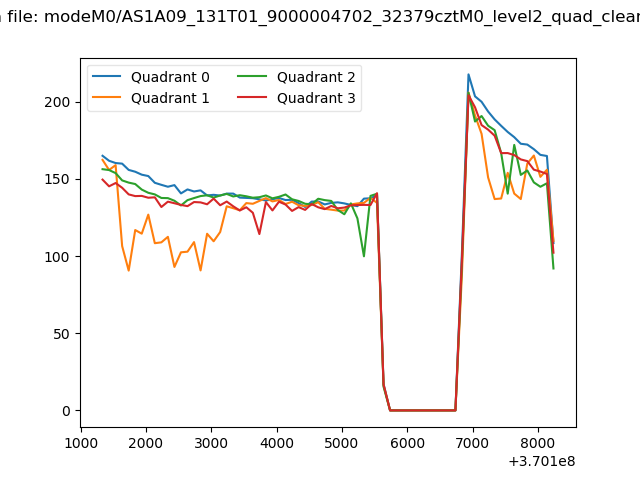 |
|
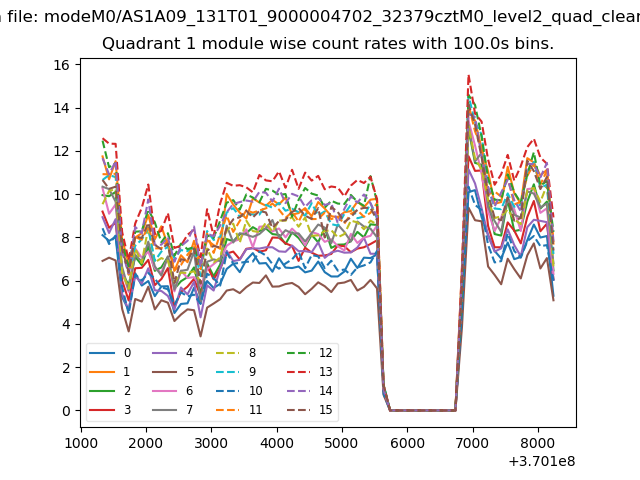
| Module-wise count rates for Quadrant A Data is divided into 100 sec bins |
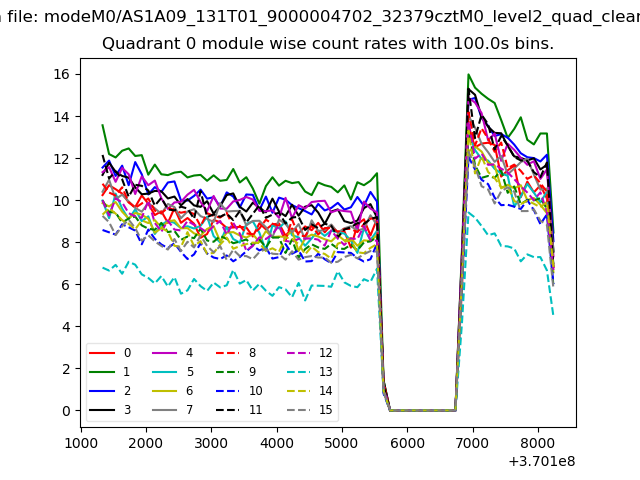 |
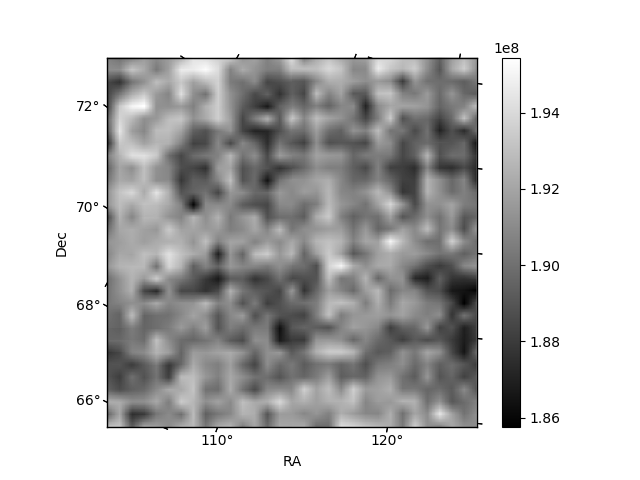 |
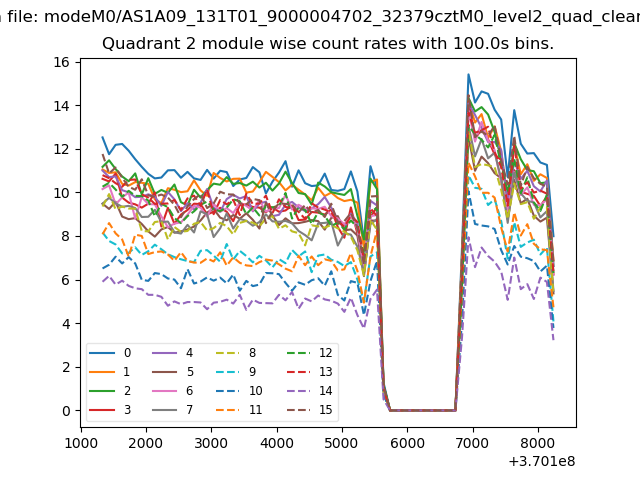
| Module-wise count rates for Quadrant B Data is divided into 100 sec bins |
 |
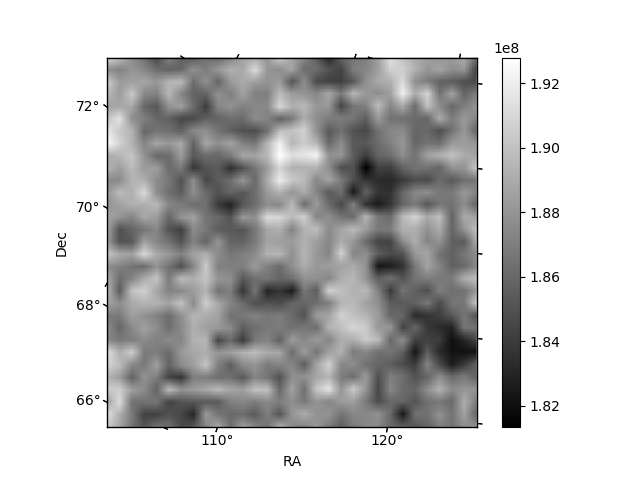 |
| Module-wise count rates for Quadrant C Data is divided into 100 sec bins |
 |
 |
| Module-wise count rates for Quadrant D Data is divided into 100 sec bins |
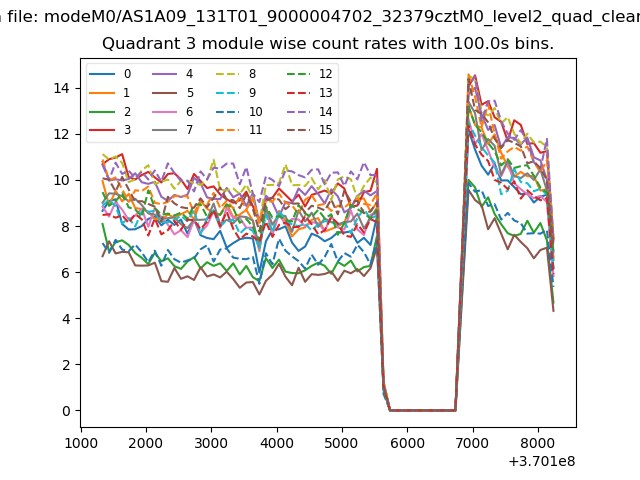 |
 |
| Parameter | Plot |
|---|---|
| CZT HV Monitor | 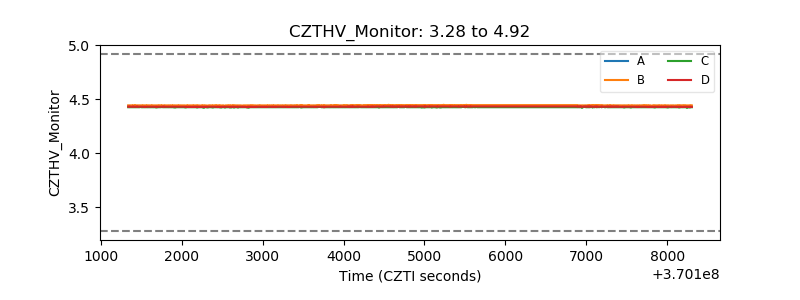 |
| D_VDD | 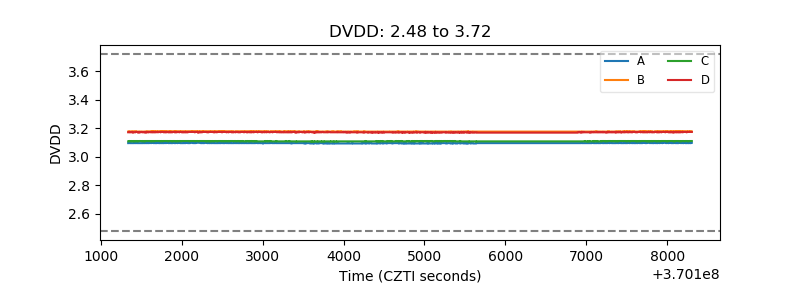 |
| Temperature 1 |  |
| Veto HV Monitor | 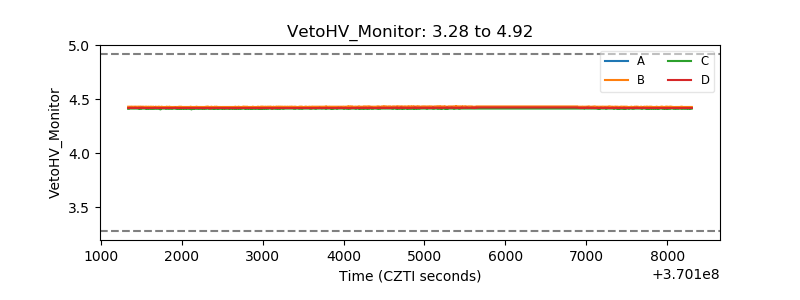 |
| Veto LLD | 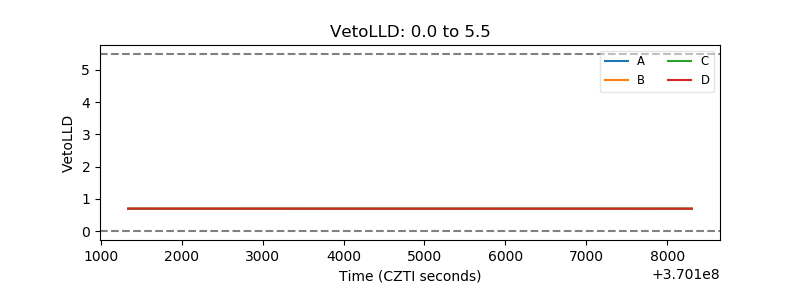 |
| Alpha Counter | 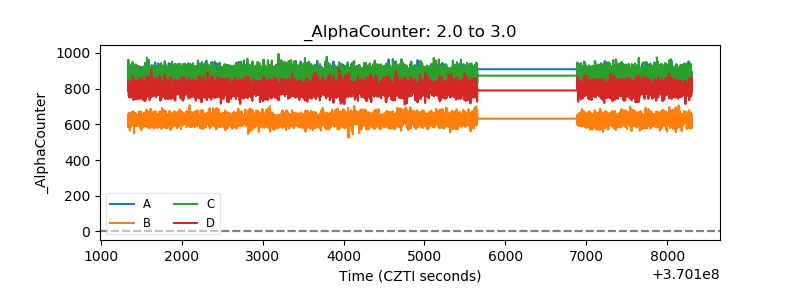 |
| _CPM_Rate | 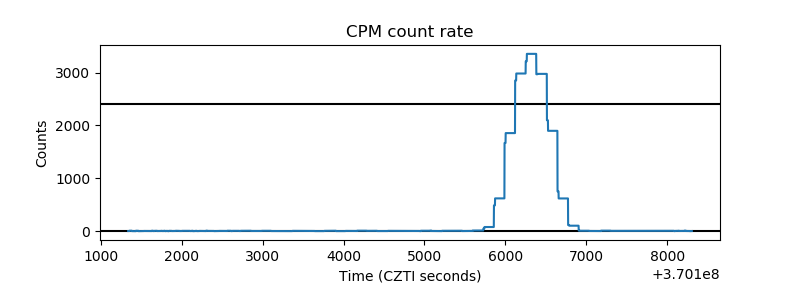 |
| CZT Counter | 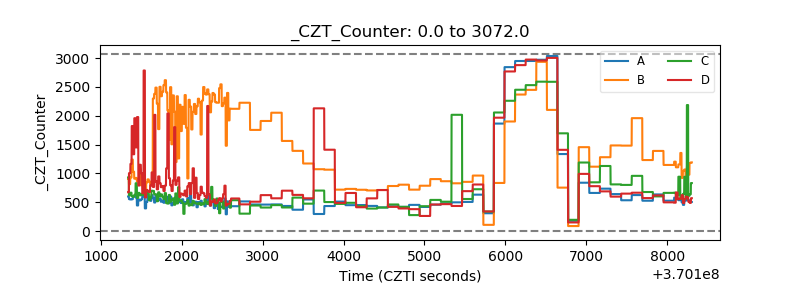 |
| +2.5 Volts monitor | 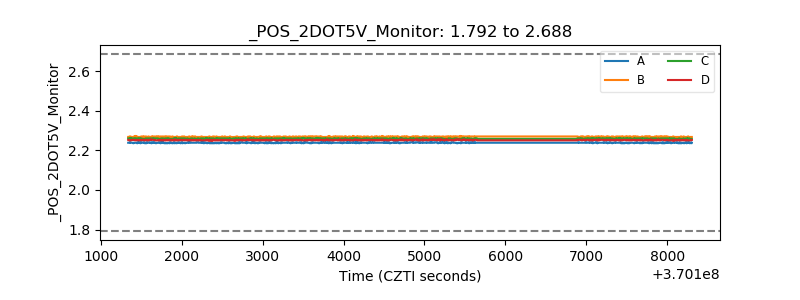 |
| +5 Volts monitor |  |
| _ROLL_ROT | 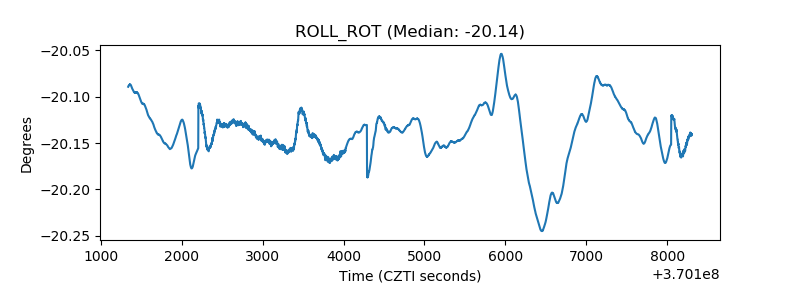 |
| _Roll_DEC | 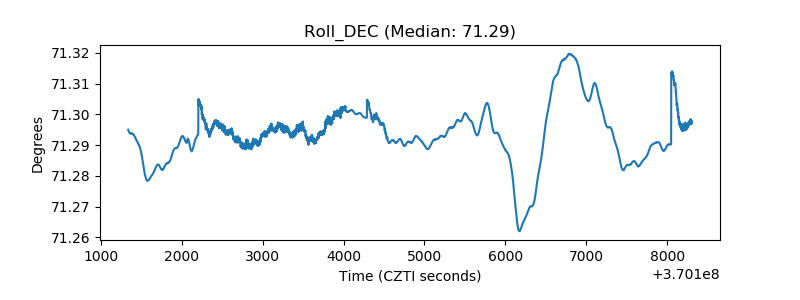 |
| _Roll_RA | 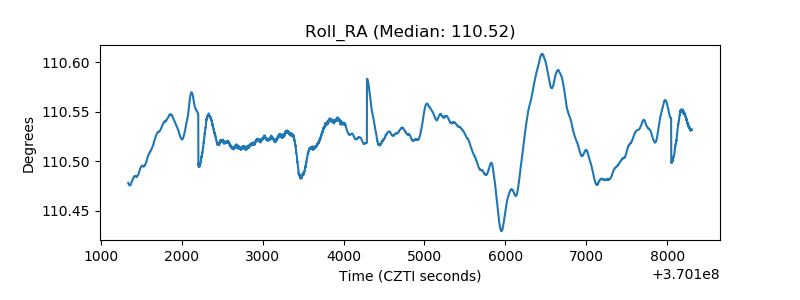 |
| Veto Counter | 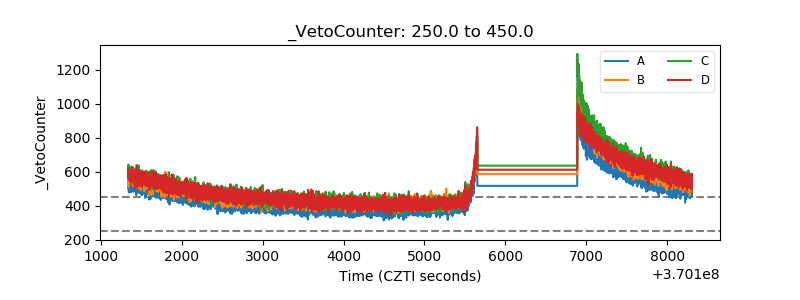 |