| Param | Original file | Final file |
|---|---|---|
| Filename | modeM0/AS1A09_131T01_9000004702_32380cztM0_level2.evt | modeM0/AS1A09_131T01_9000004702_32380cztM0_level2_quad_clean.evt |
| Size (bytes) | 684,936,000 | 140,218,560 |
| Size | 653.2 MB | 133.7 MB |
| Events in quadrant A | 3,302,423 | 997,246 |
| Events in quadrant B | 7,946,719 | 912,559 |
| Events in quadrant C | 4,591,963 | 961,198 |
| Events in quadrant D | 4,481,751 | 940,723 |
| Mode M0 | |||
|---|---|---|---|
| Quadrant | BADHDUFLAG | Total packets | Discarded packets |
| A | 0 | 13924 | 2 |
| B | 0 | 27987 | 1 |
| C | 0 | 17878 | 1 |
| D | 0 | 17728 | 1 |
| Mode SS | |||
|---|---|---|---|
| Quadrant | BADHDUFLAG | Total packets | Discarded packets |
| A | 0 | 126 | 0 |
| B | 0 | 126 | 0 |
| C | 0 | 126 | 0 |
| D | 0 | 126 | 0 |
| Mode M9 | |||
|---|---|---|---|
| Quadrant | BADHDUFLAG | Total packets | Discarded packets |
| A | 0 | 13 | 0 |
| B | 0 | 13 | 0 |
| C | 0 | 13 | 0 |
| D | 0 | 13 | 0 |
| Quadrant | Total seconds | Saturated seconds | Saturation percentage |
|---|---|---|---|
| A | 6228 | 75 | 1.204239% |
| B | 6228 | 1398 | 22.447013% |
| C | 6228 | 519 | 8.333333% |
| D | 6228 | 264 | 4.238921% |
Noise dominated data is calculated using 1-second bins in cleaned event files. If a bin has >2000 counts, and if more than 50% of those come from <1% of pixels, then it is considered to be noise-dominated and hence unusable.
| Quadrant | # 1 sec bins | Bins with >0 counts | Bins with >2000 counts | High rate bins dominated by noise | Noise dominated (total time) | Noise dominated (detector-on time) | Marked lightcurve |
|---|---|---|---|---|---|---|---|
| A | 7518 | 6229 | 0 | 0 | 0.00% | 0.00% | 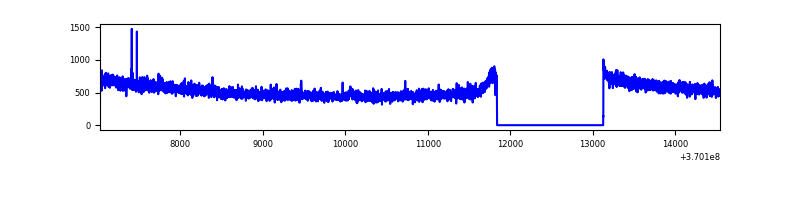 |
| B | 7517 | 6228 | 753 | 753 | 10.02% | 12.09% | 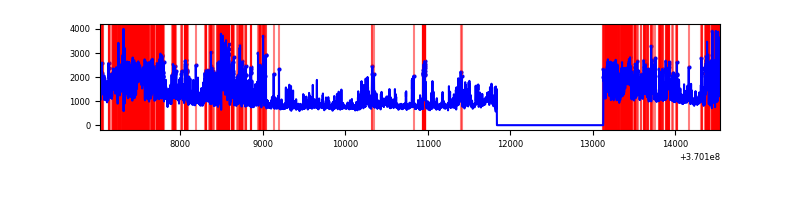 |
| C | 7518 | 6229 | 160 | 160 | 2.13% | 2.57% |  |
| D | 7518 | 6229 | 133 | 133 | 1.77% | 2.14% | 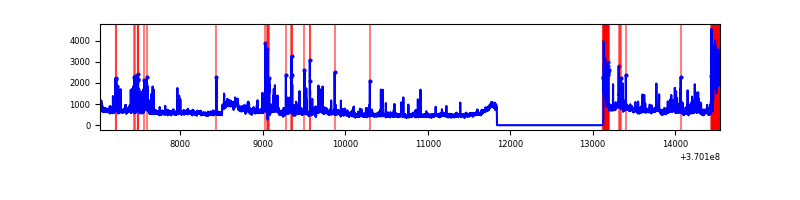 |
Top three noisy pixels from each quadrant. If the there are fewer than three noisy pixels in the level2.evt file, extra rows are filled as -1
| Pixel properties | Quadrant properties | ||||||
|---|---|---|---|---|---|---|---|
| Quadrant | DetID | PixID | Counts | Sigma | Mean | Median | Sigma |
| A | 13 | 254 | 11887 | 65.61 | 849 | 835 | 168.4 |
| A | 0 | 6 | 8755 | 47.02 | 849 | 835 | 168.4 |
| A | 0 | 226 | 7891 | 41.89 | 849 | 835 | 168.4 |
| B | 4 | 80 | 2110062 | 14912.97 | 782 | 766 | 141.4 |
| B | 6 | 159 | 1786731 | 12626.98 | 782 | 766 | 141.4 |
| B | 5 | 172 | 800527 | 5654.41 | 782 | 766 | 141.4 |
| C | 3 | 233 | 1045619 | 5596.17 | 817 | 824 | 186.7 |
| C | 14 | 238 | 150886 | 803.76 | 817 | 824 | 186.7 |
| C | 0 | 10 | 69514 | 367.92 | 817 | 824 | 186.7 |
| D | 8 | 195 | 575255 | 2986.68 | 825 | 805 | 192.3 |
| D | 12 | 233 | 360699 | 1871.16 | 825 | 805 | 192.3 |
| D | 13 | 249 | 206728 | 1070.63 | 825 | 805 | 192.3 |
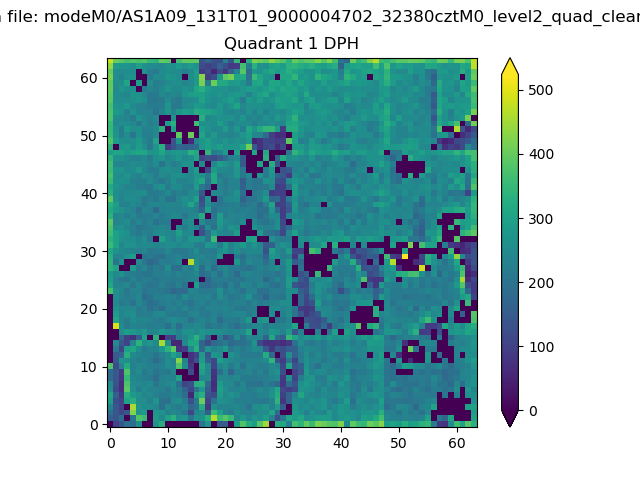
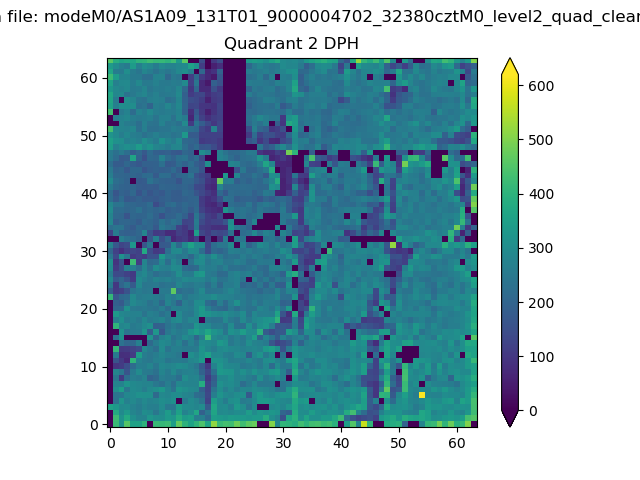
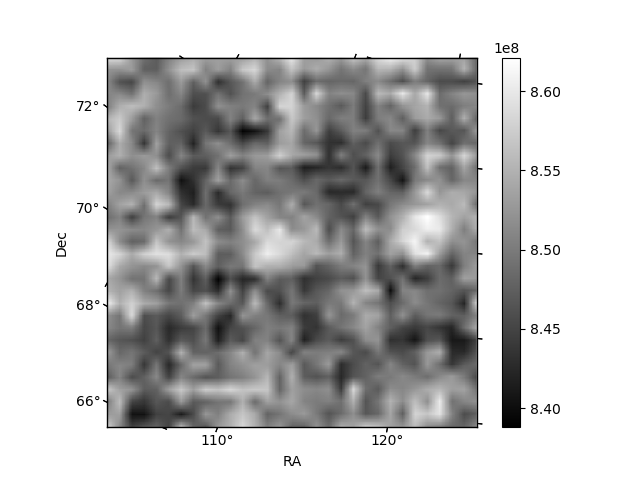
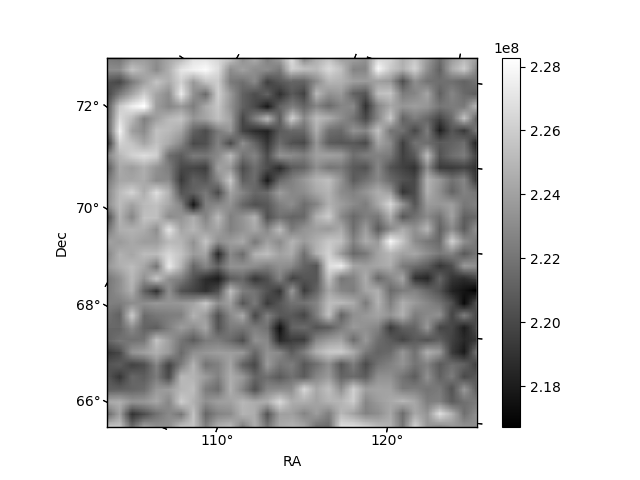
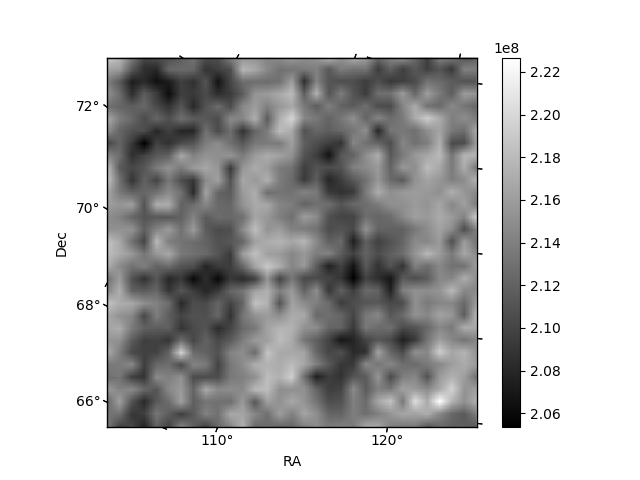
Histogram calculated using DETX and DETY for each event in the final _common_clean file
| Quadrant A | 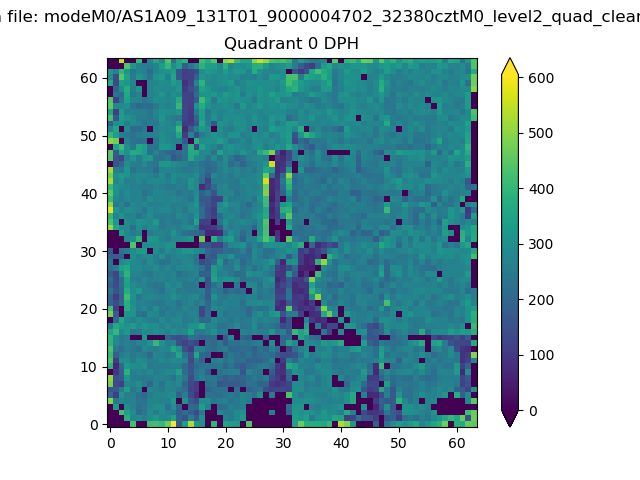 |
 |
Quadrant B |
|---|---|---|---|
| Quadrant D | 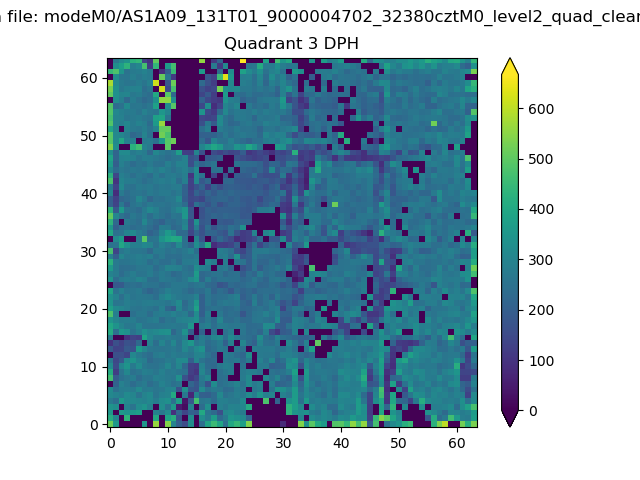 |
 |
Quadrant C |
| Plot type | Count rate plots | Images |
|---|---|---|
| Comparison with Poisson distribution Blue bars denote a histogram of data divided into 1 sec bins. Red curve is a Poisson curve with rate = median count rate of data. |
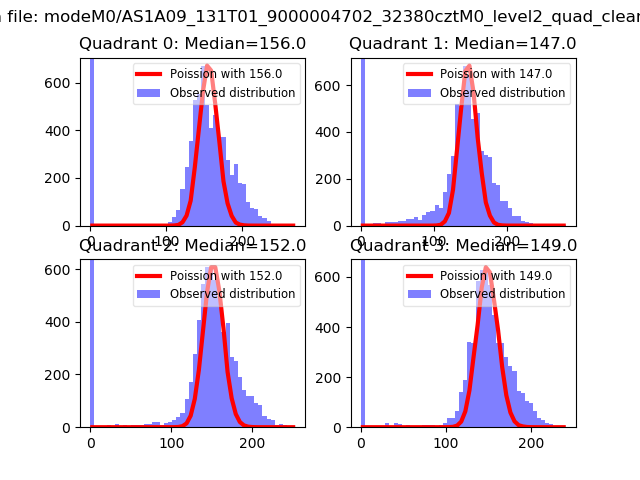 |
 |
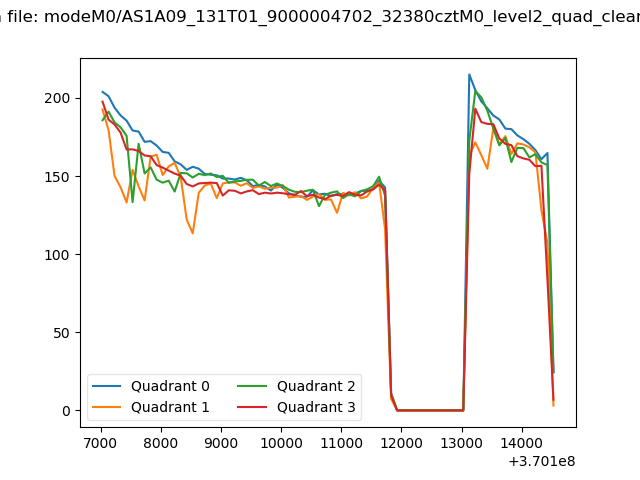
| Quadrant-wise count rates Data is divided into 100 sec bins |
 |
|
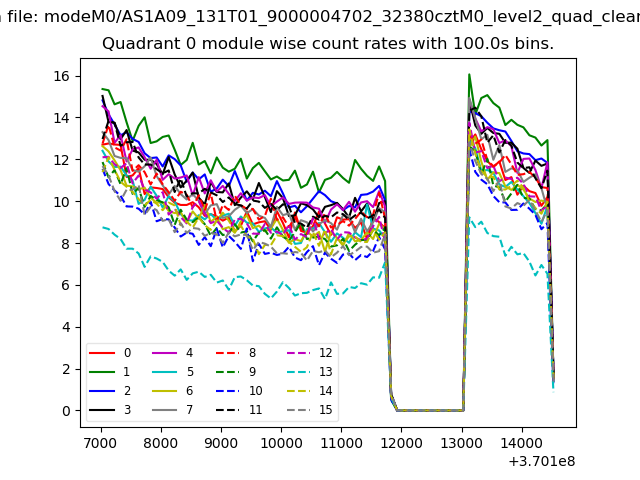
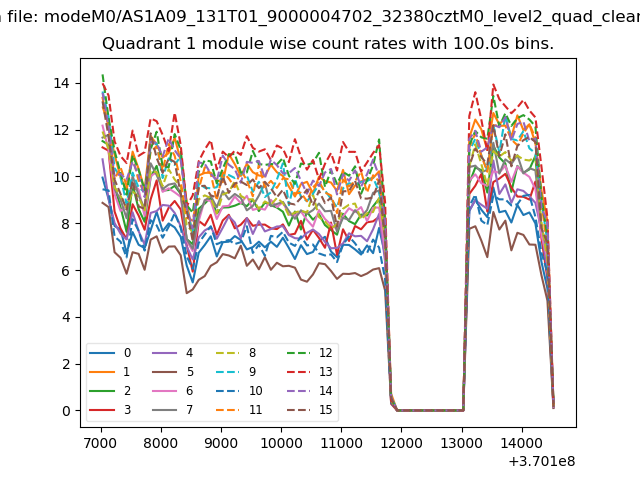
| Module-wise count rates for Quadrant A Data is divided into 100 sec bins |
 |
 |
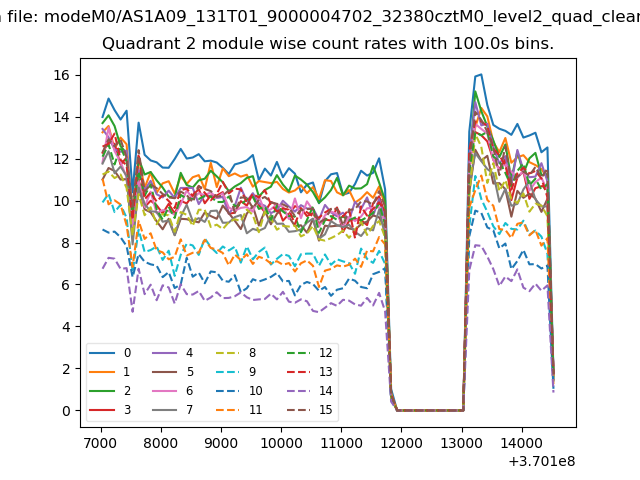
| Module-wise count rates for Quadrant B Data is divided into 100 sec bins |
 |
 |
| Module-wise count rates for Quadrant C Data is divided into 100 sec bins |
 |
 |
| Module-wise count rates for Quadrant D Data is divided into 100 sec bins |
 |
 |
| Parameter | Plot |
|---|---|
| CZT HV Monitor | 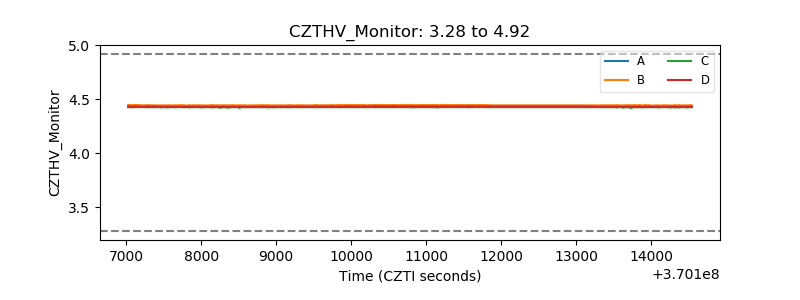 |
| D_VDD | 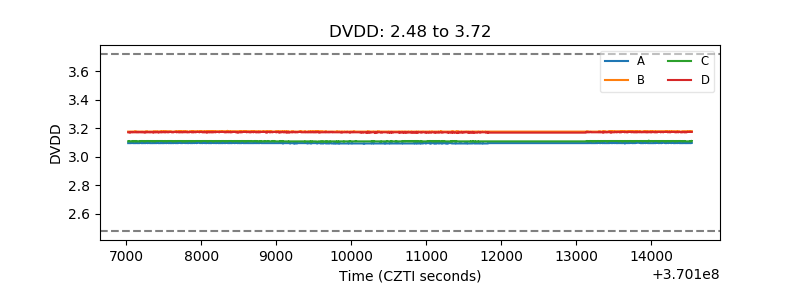 |
| Temperature 1 | 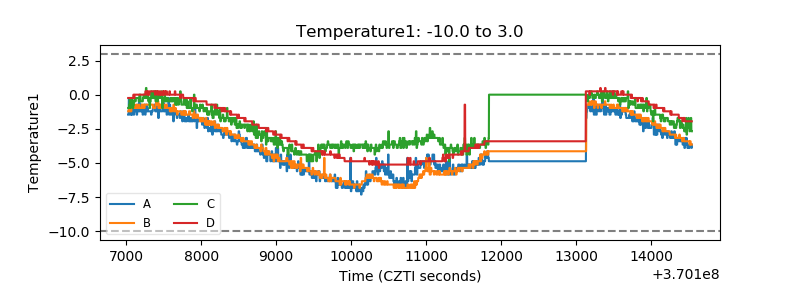 |
| Veto HV Monitor | 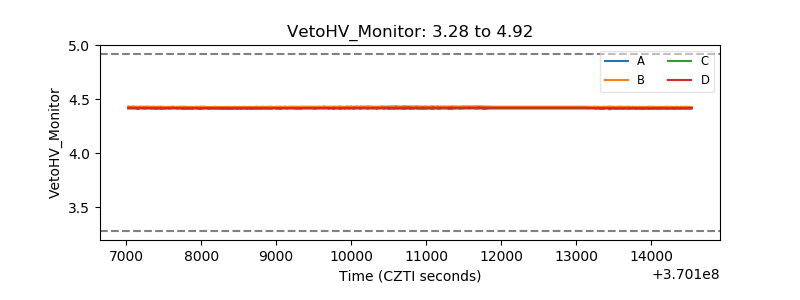 |
| Veto LLD | 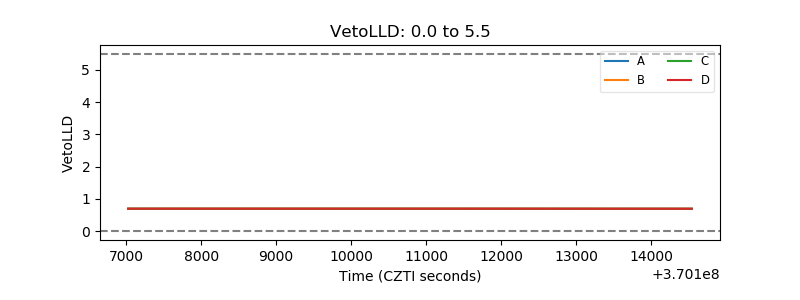 |
| Alpha Counter | 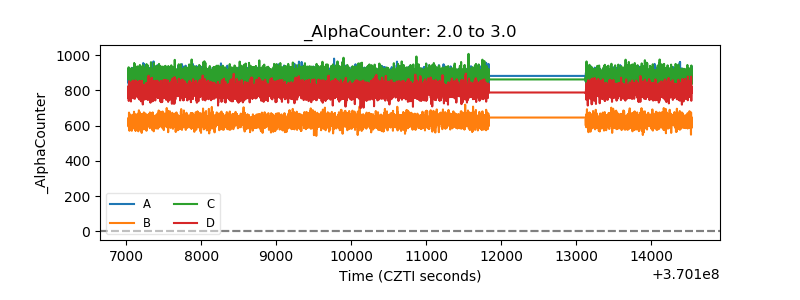 |
| _CPM_Rate | 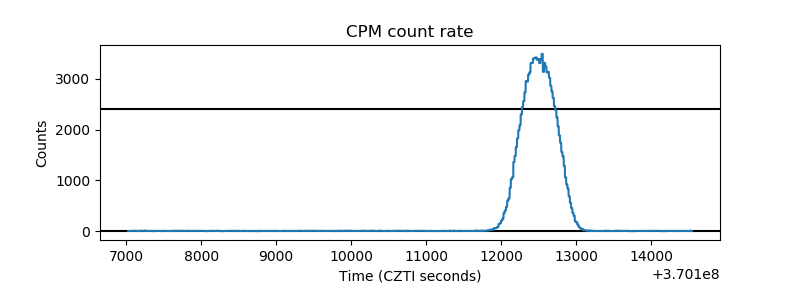 |
| CZT Counter | 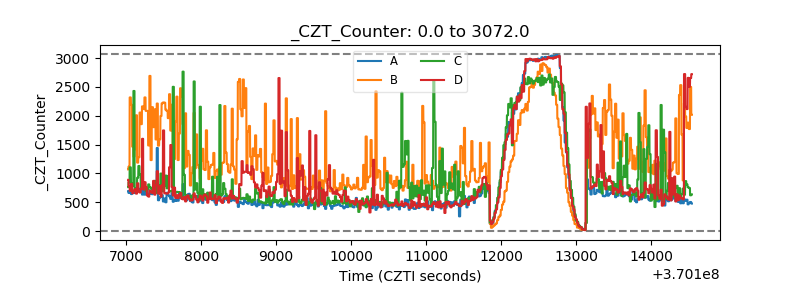 |
| +2.5 Volts monitor | 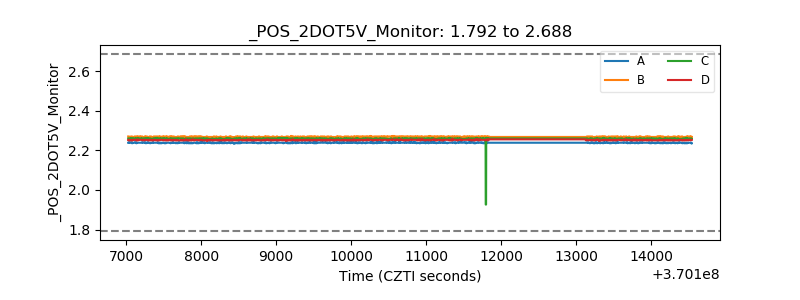 |
| +5 Volts monitor |  |
| _ROLL_ROT | 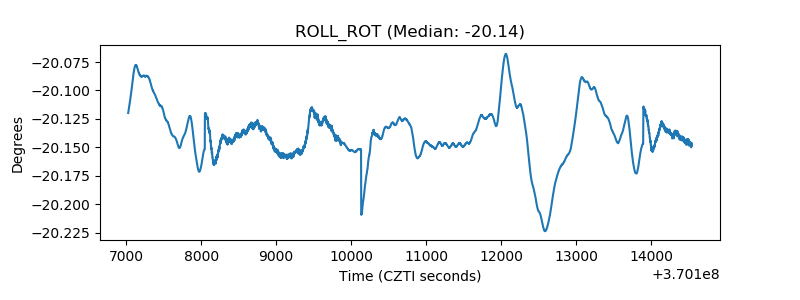 |
| _Roll_DEC | 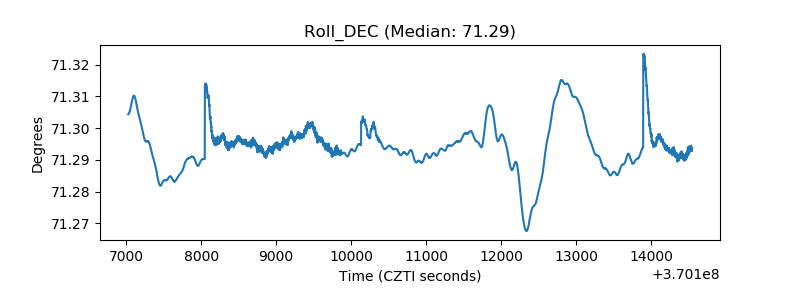 |
| _Roll_RA | 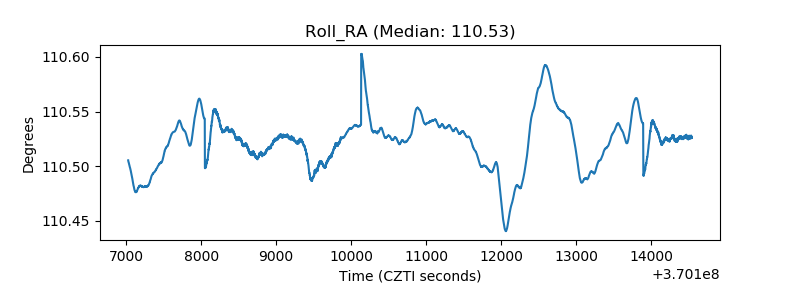 |
| Veto Counter | 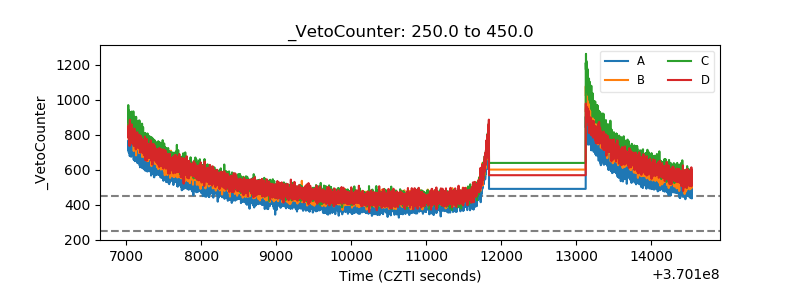 |