| Param | Original file | Final file |
|---|---|---|
| Filename | modeM0/AS1A09_131T01_9000004702_32381cztM0_level2.evt | modeM0/AS1A09_131T01_9000004702_32381cztM0_level2_quad_clean.evt |
| Size (bytes) | 677,880,000 | 129,231,360 |
| Size | 646.5 MB | 123.2 MB |
| Events in quadrant A | 3,073,212 | 933,842 |
| Events in quadrant B | 7,937,548 | 812,896 |
| Events in quadrant C | 4,047,850 | 907,179 |
| Events in quadrant D | 5,069,412 | 844,080 |
| Mode M0 | |||
|---|---|---|---|
| Quadrant | BADHDUFLAG | Total packets | Discarded packets |
| A | 0 | 12950 | 2 |
| B | 0 | 27713 | 1 |
| C | 0 | 16104 | 1 |
| D | 0 | 19158 | 1 |
| Mode SS | |||
|---|---|---|---|
| Quadrant | BADHDUFLAG | Total packets | Discarded packets |
| A | 0 | 120 | 0 |
| B | 0 | 120 | 0 |
| C | 0 | 120 | 0 |
| D | 0 | 120 | 0 |
| Mode M9 | |||
|---|---|---|---|
| Quadrant | BADHDUFLAG | Total packets | Discarded packets |
| A | 0 | 14 | 0 |
| B | 0 | 14 | 0 |
| C | 0 | 14 | 0 |
| D | 0 | 14 | 0 |
| Quadrant | Total seconds | Saturated seconds | Saturation percentage |
|---|---|---|---|
| A | 5945 | 57 | 0.958789% |
| B | 5945 | 1641 | 27.603028% |
| C | 5945 | 473 | 7.956266% |
| D | 5945 | 707 | 11.892347% |
Noise dominated data is calculated using 1-second bins in cleaned event files. If a bin has >2000 counts, and if more than 50% of those come from <1% of pixels, then it is considered to be noise-dominated and hence unusable.
| Quadrant | # 1 sec bins | Bins with >0 counts | Bins with >2000 counts | High rate bins dominated by noise | Noise dominated (total time) | Noise dominated (detector-on time) | Marked lightcurve |
|---|---|---|---|---|---|---|---|
| A | 7300 | 5946 | 0 | 0 | 0.00% | 0.00% | 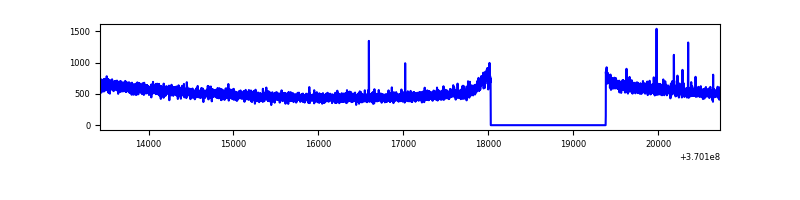 |
| B | 7300 | 5945 | 1059 | 1059 | 14.51% | 17.81% | 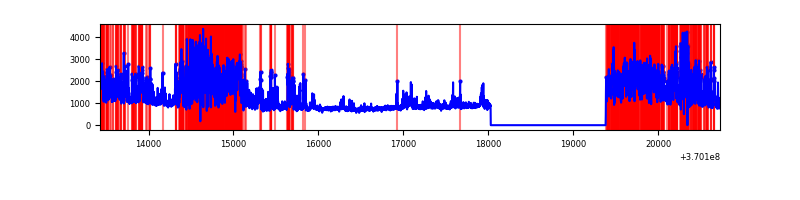 |
| C | 7300 | 5946 | 93 | 93 | 1.27% | 1.56% | 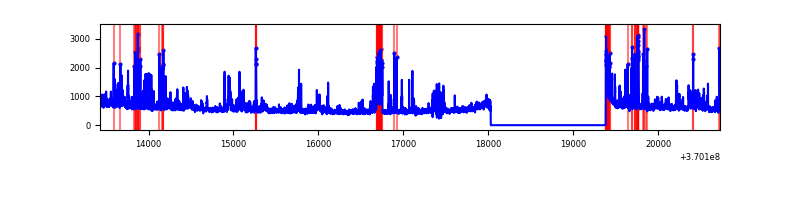 |
| D | 7300 | 5946 | 592 | 592 | 8.11% | 9.96% | 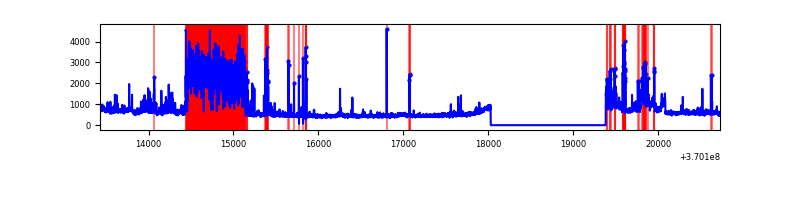 |
Top three noisy pixels from each quadrant. If the there are fewer than three noisy pixels in the level2.evt file, extra rows are filled as -1
| Pixel properties | Quadrant properties | ||||||
|---|---|---|---|---|---|---|---|
| Quadrant | DetID | PixID | Counts | Sigma | Mean | Median | Sigma |
| A | 13 | 254 | 11210 | 67.49 | 790 | 776 | 154.6 |
| A | 13 | 6 | 8989 | 53.13 | 790 | 776 | 154.6 |
| A | 12 | 96 | 8579 | 50.47 | 790 | 776 | 154.6 |
| B | 4 | 80 | 2290023 | 17816.2 | 701 | 684 | 128.5 |
| B | 6 | 159 | 1706178 | 13272.58 | 701 | 684 | 128.5 |
| B | 5 | 172 | 1049736 | 8163.98 | 701 | 684 | 128.5 |
| C | 3 | 233 | 695858 | 3988.89 | 763 | 770 | 174.3 |
| C | 14 | 238 | 181759 | 1038.64 | 763 | 770 | 174.3 |
| C | 14 | 254 | 77700 | 441.48 | 763 | 770 | 174.3 |
| D | 12 | 233 | 1532359 | 8824.61 | 742 | 724 | 173.6 |
| D | 8 | 195 | 363554 | 2090.47 | 742 | 724 | 173.6 |
| D | 1 | 47 | 87913 | 502.34 | 742 | 724 | 173.6 |
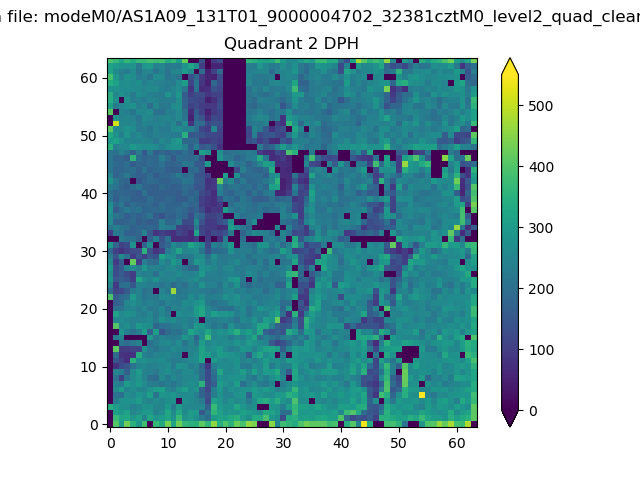
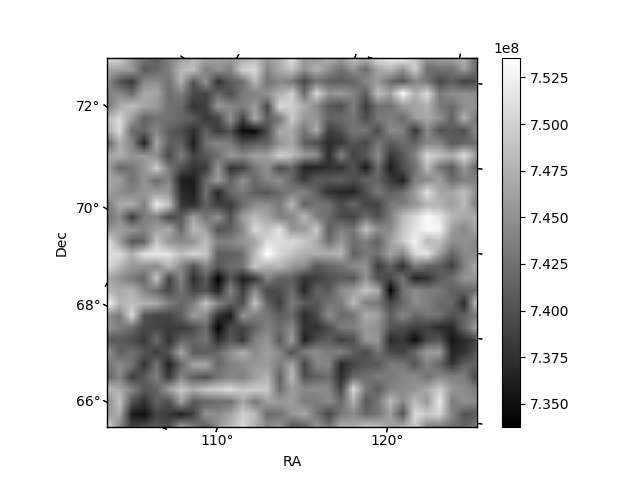
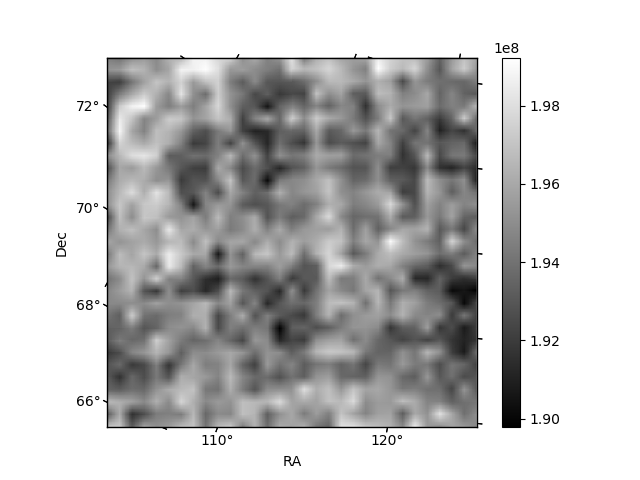
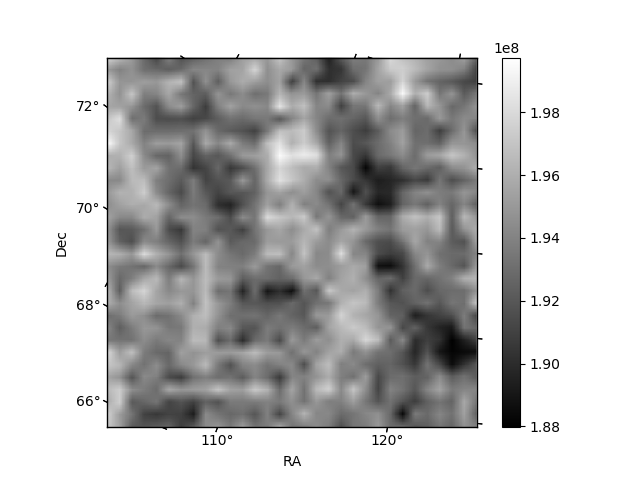
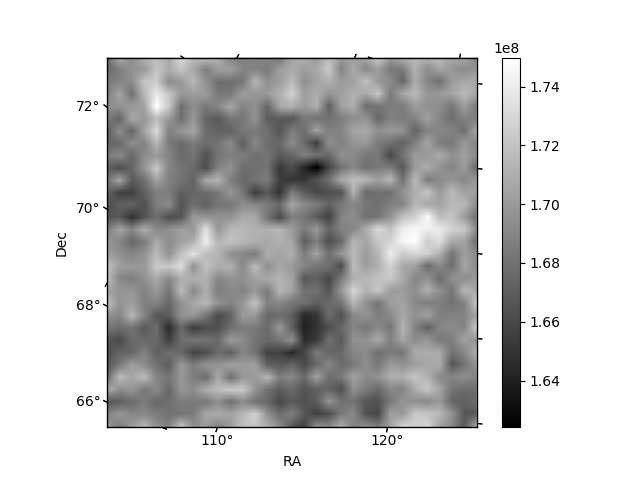
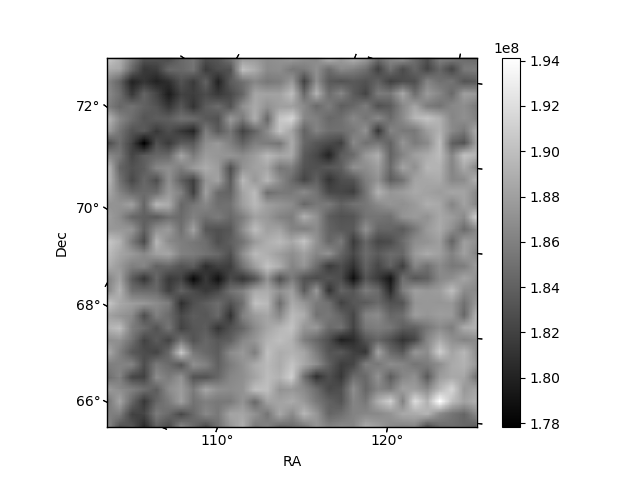
Histogram calculated using DETX and DETY for each event in the final _common_clean file
| Quadrant A | 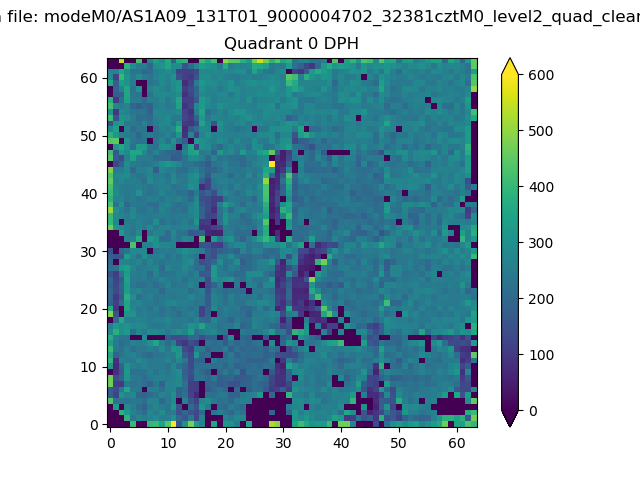 |
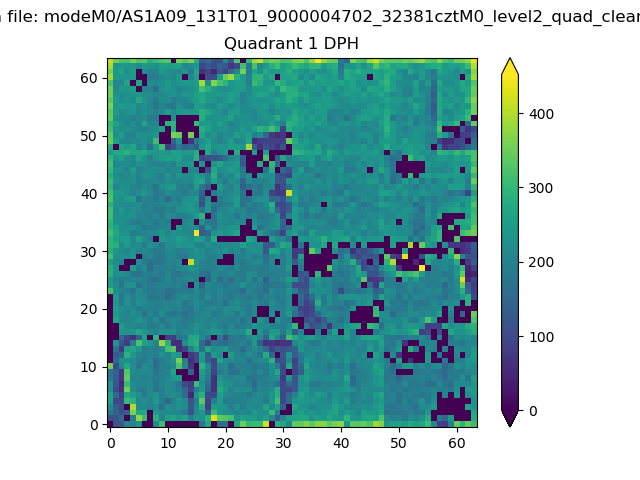 |
Quadrant B |
|---|---|---|---|
| Quadrant D | 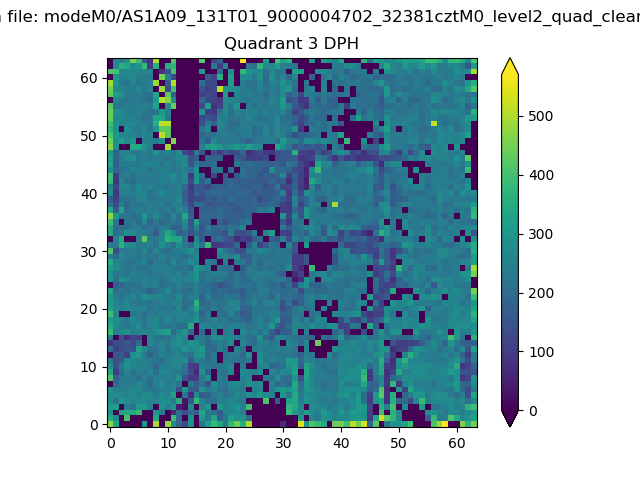 |
 |
Quadrant C |
| Plot type | Count rate plots | Images |
|---|---|---|
| Comparison with Poisson distribution Blue bars denote a histogram of data divided into 1 sec bins. Red curve is a Poisson curve with rate = median count rate of data. |
 |
 |
| Quadrant-wise count rates Data is divided into 100 sec bins |
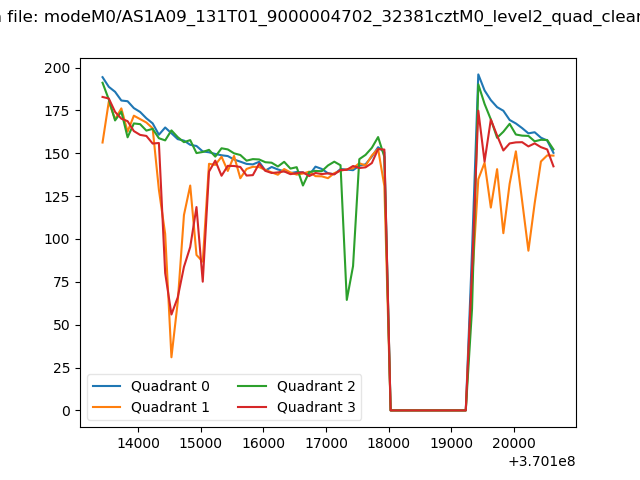 |
|
| Module-wise count rates for Quadrant A Data is divided into 100 sec bins |
 |
 |
| Module-wise count rates for Quadrant B Data is divided into 100 sec bins |
 |
 |
| Module-wise count rates for Quadrant C Data is divided into 100 sec bins |
 |
 |
| Module-wise count rates for Quadrant D Data is divided into 100 sec bins |
 |
 |
| Parameter | Plot |
|---|---|
| CZT HV Monitor |  |
| D_VDD | 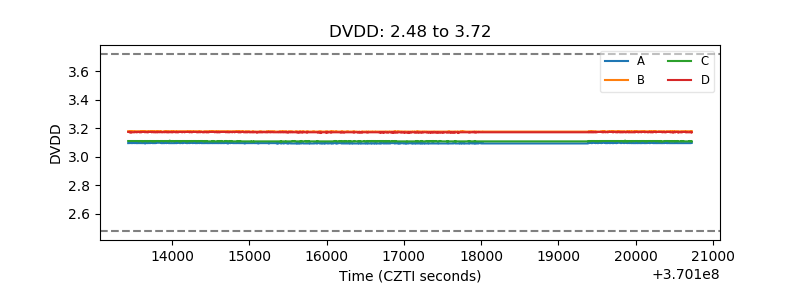 |
| Temperature 1 | 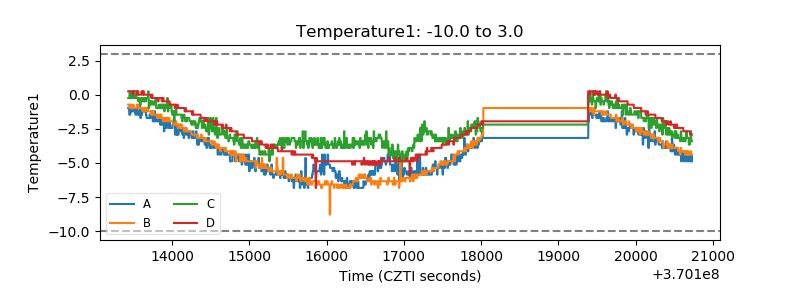 |
| Veto HV Monitor | 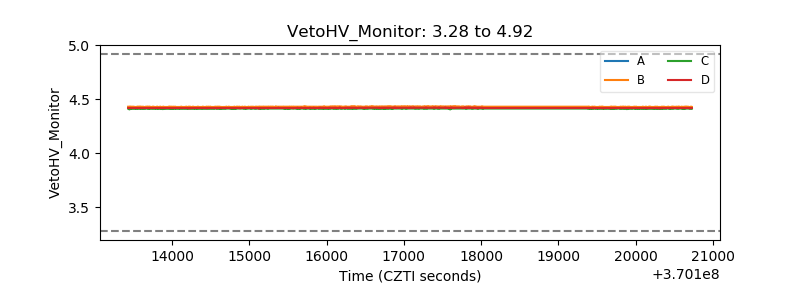 |
| Veto LLD | 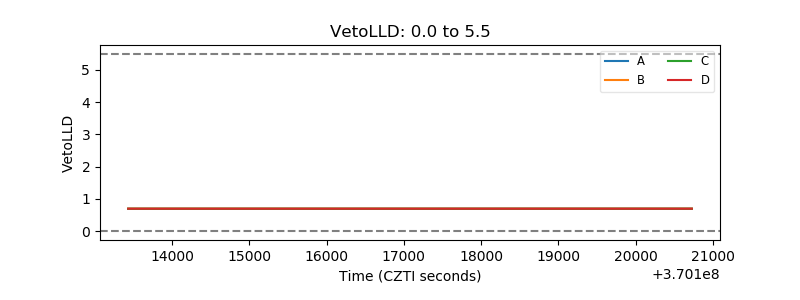 |
| Alpha Counter | 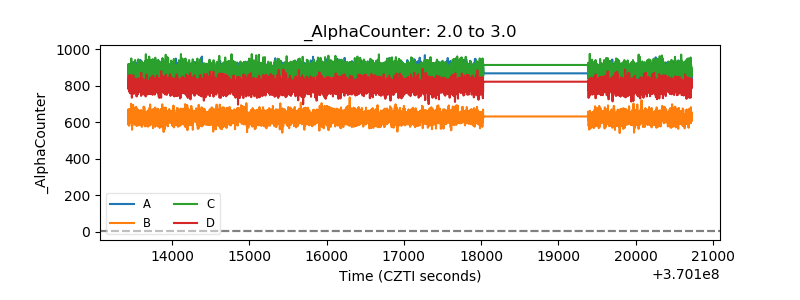 |
| _CPM_Rate | 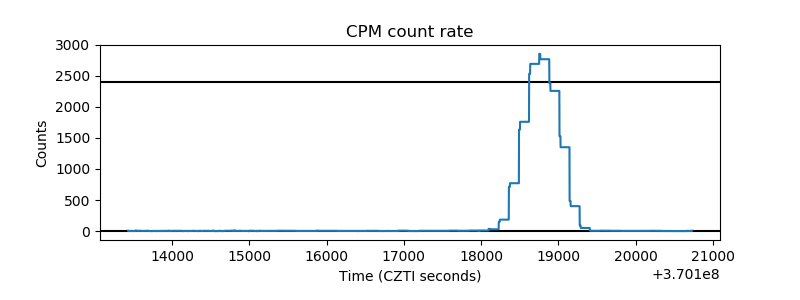 |
| CZT Counter | 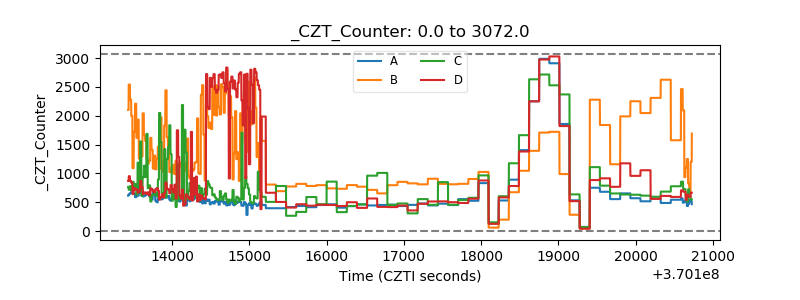 |
| +2.5 Volts monitor |  |
| +5 Volts monitor |  |
| _ROLL_ROT |  |
| _Roll_DEC | 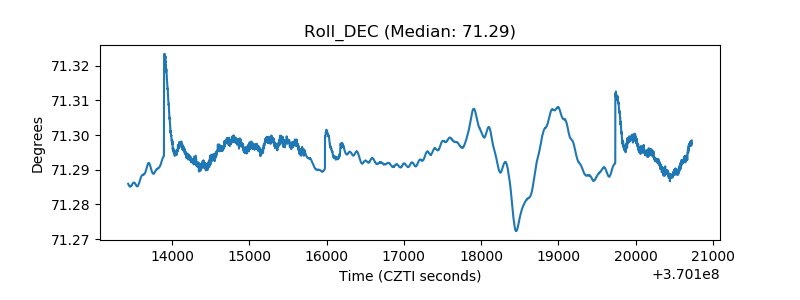 |
| _Roll_RA | 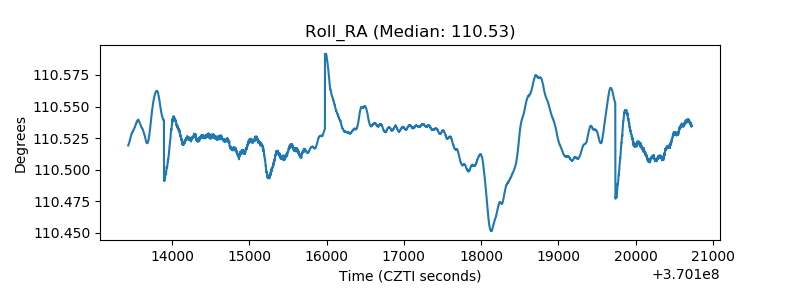 |
| Veto Counter | 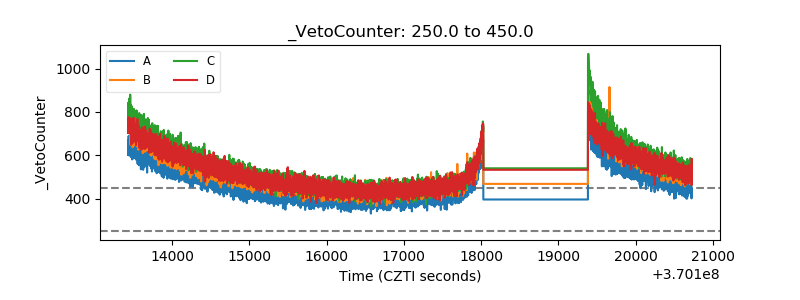 |