| Param | Original file | Final file |
|---|---|---|
| Filename | modeM0/AS1T04_059T01_9000004704cztM0_level2.fits | modeM0/AS1T04_059T01_9000004704cztM0_level2_quad_clean.evt |
| Size (bytes) | 1,831,366,080 | 1,435,988,160 |
| Size | 1.7 GB | 1.3 GB |
| Events in quadrant A | 12,234,722 | 9,202,584 |
| Events in quadrant B | 10,356,516 | 6,819,983 |
| Events in quadrant C | 9,178,322 | 6,104,749 |
| Events in quadrant D | 10,070,762 | 7,785,126 |
| Mode M0 | |||
|---|---|---|---|
| Quadrant | BADHDUFLAG | Total packets | Discarded packets |
| A | 0 | 417300 | 0 |
| B | 0 | 895802 | 0 |
| C | 0 | 801652 | 0 |
| D | 0 | 563018 | 0 |
| Mode M9 | |||
|---|---|---|---|
| Quadrant | BADHDUFLAG | Total packets | Discarded packets |
| A | 0 | 317 | 0 |
| B | 0 | 317 | 0 |
| C | 0 | 317 | 0 |
| D | 0 | 317 | 0 |
| Mode SS | |||
|---|---|---|---|
| Quadrant | BADHDUFLAG | Total packets | Discarded packets |
| A | 0 | 4042 | 0 |
| B | 0 | 4042 | 0 |
| C | 0 | 4042 | 0 |
| D | 0 | 4042 | 0 |
| Quadrant | Total seconds | Saturated seconds | Saturation percentage |
|---|---|---|---|
| A | 198079 | 2548 | 1.286355% |
| B | 198063 | 48201 | 24.336196% |
| C | 198061 | 60254 | 30.421941% |
| D | 198068 | 10103 | 5.100773% |
Noise dominated data is calculated using 1-second bins in cleaned event files. If a bin has >2000 counts, and if more than 50% of those come from <1% of pixels, then it is considered to be noise-dominated and hence unusable.
| Quadrant | # 1 sec bins | Bins with >0 counts | Bins with >2000 counts | High rate bins dominated by noise | Noise dominated (total time) | Noise dominated (detector-on time) | Marked lightcurve |
|---|---|---|---|---|---|---|---|
| A | 248136 | 198094 | 0 | 0 | 0.00% | 0.00% |  |
| B | 248136 | 197983 | 0 | 0 | 0.00% | 0.00% |  |
| C | 248136 | 192815 | 0 | 0 | 0.00% | 0.00% | 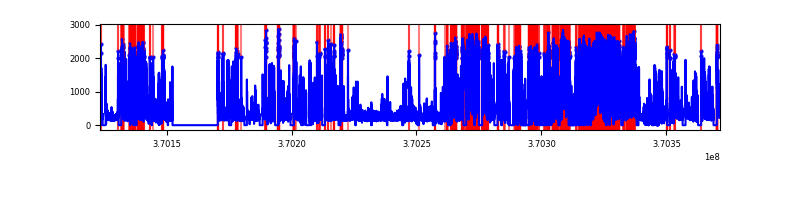 |
| D | 248136 | 197981 | 0 | 0 | 0.00% | 0.00% | 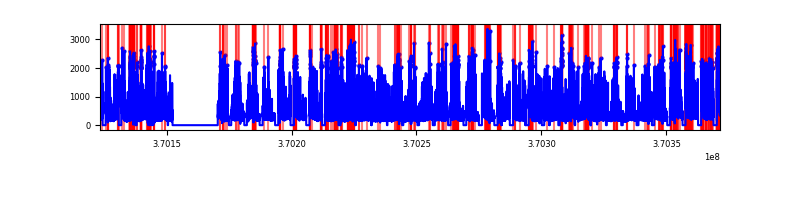 |
Top three noisy pixels from each quadrant. If the there are fewer than three noisy pixels in the level2.evt file, extra rows are filled as -1
| Pixel properties | Quadrant properties | ||||||
|---|---|---|---|---|---|---|---|
| Quadrant | DetID | PixID | Counts | Sigma | Mean | Median | Sigma |
| A | 0 | 29 | 12014 | 11.66 | 3188 | 3000 | 773.3 |
| A | 7 | 110 | 9610 | 8.55 | 3188 | 3000 | 773.3 |
| A | 0 | 30 | 9396 | 8.27 | 3188 | 3000 | 773.3 |
| B | 2 | 9 | 8355 | 10.74 | 2744 | 2631 | 532.9 |
| B | 2 | 8 | 6974 | 8.15 | 2744 | 2631 | 532.9 |
| B | 3 | 80 | 6959 | 8.12 | 2744 | 2631 | 532.9 |
| C | 12 | 241 | 6407 | 6.78 | 2433 | 2279 | 608.8 |
| C | 9 | 209 | 6171 | 6.39 | 2433 | 2279 | 608.8 |
| C | 9 | 242 | 6133 | 6.33 | 2433 | 2279 | 608.8 |
| D | 10 | 189 | 7279 | 6.09 | 2886 | 2628 | 763.6 |
| D | 6 | 231 | 7244 | 6.04 | 2886 | 2628 | 763.6 |
| D | 3 | 14 | 7196 | 5.98 | 2886 | 2628 | 763.6 |
Histogram calculated using DETX and DETY for each event in the final _common_clean file
| Quadrant A | 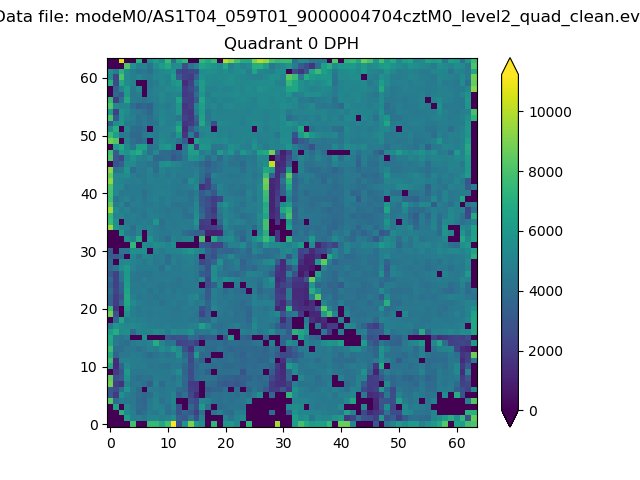 |
 |
Quadrant B |
|---|---|---|---|
| Quadrant D | 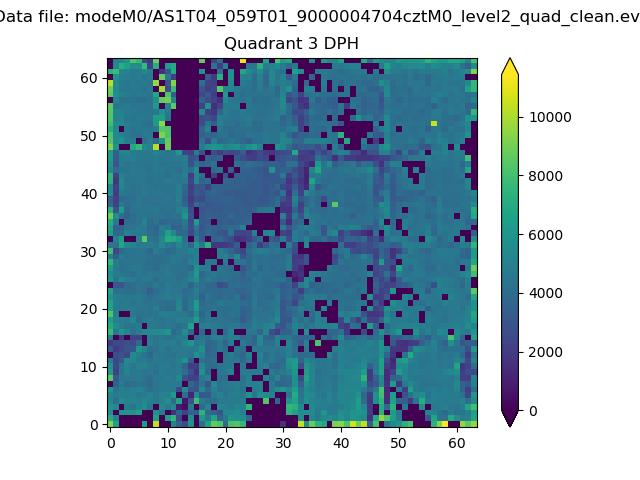 |
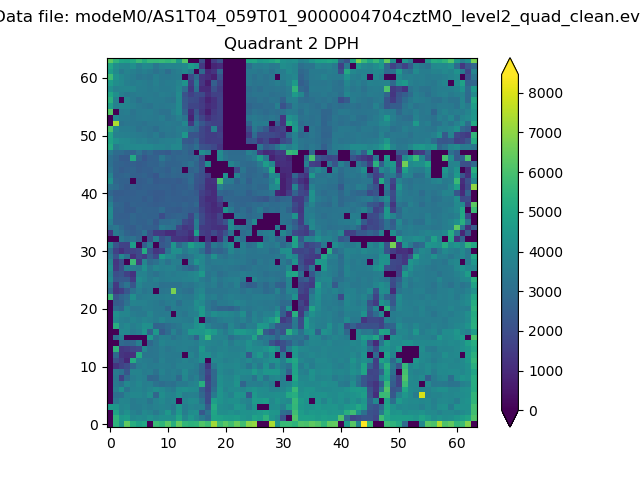 |
Quadrant C |
| Plot type | Count rate plots | Images |
|---|---|---|
| Comparison with Poisson distribution Blue bars denote a histogram of data divided into 1 sec bins. Red curve is a Poisson curve with rate = median count rate of data. |
 |
 |
| Quadrant-wise count rates Data is divided into 100 sec bins |
 |
|
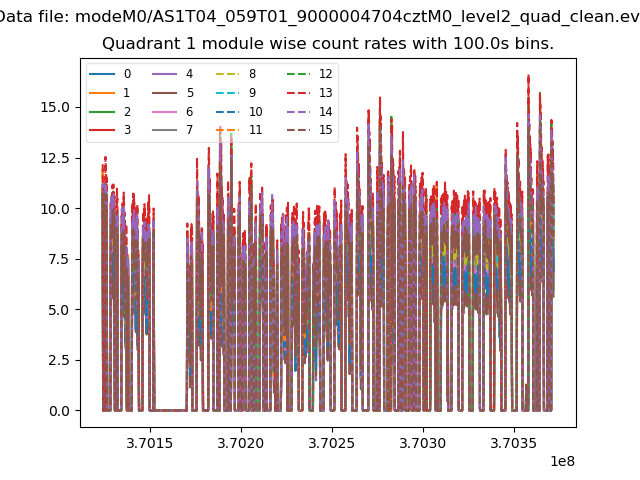
| Module-wise count rates for Quadrant A Data is divided into 100 sec bins |
 |
 |
| Module-wise count rates for Quadrant B Data is divided into 100 sec bins |
 |
 |
| Module-wise count rates for Quadrant C Data is divided into 100 sec bins |
 |
 |
| Module-wise count rates for Quadrant D Data is divided into 100 sec bins |
 |
 |
| Parameter | Plot |
|---|---|
| CZT HV Monitor |  |
| D_VDD | 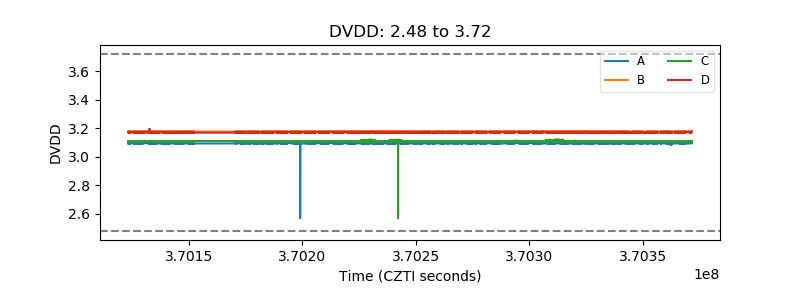 |
| Temperature 1 |  |
| Veto HV Monitor |  |
| Veto LLD | 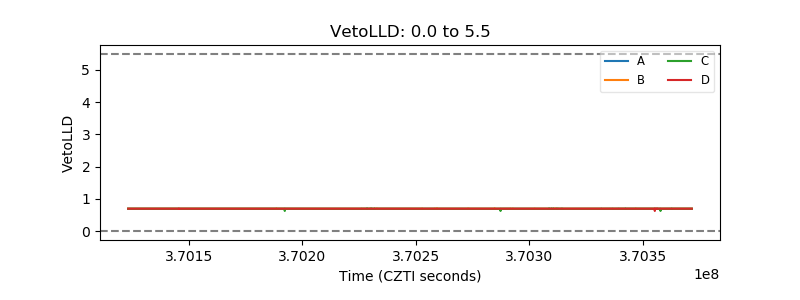 |
| Alpha Counter |  |
| _CPM_Rate |  |
| CZT Counter |  |
| +2.5 Volts monitor |  |
| +5 Volts monitor |  |
| _ROLL_ROT |  |
| _Roll_DEC |  |
| _Roll_RA |  |
| Veto Counter |  |