| Param | Original file | Final file |
|---|---|---|
| Filename | modeM0/AS1T04_059T01_9000004704_32382cztM0_level2.evt | modeM0/AS1T04_059T01_9000004704_32382cztM0_level2_quad_clean.evt |
| Size (bytes) | 260,133,120 | 42,117,120 |
| Size | 248.1 MB | 40.2 MB |
| Events in quadrant A | 1,291,151 | 286,958 |
| Events in quadrant B | 2,732,544 | 277,095 |
| Events in quadrant C | 1,578,014 | 269,488 |
| Events in quadrant D | 2,111,322 | 267,760 |
| Mode M0 | |||
|---|---|---|---|
| Quadrant | BADHDUFLAG | Total packets | Discarded packets |
| A | 0 | 5301 | 2 |
| B | 0 | 9787 | 1 |
| C | 0 | 6311 | 1 |
| D | 0 | 7904 | 1 |
| Mode M9 | |||
|---|---|---|---|
| Quadrant | BADHDUFLAG | Total packets | Discarded packets |
| A | 0 | 12 | 0 |
| B | 0 | 12 | 0 |
| C | 0 | 12 | 0 |
| D | 0 | 12 | 0 |
| Mode SS | |||
|---|---|---|---|
| Quadrant | BADHDUFLAG | Total packets | Discarded packets |
| A | 0 | 52 | 0 |
| B | 0 | 52 | 0 |
| C | 0 | 52 | 0 |
| D | 0 | 52 | 0 |
| Quadrant | Total seconds | Saturated seconds | Saturation percentage |
|---|---|---|---|
| A | 2405 | 26 | 1.081081% |
| B | 2405 | 332 | 13.804574% |
| C | 2405 | 209 | 8.690229% |
| D | 2405 | 131 | 5.446985% |
Noise dominated data is calculated using 1-second bins in cleaned event files. If a bin has >2000 counts, and if more than 50% of those come from <1% of pixels, then it is considered to be noise-dominated and hence unusable.
| Quadrant | # 1 sec bins | Bins with >0 counts | Bins with >2000 counts | High rate bins dominated by noise | Noise dominated (total time) | Noise dominated (detector-on time) | Marked lightcurve |
|---|---|---|---|---|---|---|---|
| A | 3645 | 2406 | 0 | 0 | 0.00% | 0.00% | 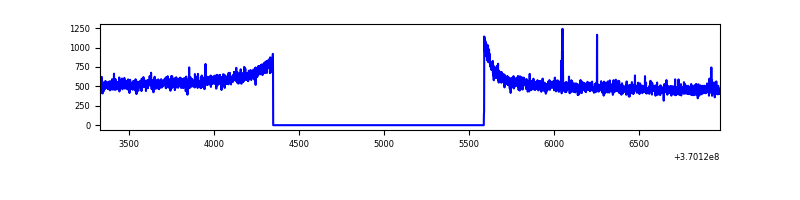 |
| B | 3645 | 2406 | 136 | 136 | 3.73% | 5.65% | 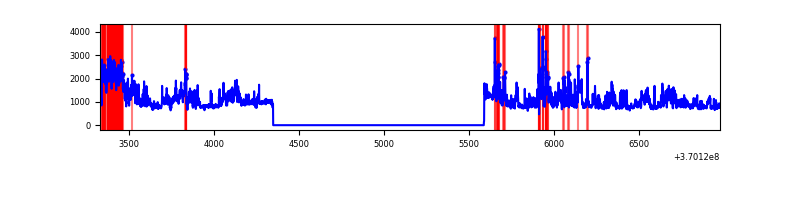 |
| C | 3645 | 2406 | 45 | 45 | 1.23% | 1.87% | 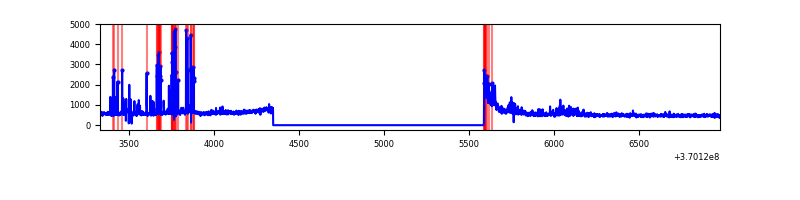 |
| D | 3645 | 2406 | 50 | 50 | 1.37% | 2.08% | 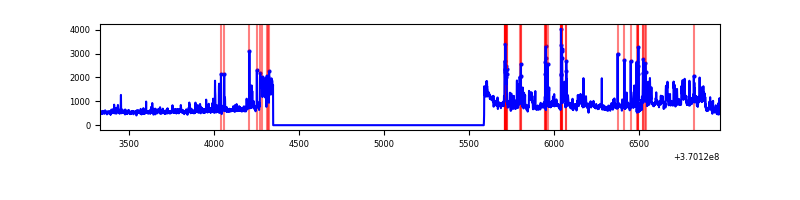 |
Top three noisy pixels from each quadrant. If the there are fewer than three noisy pixels in the level2.evt file, extra rows are filled as -1
| Pixel properties | Quadrant properties | ||||||
|---|---|---|---|---|---|---|---|
| Quadrant | DetID | PixID | Counts | Sigma | Mean | Median | Sigma |
| A | 13 | 254 | 4582 | 62.33 | 332 | 326 | 68.3 |
| A | 12 | 96 | 4525 | 61.49 | 332 | 326 | 68.3 |
| A | 13 | 6 | 3736 | 49.94 | 332 | 326 | 68.3 |
| B | 4 | 80 | 711556 | 11615.73 | 317 | 310 | 61.2 |
| B | 6 | 159 | 614359 | 10028.35 | 317 | 310 | 61.2 |
| B | 5 | 172 | 97310 | 1584.16 | 317 | 310 | 61.2 |
| C | 3 | 233 | 214518 | 2965.89 | 304 | 306 | 72.2 |
| C | 14 | 238 | 72510 | 999.71 | 304 | 306 | 72.2 |
| C | 0 | 10 | 53574 | 737.53 | 304 | 306 | 72.2 |
| D | 8 | 195 | 441685 | 5773.86 | 316 | 308 | 76.4 |
| D | 14 | 52 | 115969 | 1513.01 | 316 | 308 | 76.4 |
| D | 15 | 0 | 110324 | 1439.17 | 316 | 308 | 76.4 |
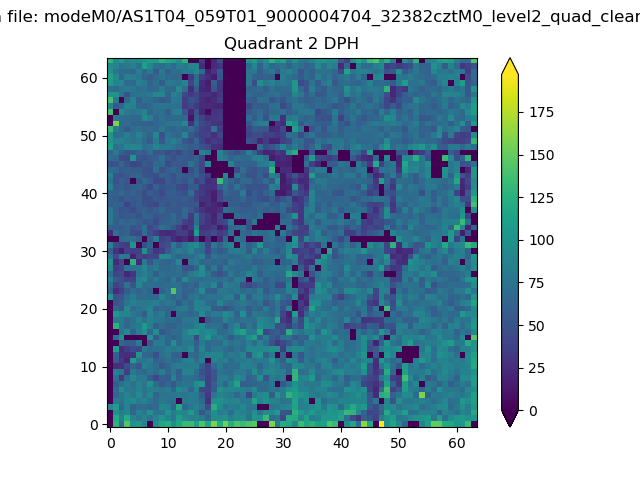
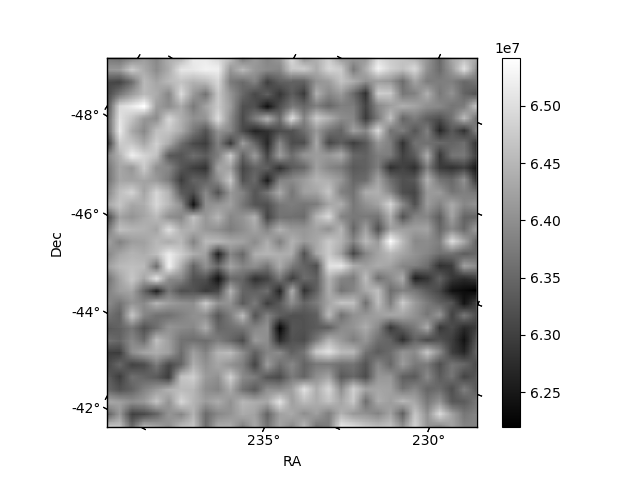
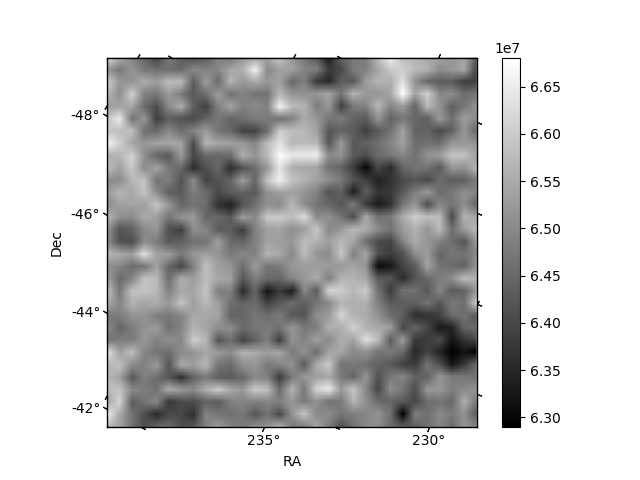
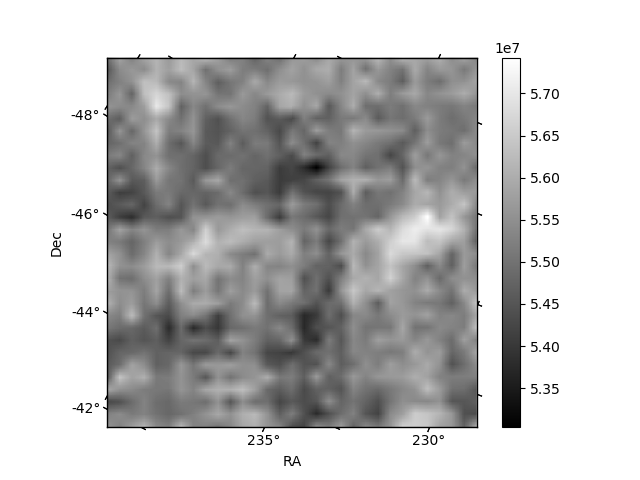
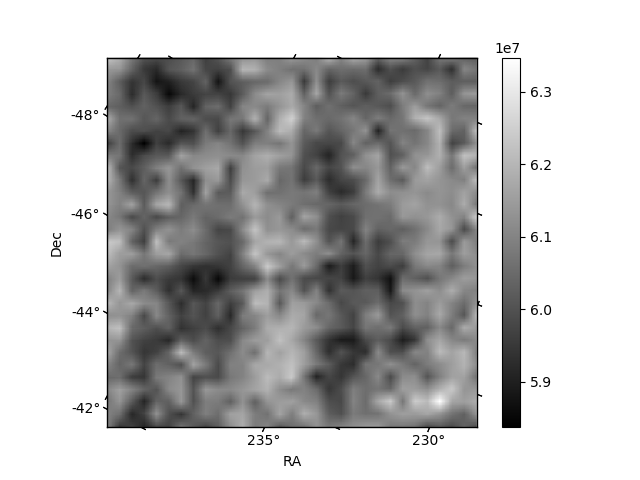
Histogram calculated using DETX and DETY for each event in the final _common_clean file
| Quadrant A | 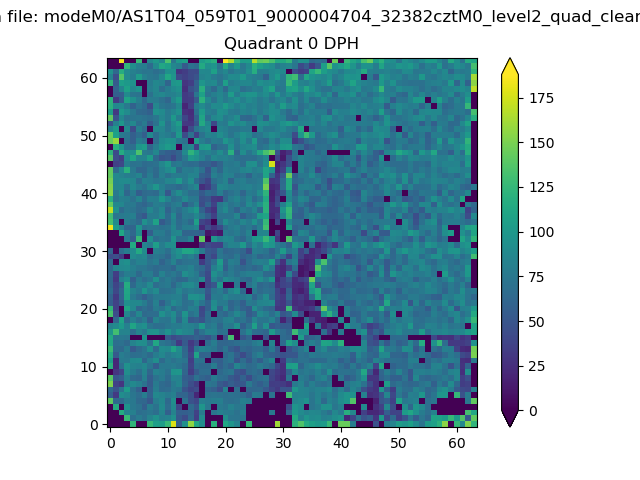 |
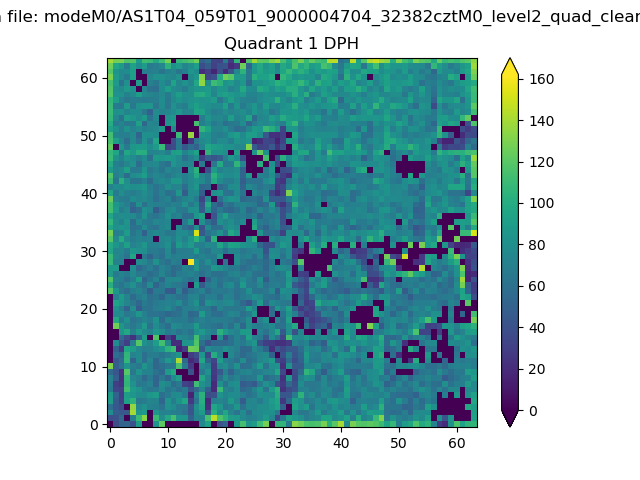 |
Quadrant B |
|---|---|---|---|
| Quadrant D | 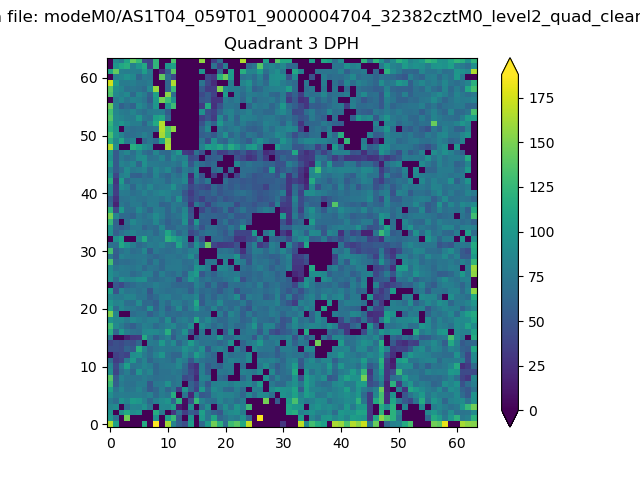 |
 |
Quadrant C |
| Plot type | Count rate plots | Images |
|---|---|---|
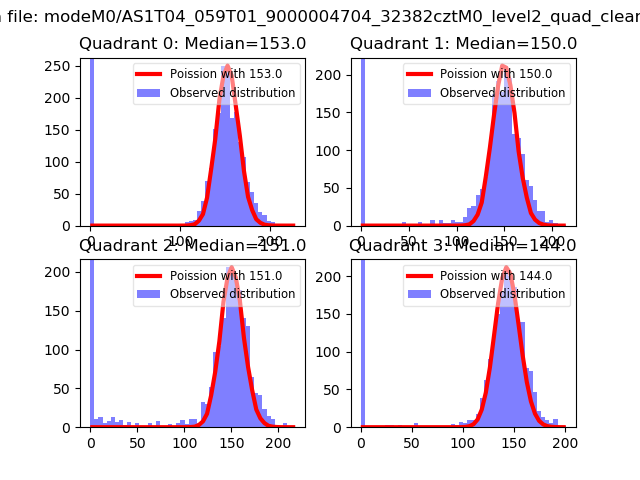
| Comparison with Poisson distribution Blue bars denote a histogram of data divided into 1 sec bins. Red curve is a Poisson curve with rate = median count rate of data. |
 |
 |
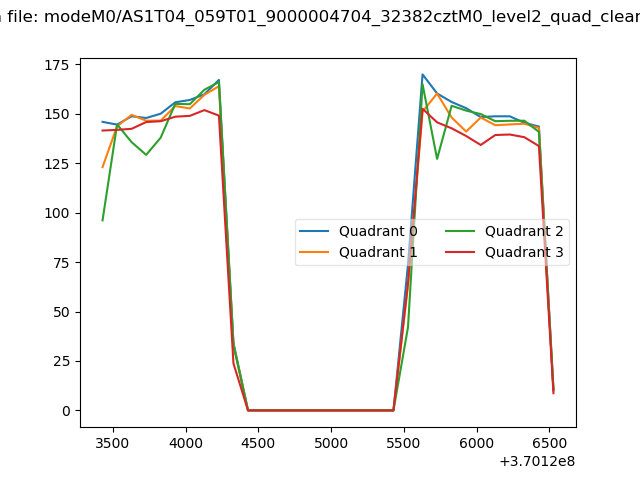
| Quadrant-wise count rates Data is divided into 100 sec bins |
 |
|
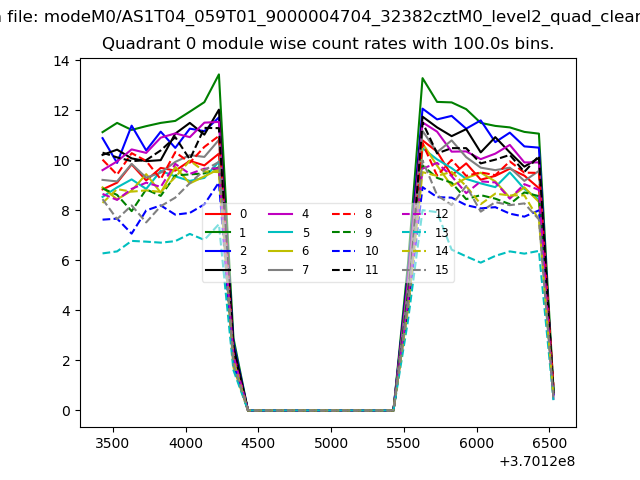
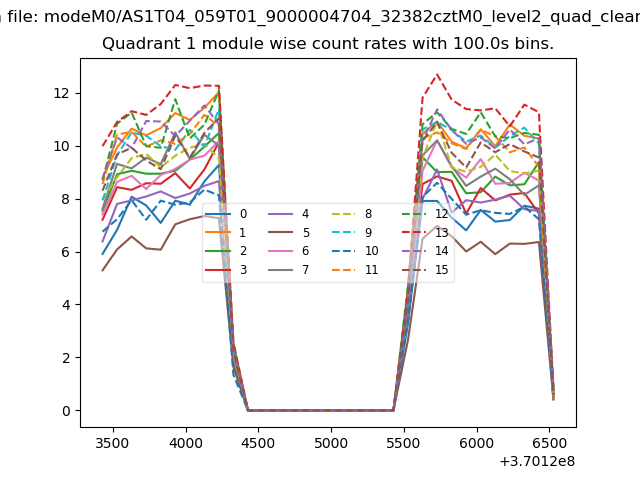
| Module-wise count rates for Quadrant A Data is divided into 100 sec bins |
 |
 |
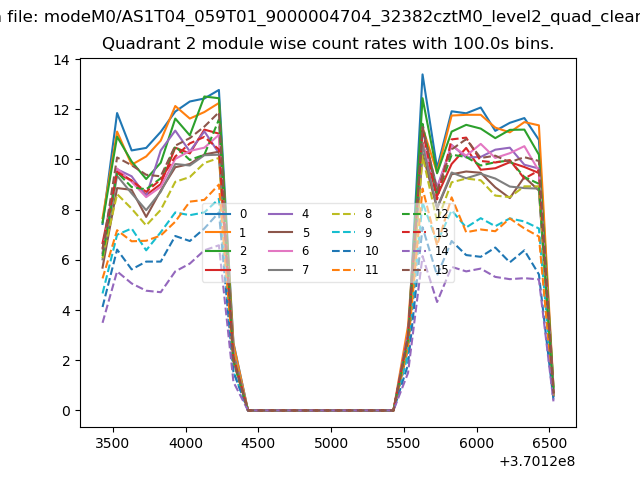
| Module-wise count rates for Quadrant B Data is divided into 100 sec bins |
 |
 |
| Module-wise count rates for Quadrant C Data is divided into 100 sec bins |
 |
 |
| Module-wise count rates for Quadrant D Data is divided into 100 sec bins |
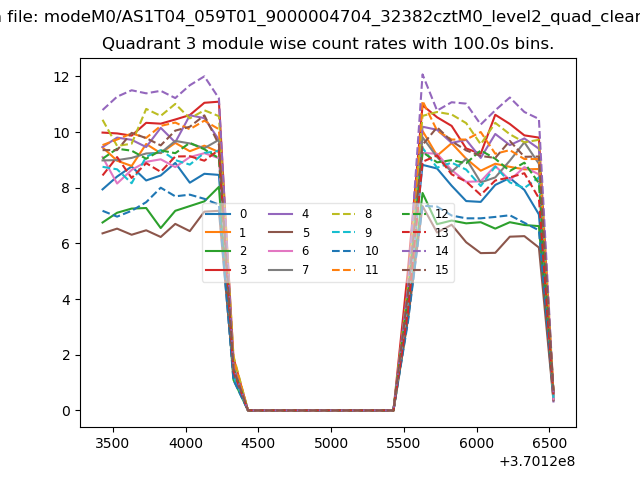 |
 |
| Parameter | Plot |
|---|---|
| CZT HV Monitor | 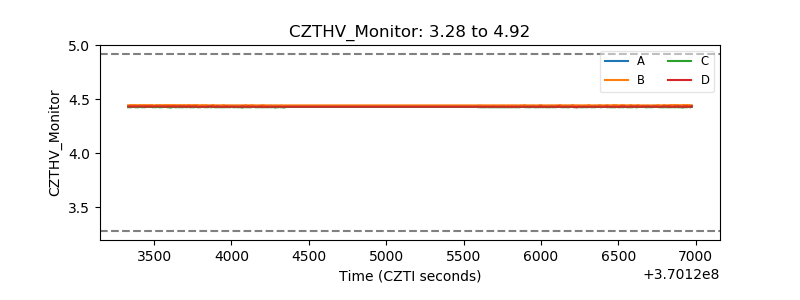 |
| D_VDD | 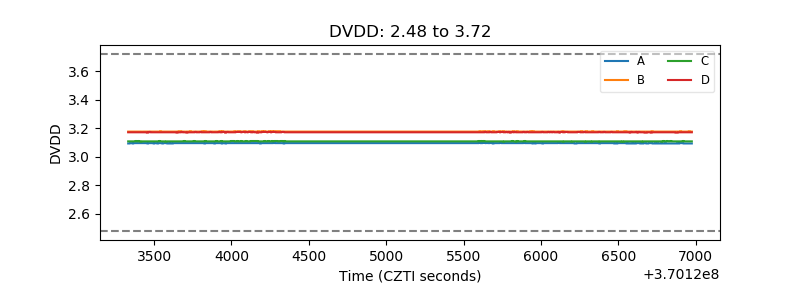 |
| Temperature 1 | 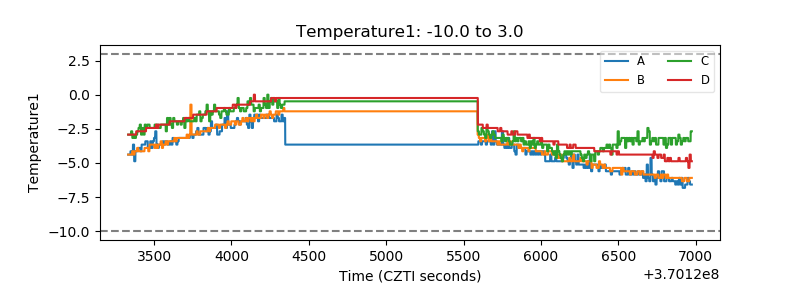 |
| Veto HV Monitor |  |
| Veto LLD | 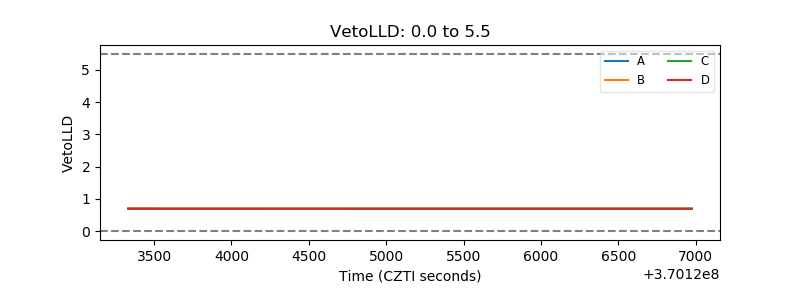 |
| Alpha Counter | 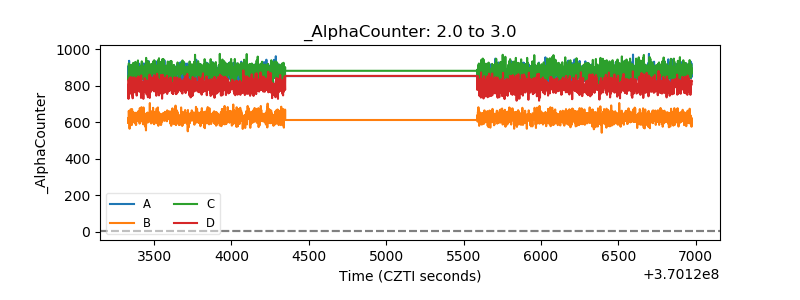 |
| _CPM_Rate | 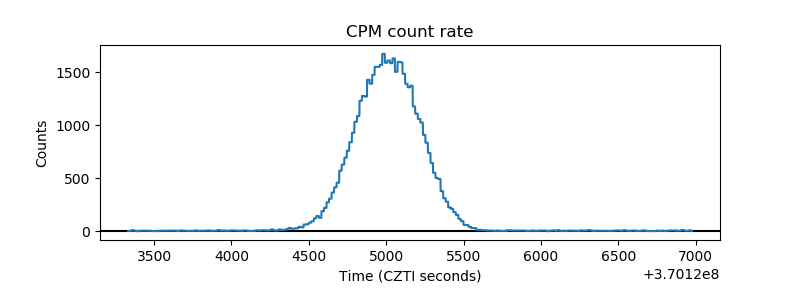 |
| CZT Counter | 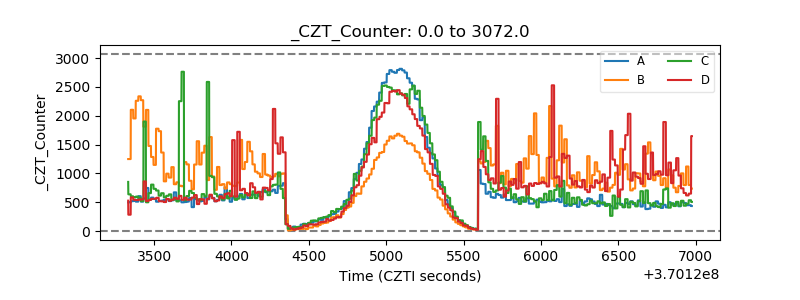 |
| +2.5 Volts monitor |  |
| +5 Volts monitor |  |
| _ROLL_ROT | 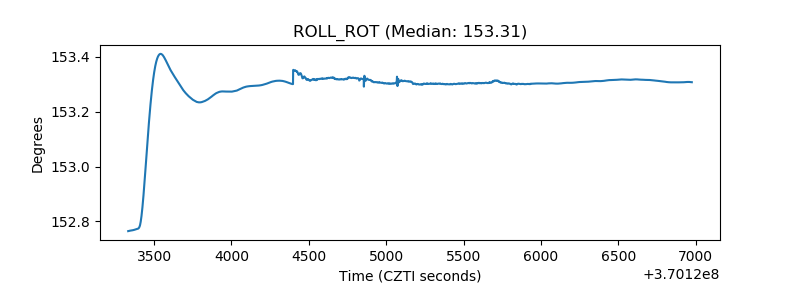 |
| _Roll_DEC | 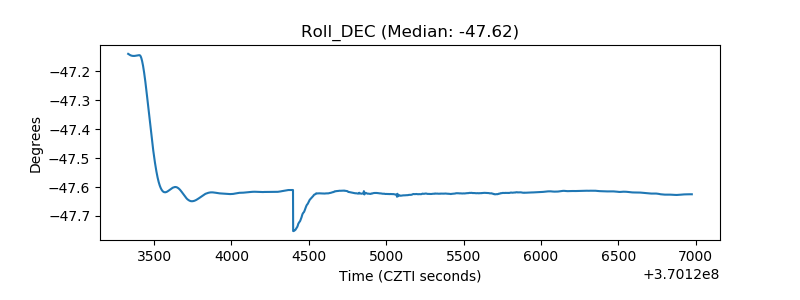 |
| _Roll_RA | 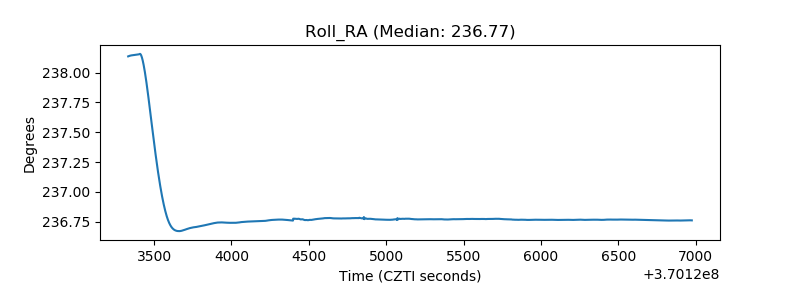 |
| Veto Counter | 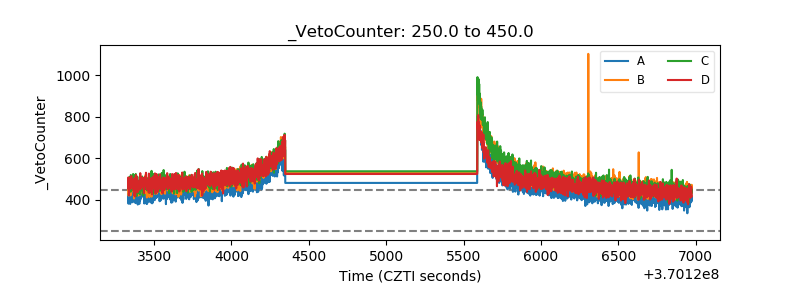 |