| Param | Original file | Final file |
|---|---|---|
| Filename | modeM0/AS1T04_059T01_9000004704_32384cztM0_level2.evt | modeM0/AS1T04_059T01_9000004704_32384cztM0_level2_quad_clean.evt |
| Size (bytes) | 975,755,520 | 73,235,520 |
| Size | 930.6 MB | 69.8 MB |
| Events in quadrant A | 3,439,438 | 511,343 |
| Events in quadrant B | 10,169,807 | 417,728 |
| Events in quadrant C | 10,439,984 | 316,363 |
| Events in quadrant D | 5,026,234 | 477,735 |
| Mode M0 | |||
|---|---|---|---|
| Quadrant | BADHDUFLAG | Total packets | Discarded packets |
| A | 0 | 14733 | 3 |
| B | 0 | 35093 | 2 |
| C | 0 | 35838 | 2 |
| D | 0 | 19714 | 2 |
| Mode M9 | |||
|---|---|---|---|
| Quadrant | BADHDUFLAG | Total packets | Discarded packets |
| A | 0 | 9 | 0 |
| B | 0 | 9 | 0 |
| C | 0 | 9 | 0 |
| D | 0 | 10 | 0 |
| Mode SS | |||
|---|---|---|---|
| Quadrant | BADHDUFLAG | Total packets | Discarded packets |
| A | 0 | 144 | 0 |
| B | 0 | 144 | 0 |
| C | 0 | 144 | 0 |
| D | 0 | 144 | 0 |
| Quadrant | Total seconds | Saturated seconds | Saturation percentage |
|---|---|---|---|
| A | 7064 | 48 | 0.679502% |
| B | 7064 | 2074 | 29.360136% |
| C | 7064 | 3062 | 43.346546% |
| D | 7064 | 285 | 4.034541% |
Noise dominated data is calculated using 1-second bins in cleaned event files. If a bin has >2000 counts, and if more than 50% of those come from <1% of pixels, then it is considered to be noise-dominated and hence unusable.
| Quadrant | # 1 sec bins | Bins with >0 counts | Bins with >2000 counts | High rate bins dominated by noise | Noise dominated (total time) | Noise dominated (detector-on time) | Marked lightcurve |
|---|---|---|---|---|---|---|---|
| A | 7694 | 7065 | 1 | 1 | 0.01% | 0.01% | 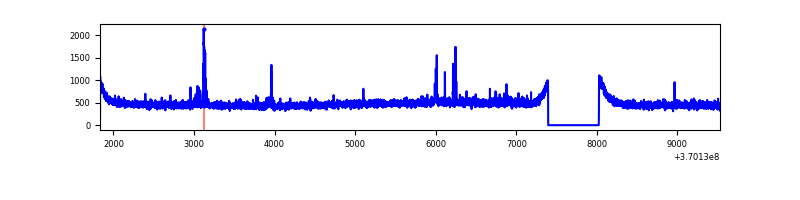 |
| B | 7694 | 7065 | 1291 | 1291 | 16.78% | 18.27% | 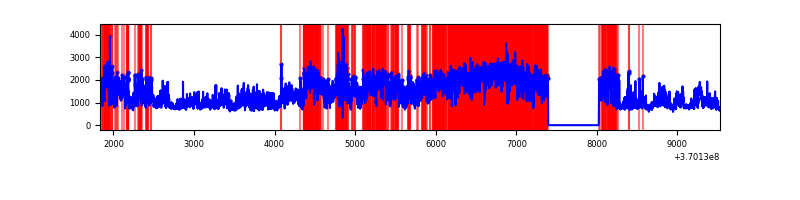 |
| C | 7694 | 7065 | 2391 | 2391 | 31.08% | 33.84% | 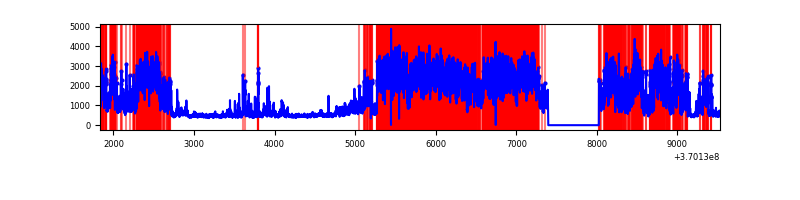 |
| D | 7694 | 7065 | 234 | 234 | 3.04% | 3.31% | 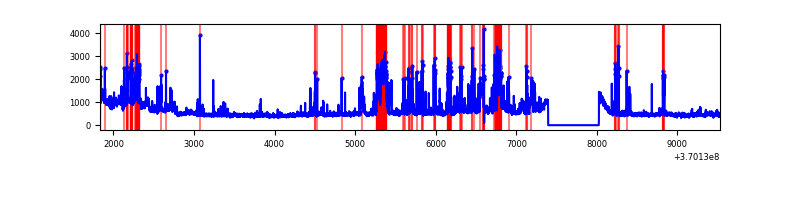 |
Top three noisy pixels from each quadrant. If the there are fewer than three noisy pixels in the level2.evt file, extra rows are filled as -1
| Pixel properties | Quadrant properties | ||||||
|---|---|---|---|---|---|---|---|
| Quadrant | DetID | PixID | Counts | Sigma | Mean | Median | Sigma |
| A | 12 | 96 | 73525 | 416.27 | 868 | 849 | 174.6 |
| A | 13 | 254 | 12856 | 68.77 | 868 | 849 | 174.6 |
| A | 3 | 137 | 8891 | 46.06 | 868 | 849 | 174.6 |
| B | 4 | 80 | 4841345 | 32396.6 | 786 | 767 | 149.4 |
| B | 6 | 159 | 1853489 | 12399.74 | 786 | 767 | 149.4 |
| B | 10 | 245 | 124928 | 830.97 | 786 | 767 | 149.4 |
| C | 3 | 233 | 7683833 | 50602.49 | 650 | 652 | 151.8 |
| C | 14 | 238 | 112592 | 737.25 | 650 | 652 | 151.8 |
| C | 0 | 10 | 37306 | 241.41 | 650 | 652 | 151.8 |
| D | 8 | 195 | 623690 | 3115.62 | 832 | 810 | 199.9 |
| D | 12 | 218 | 506414 | 2529.01 | 832 | 810 | 199.9 |
| D | 12 | 233 | 220072 | 1096.74 | 832 | 810 | 199.9 |
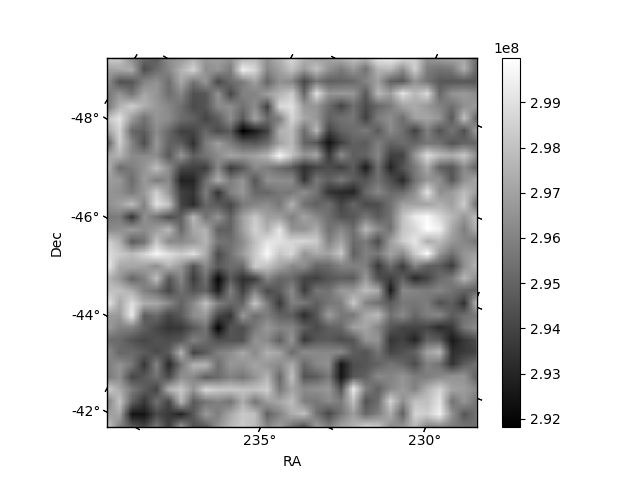
Histogram calculated using DETX and DETY for each event in the final _common_clean file
| Quadrant A | 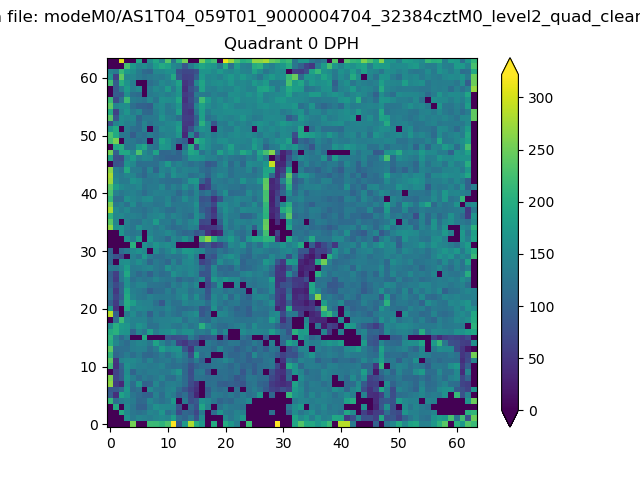 |
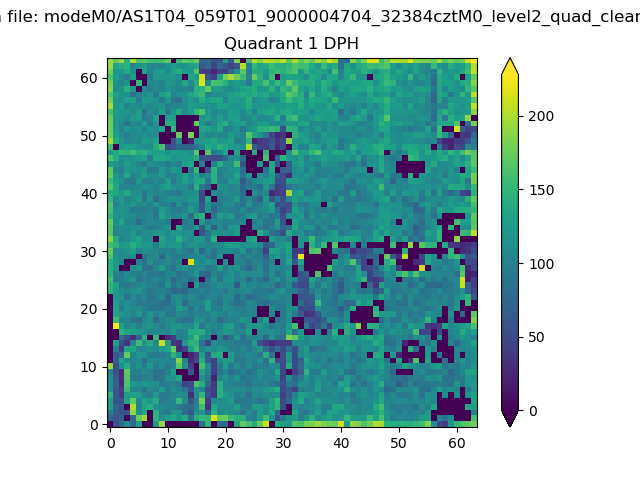 |
Quadrant B |
|---|---|---|---|
| Quadrant D | 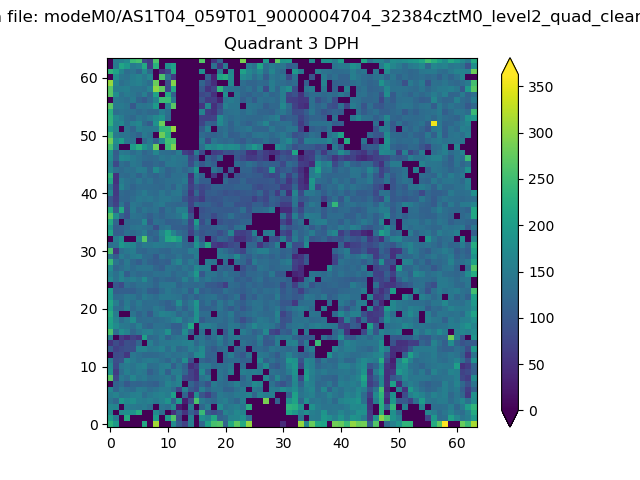 |
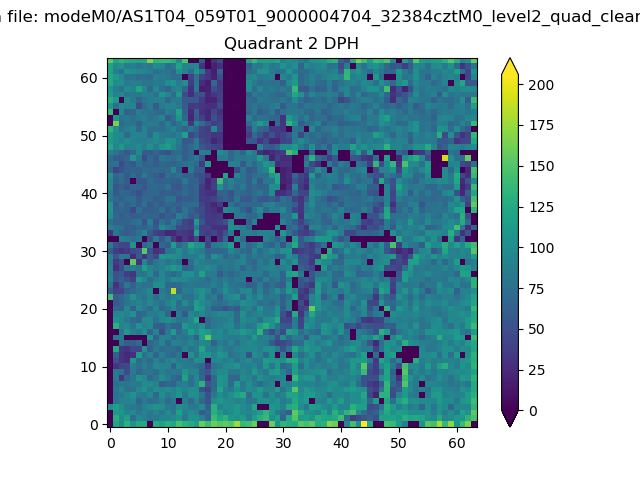 |
Quadrant C |
| Plot type | Count rate plots | Images |
|---|---|---|
| Comparison with Poisson distribution Blue bars denote a histogram of data divided into 1 sec bins. Red curve is a Poisson curve with rate = median count rate of data. |
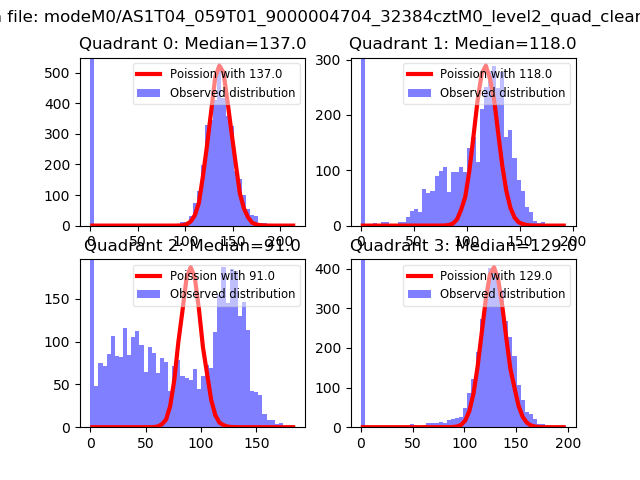 |
 |
| Quadrant-wise count rates Data is divided into 100 sec bins |
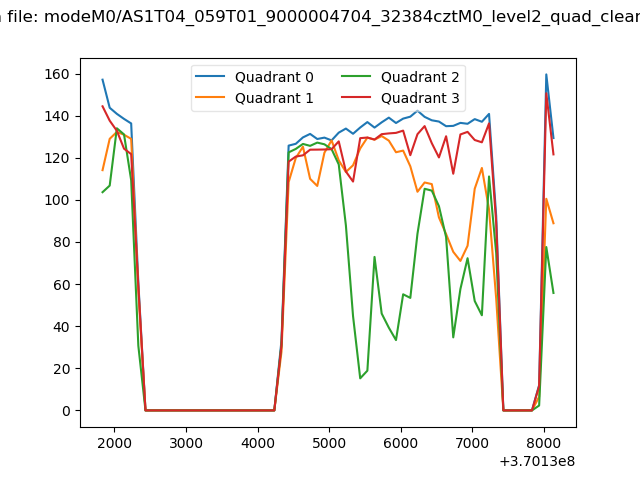 |
|
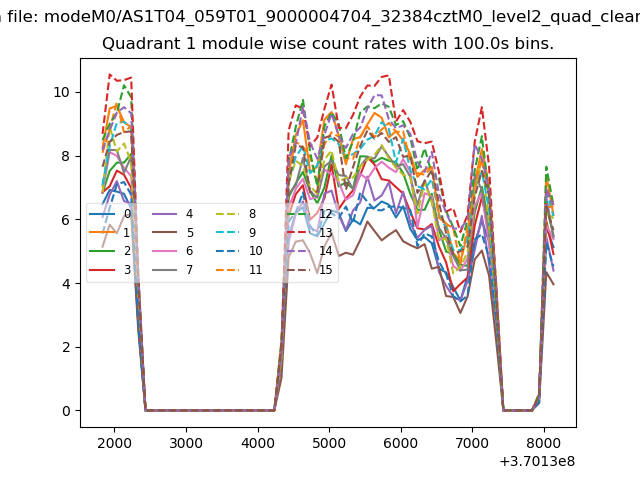
| Module-wise count rates for Quadrant A Data is divided into 100 sec bins |
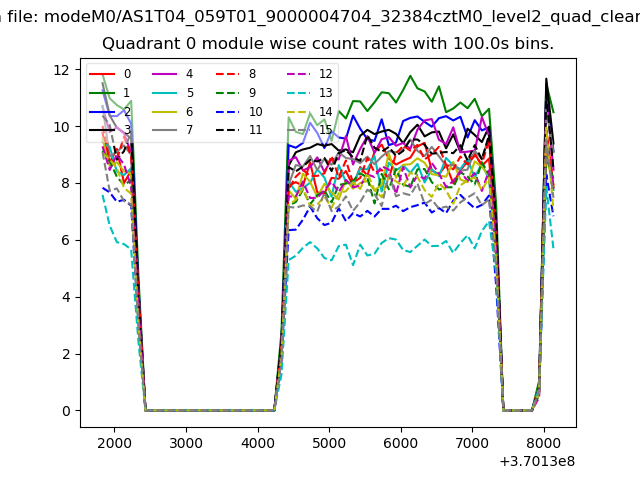 |
 |
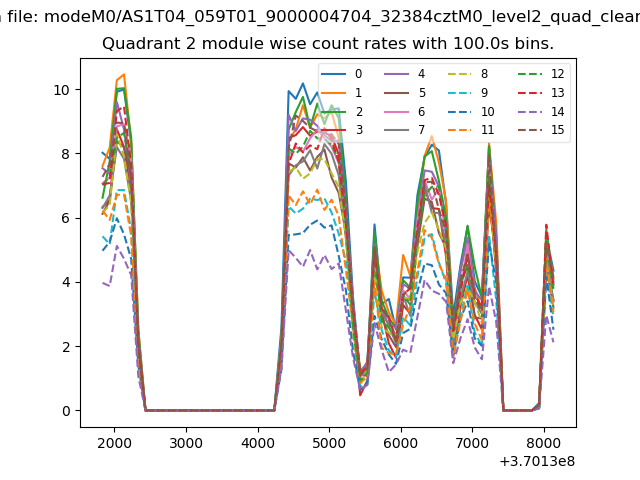
| Module-wise count rates for Quadrant B Data is divided into 100 sec bins |
 |
 |
| Module-wise count rates for Quadrant C Data is divided into 100 sec bins |
 |
 |
| Module-wise count rates for Quadrant D Data is divided into 100 sec bins |
 |
 |
| Parameter | Plot |
|---|---|
| CZT HV Monitor | 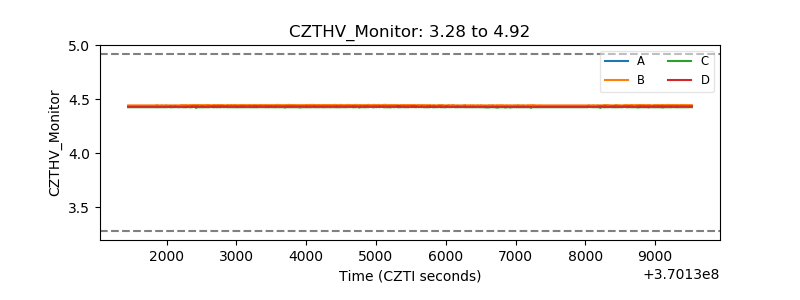 |
| D_VDD | 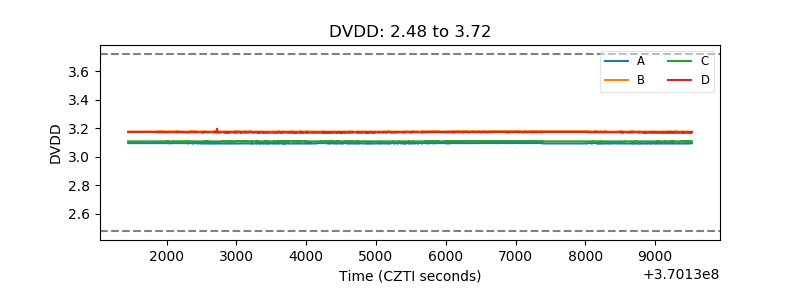 |
| Temperature 1 | 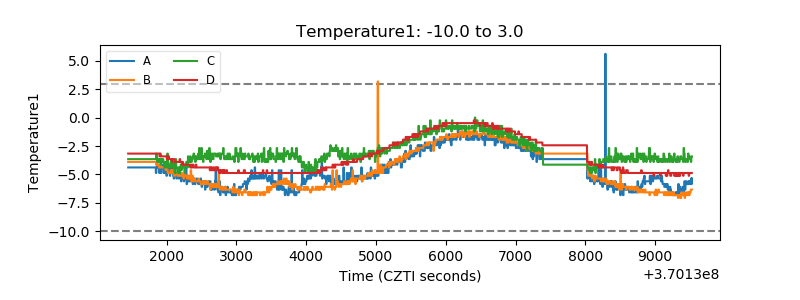 |
| Veto HV Monitor | 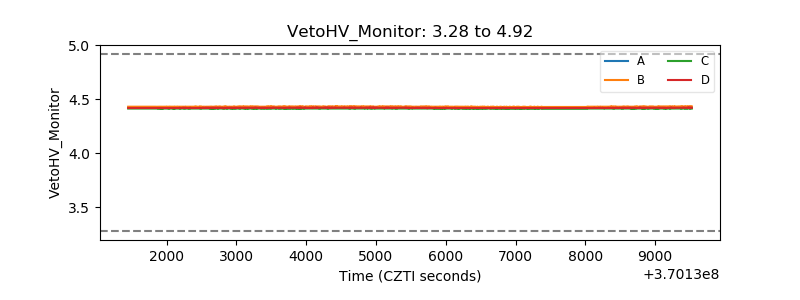 |
| Veto LLD | 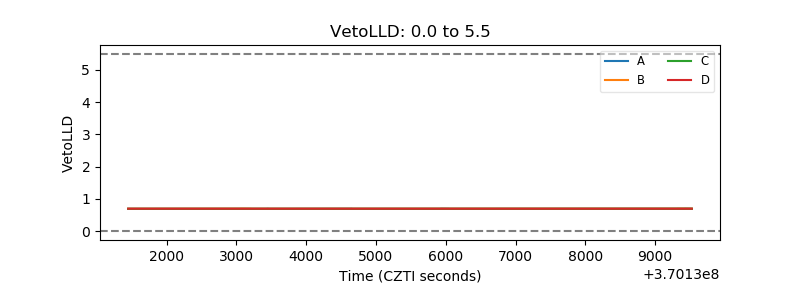 |
| Alpha Counter | 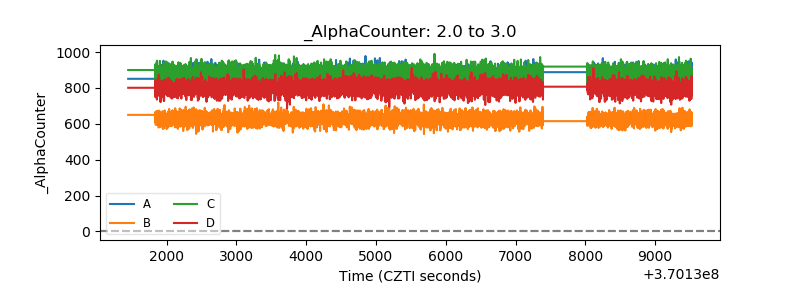 |
| _CPM_Rate | 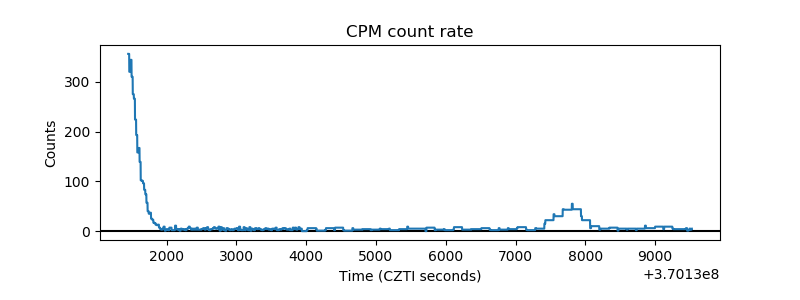 |
| CZT Counter | 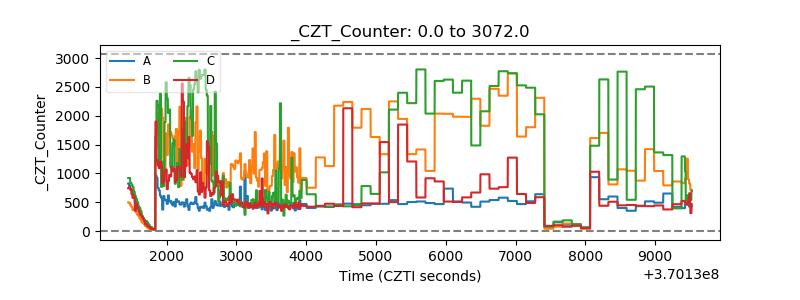 |
| +2.5 Volts monitor |  |
| +5 Volts monitor |  |
| _ROLL_ROT | 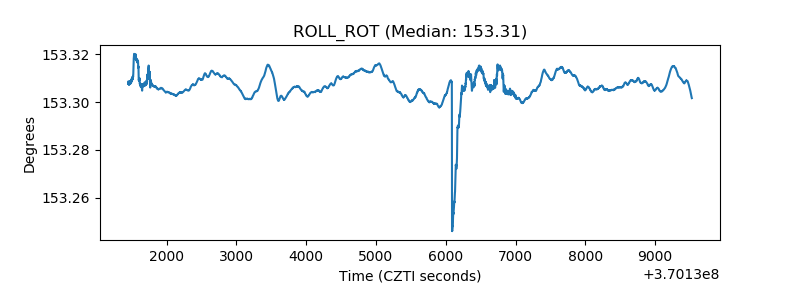 |
| _Roll_DEC | 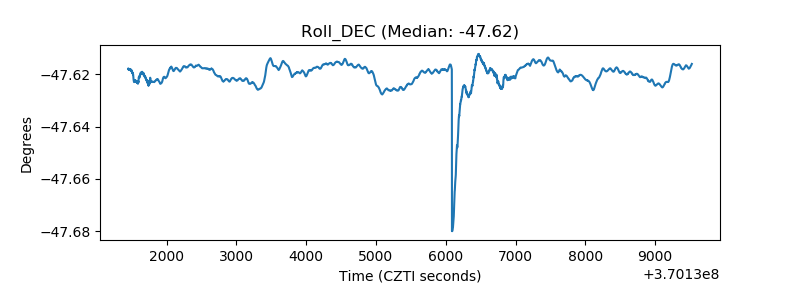 |
| _Roll_RA | 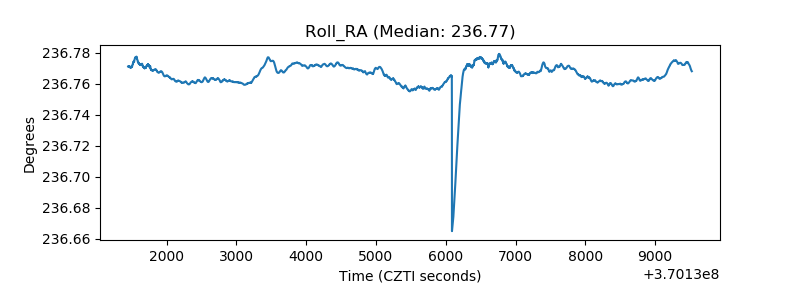 |
| Veto Counter | 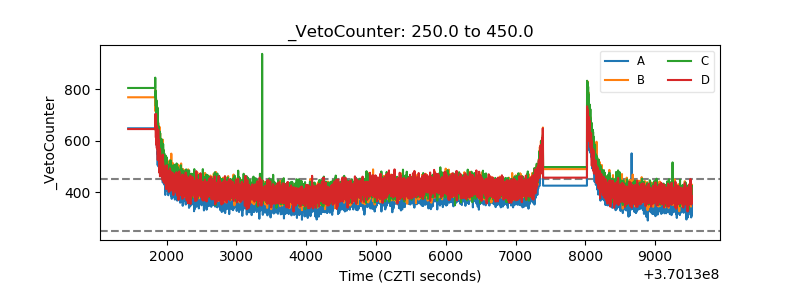 |