| Param | Original file | Final file |
|---|---|---|
| Filename | modeM0/AS1T04_059T01_9000004704_32386cztM0_level2.evt | modeM0/AS1T04_059T01_9000004704_32386cztM0_level2_quad_clean.evt |
| Size (bytes) | 760,083,840 | 83,335,680 |
| Size | 724.9 MB | 79.5 MB |
| Events in quadrant A | 3,386,180 | 536,591 |
| Events in quadrant B | 9,547,717 | 487,259 |
| Events in quadrant C | 4,750,993 | 499,183 |
| Events in quadrant D | 4,847,023 | 497,404 |
| Mode M0 | |||
|---|---|---|---|
| Quadrant | BADHDUFLAG | Total packets | Discarded packets |
| A | 0 | 14814 | 2 |
| B | 0 | 33337 | 1 |
| C | 0 | 18644 | 1 |
| D | 0 | 19148 | 1 |
| Mode M9 | |||
|---|---|---|---|
| Quadrant | BADHDUFLAG | Total packets | Discarded packets |
| A | 0 | 2 | 0 |
| B | 0 | 2 | 0 |
| C | 0 | 2 | 0 |
| D | 0 | 2 | 0 |
| Mode SS | |||
|---|---|---|---|
| Quadrant | BADHDUFLAG | Total packets | Discarded packets |
| A | 0 | 146 | 0 |
| B | 0 | 146 | 0 |
| C | 0 | 146 | 0 |
| D | 0 | 146 | 0 |
| Quadrant | Total seconds | Saturated seconds | Saturation percentage |
|---|---|---|---|
| A | 7216 | 148 | 2.050998% |
| B | 7216 | 1510 | 20.925721% |
| C | 7216 | 670 | 9.284922% |
| D | 7216 | 464 | 6.430155% |
Noise dominated data is calculated using 1-second bins in cleaned event files. If a bin has >2000 counts, and if more than 50% of those come from <1% of pixels, then it is considered to be noise-dominated and hence unusable.
| Quadrant | # 1 sec bins | Bins with >0 counts | Bins with >2000 counts | High rate bins dominated by noise | Noise dominated (total time) | Noise dominated (detector-on time) | Marked lightcurve |
|---|---|---|---|---|---|---|---|
| A | 7406 | 7217 | 0 | 0 | 0.00% | 0.00% | 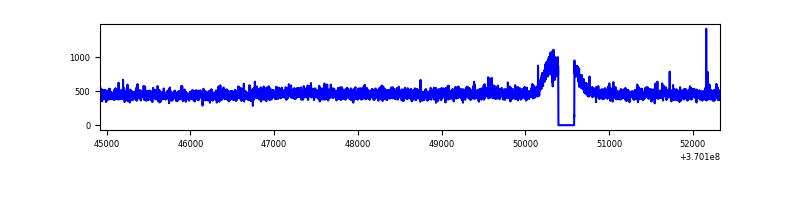 |
| B | 7406 | 7217 | 854 | 854 | 11.53% | 11.83% | 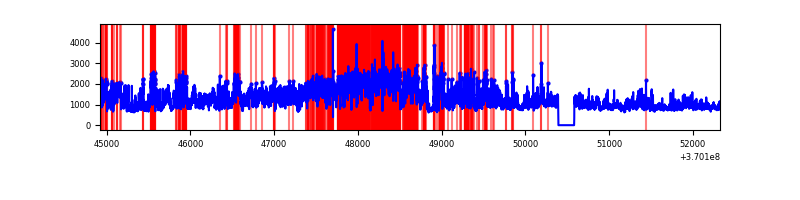 |
| C | 7406 | 7217 | 188 | 188 | 2.54% | 2.60% | 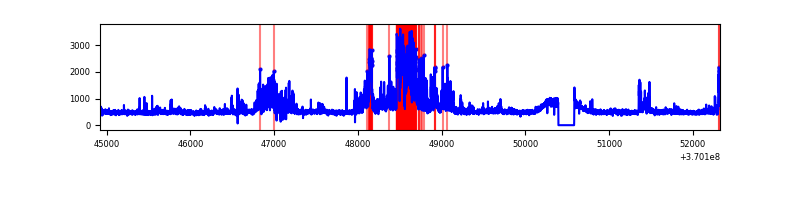 |
| D | 7406 | 7217 | 265 | 265 | 3.58% | 3.67% | 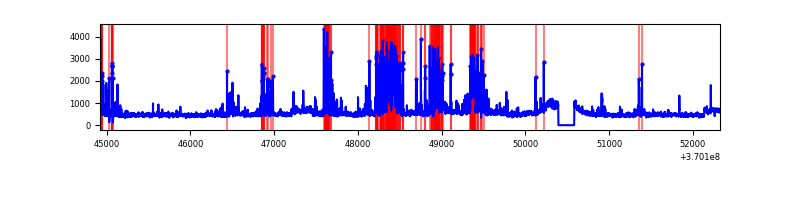 |
Top three noisy pixels from each quadrant. If the there are fewer than three noisy pixels in the level2.evt file, extra rows are filled as -1
| Pixel properties | Quadrant properties | ||||||
|---|---|---|---|---|---|---|---|
| Quadrant | DetID | PixID | Counts | Sigma | Mean | Median | Sigma |
| A | 13 | 254 | 12350 | 64.64 | 873 | 852 | 177.9 |
| A | 3 | 137 | 9130 | 46.54 | 873 | 852 | 177.9 |
| A | 13 | 6 | 9008 | 45.85 | 873 | 852 | 177.9 |
| B | 4 | 80 | 4008215 | 25420.98 | 821 | 799 | 157.6 |
| B | 6 | 159 | 1909667 | 12108.87 | 821 | 799 | 157.6 |
| B | 5 | 172 | 253152 | 1600.8 | 821 | 799 | 157.6 |
| C | 3 | 233 | 1215964 | 6254.91 | 821 | 826 | 194.3 |
| C | 14 | 238 | 192943 | 988.92 | 821 | 826 | 194.3 |
| C | 14 | 254 | 85980 | 438.33 | 821 | 826 | 194.3 |
| D | 12 | 233 | 849852 | 4249.62 | 836 | 813 | 199.8 |
| D | 8 | 195 | 412594 | 2061.05 | 836 | 813 | 199.8 |
| D | 12 | 218 | 222662 | 1110.4 | 836 | 813 | 199.8 |
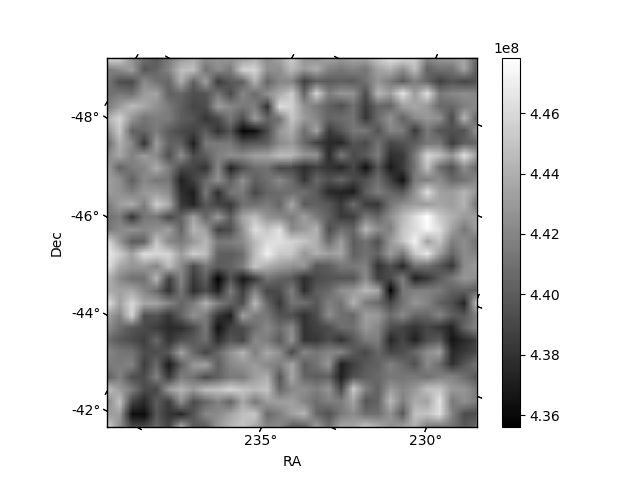
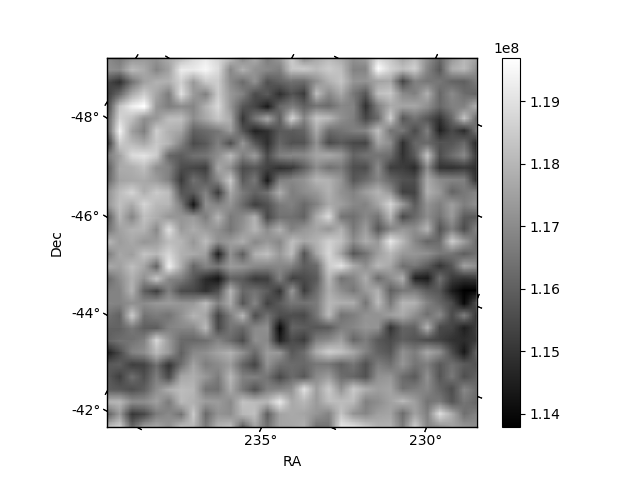
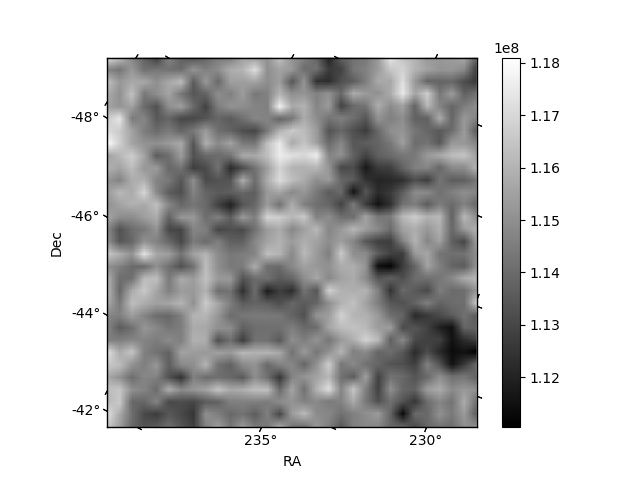
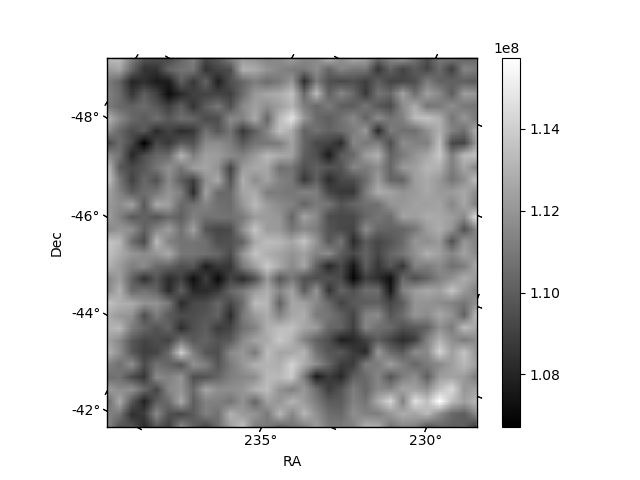
Histogram calculated using DETX and DETY for each event in the final _common_clean file
| Quadrant A | 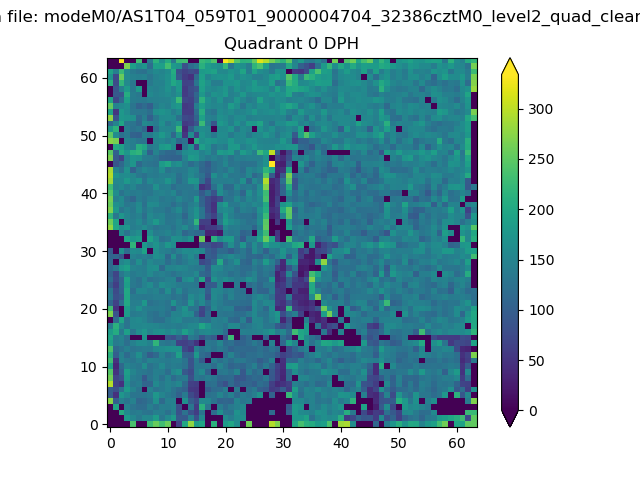 |
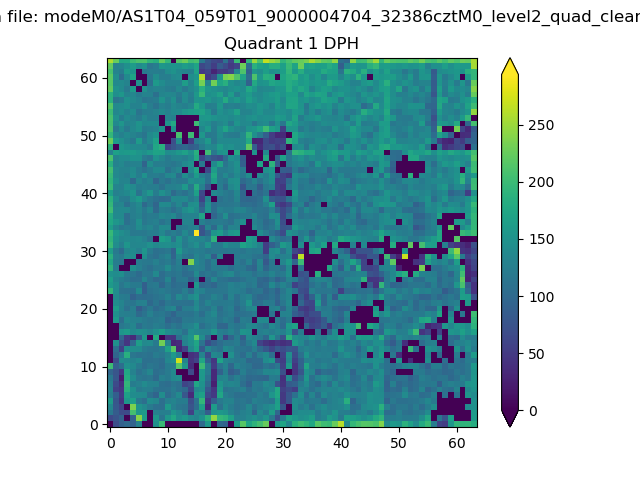 |
Quadrant B |
|---|---|---|---|
| Quadrant D | 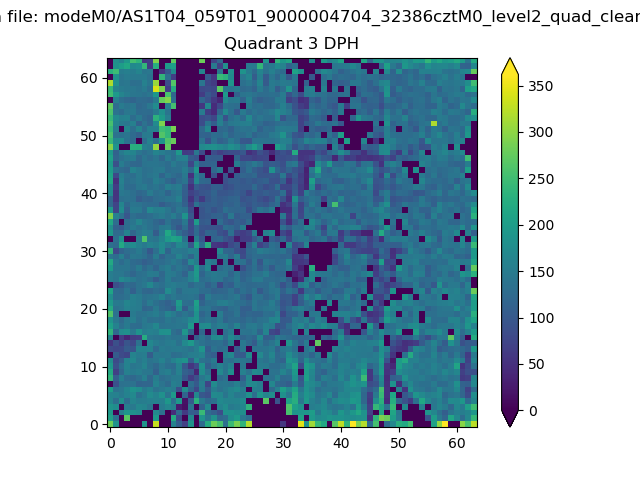 |
 |
Quadrant C |
| Plot type | Count rate plots | Images |
|---|---|---|
| Comparison with Poisson distribution Blue bars denote a histogram of data divided into 1 sec bins. Red curve is a Poisson curve with rate = median count rate of data. |
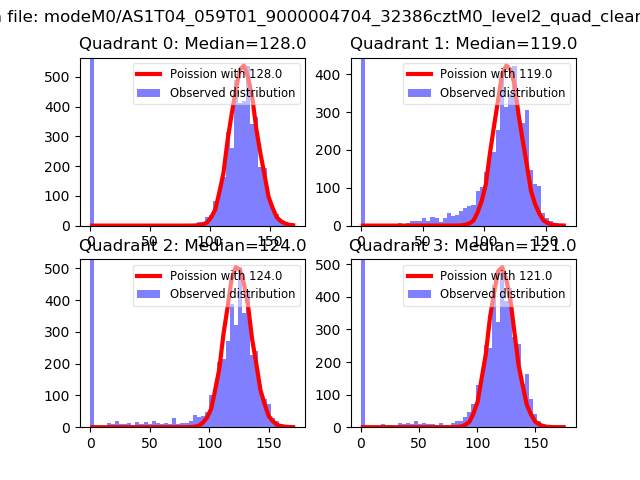 |
 |
| Quadrant-wise count rates Data is divided into 100 sec bins |
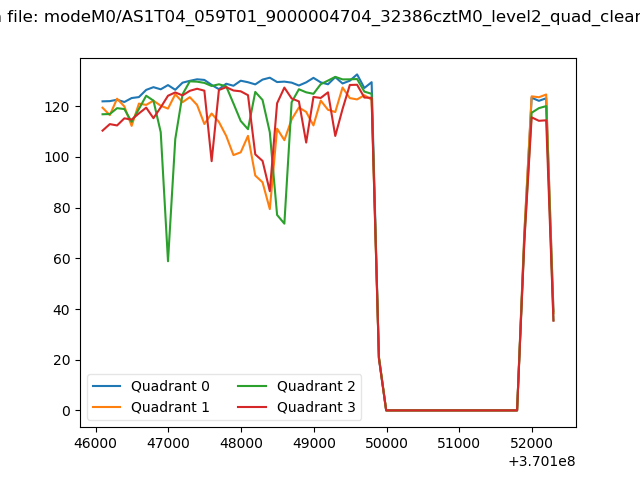 |
|
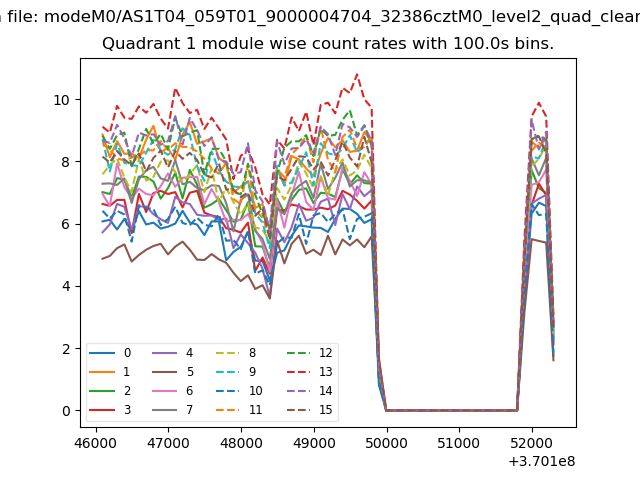
| Module-wise count rates for Quadrant A Data is divided into 100 sec bins |
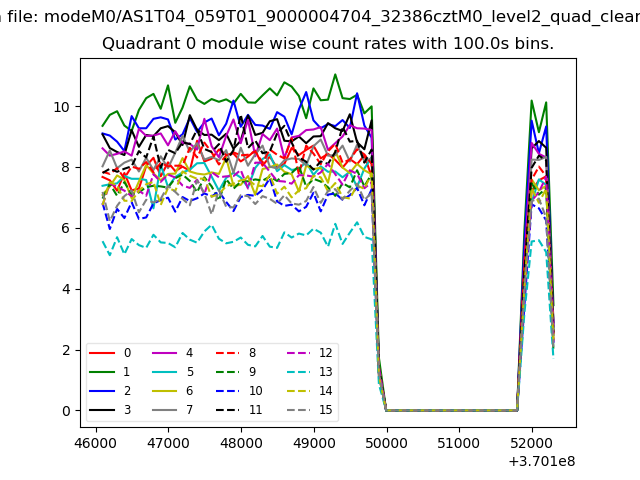 |
 |
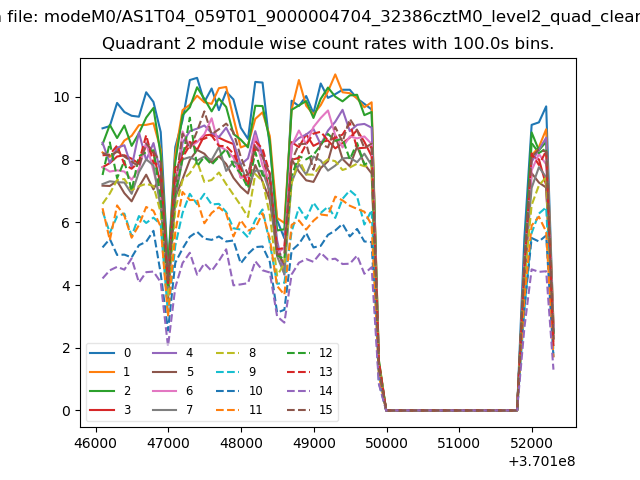
| Module-wise count rates for Quadrant B Data is divided into 100 sec bins |
 |
 |
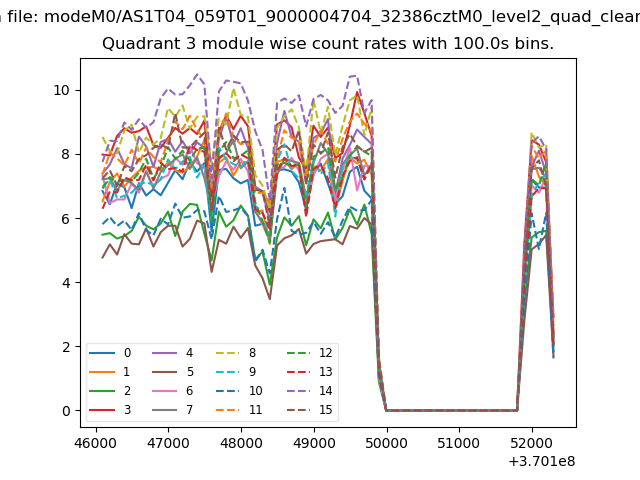
| Module-wise count rates for Quadrant C Data is divided into 100 sec bins |
 |
 |
| Module-wise count rates for Quadrant D Data is divided into 100 sec bins |
 |
 |
| Parameter | Plot |
|---|---|
| CZT HV Monitor | 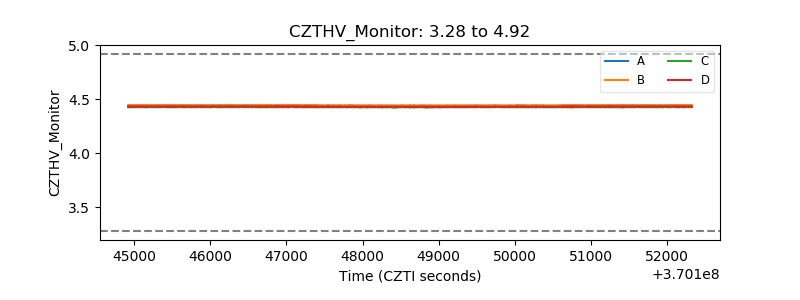 |
| D_VDD | 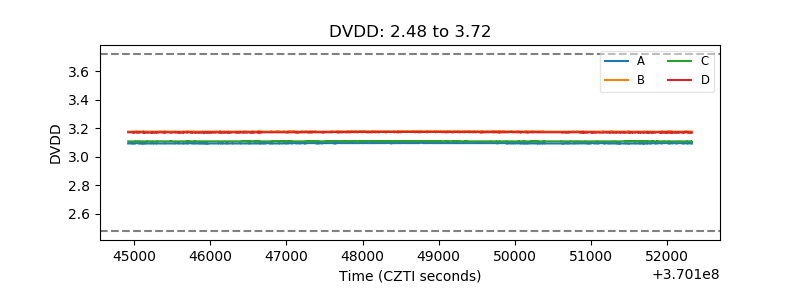 |
| Temperature 1 | 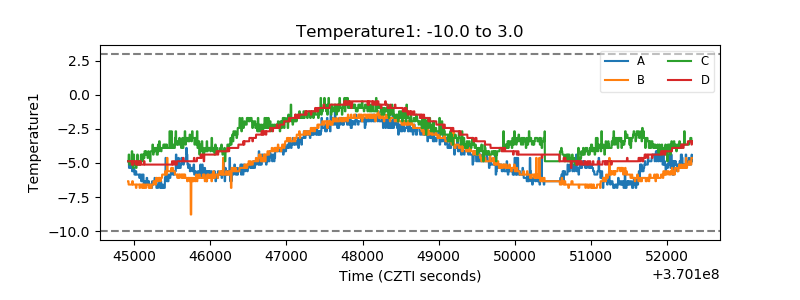 |
| Veto HV Monitor | 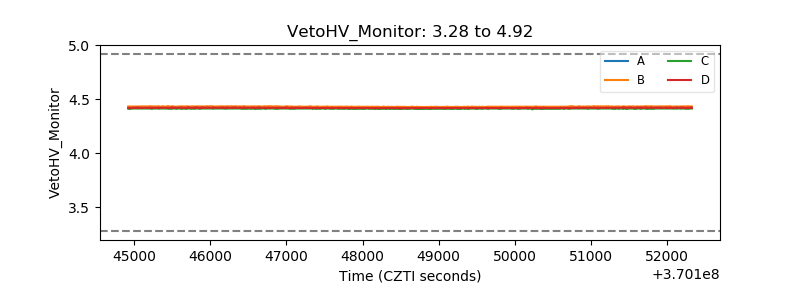 |
| Veto LLD | 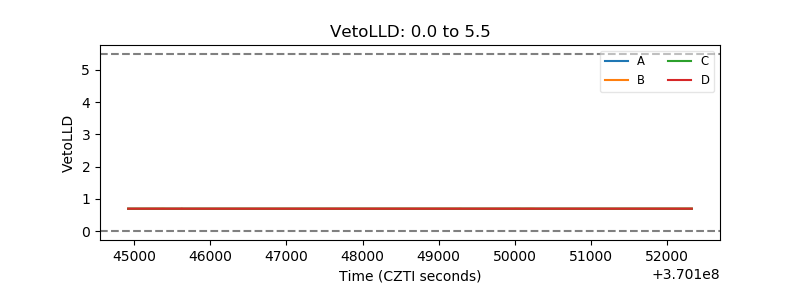 |
| Alpha Counter | 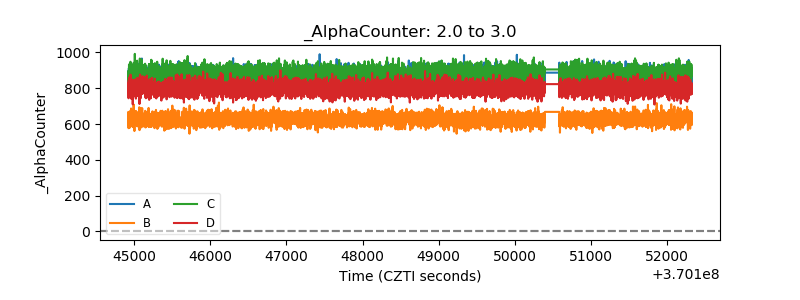 |
| _CPM_Rate | 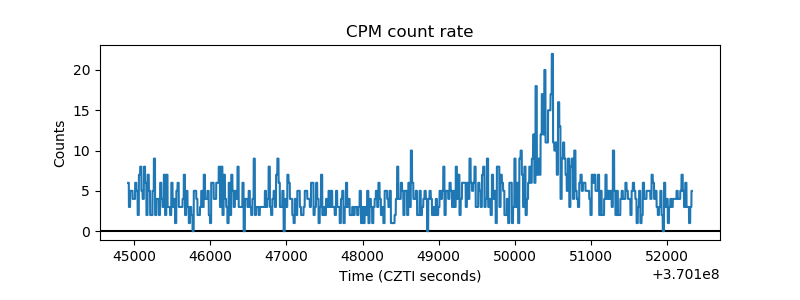 |
| CZT Counter |  |
| +2.5 Volts monitor |  |
| +5 Volts monitor |  |
| _ROLL_ROT | 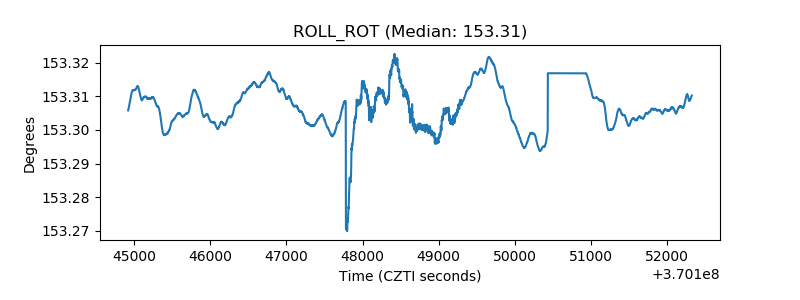 |
| _Roll_DEC | 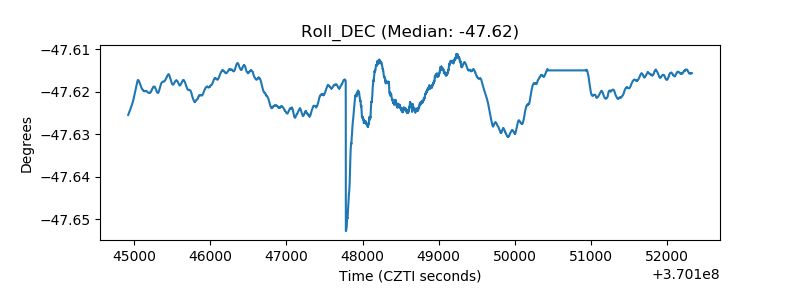 |
| _Roll_RA | 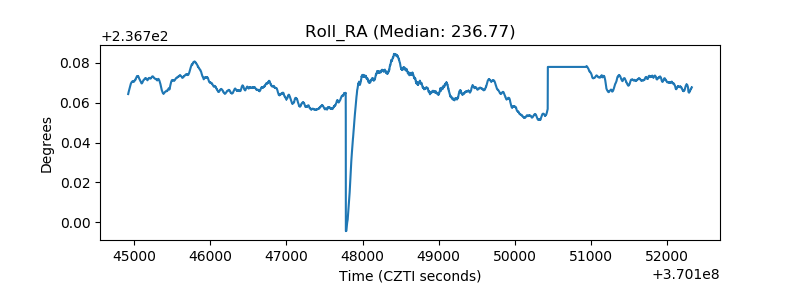 |
| Veto Counter | 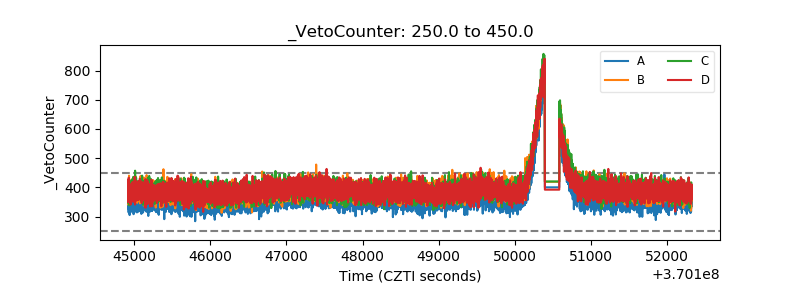 |