| Param | Original file | Final file |
|---|---|---|
| Filename | modeM0/AS1T04_059T01_9000004704_32390cztM0_level2.evt | modeM0/AS1T04_059T01_9000004704_32390cztM0_level2_quad_clean.evt |
| Size (bytes) | 739,872,000 | 84,326,400 |
| Size | 705.6 MB | 80.4 MB |
| Events in quadrant A | 2,899,220 | 584,451 |
| Events in quadrant B | 11,124,889 | 437,272 |
| Events in quadrant C | 4,205,788 | 553,891 |
| Events in quadrant D | 3,771,390 | 557,453 |
| Mode M0 | |||
|---|---|---|---|
| Quadrant | BADHDUFLAG | Total packets | Discarded packets |
| A | 0 | 12549 | 2 |
| B | 0 | 37185 | 1 |
| C | 0 | 16424 | 1 |
| D | 0 | 15309 | 1 |
| Mode M9 | |||
|---|---|---|---|
| Quadrant | BADHDUFLAG | Total packets | Discarded packets |
| A | 0 | 9 | 0 |
| B | 0 | 9 | 0 |
| C | 0 | 9 | 0 |
| D | 0 | 9 | 0 |
| Mode SS | |||
|---|---|---|---|
| Quadrant | BADHDUFLAG | Total packets | Discarded packets |
| A | 0 | 122 | 0 |
| B | 0 | 122 | 0 |
| C | 0 | 122 | 0 |
| D | 0 | 122 | 0 |
| Quadrant | Total seconds | Saturated seconds | Saturation percentage |
|---|---|---|---|
| A | 6000 | 51 | 0.850000% |
| B | 6000 | 3340 | 55.666667% |
| C | 6000 | 497 | 8.283333% |
| D | 6000 | 151 | 2.516667% |
Noise dominated data is calculated using 1-second bins in cleaned event files. If a bin has >2000 counts, and if more than 50% of those come from <1% of pixels, then it is considered to be noise-dominated and hence unusable.
| Quadrant | # 1 sec bins | Bins with >0 counts | Bins with >2000 counts | High rate bins dominated by noise | Noise dominated (total time) | Noise dominated (detector-on time) | Marked lightcurve |
|---|---|---|---|---|---|---|---|
| A | 6925 | 6001 | 0 | 0 | 0.00% | 0.00% | 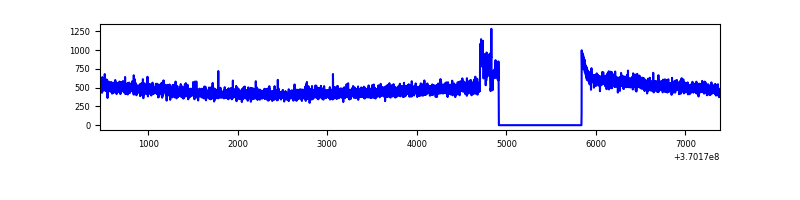 |
| B | 6925 | 6001 | 2308 | 2308 | 33.33% | 38.46% | 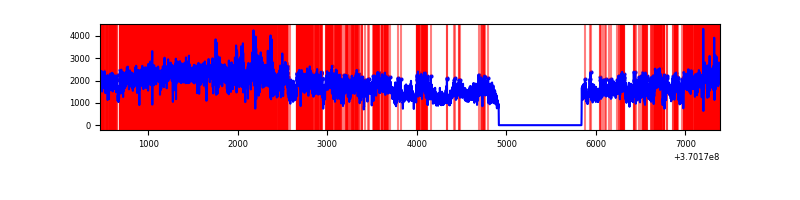 |
| C | 6925 | 6001 | 257 | 257 | 3.71% | 4.28% | 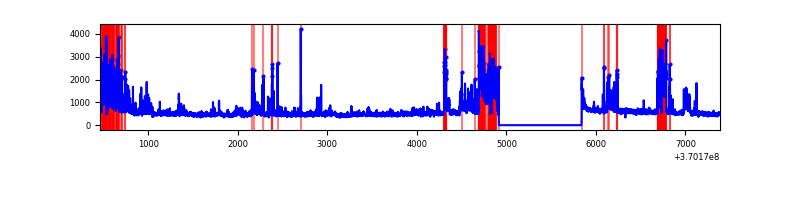 |
| D | 6925 | 6001 | 86 | 86 | 1.24% | 1.43% | 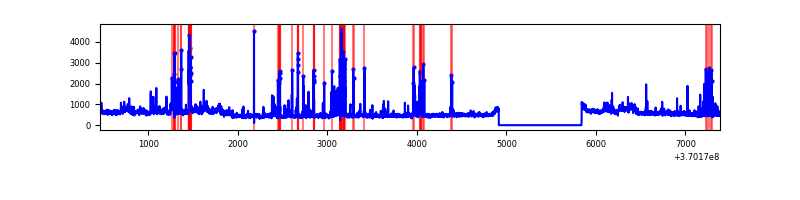 |
Top three noisy pixels from each quadrant. If the there are fewer than three noisy pixels in the level2.evt file, extra rows are filled as -1
| Pixel properties | Quadrant properties | ||||||
|---|---|---|---|---|---|---|---|
| Quadrant | DetID | PixID | Counts | Sigma | Mean | Median | Sigma |
| A | 15 | 174 | 43368 | 286.09 | 737 | 722 | 149.1 |
| A | 13 | 6 | 12170 | 76.8 | 737 | 722 | 149.1 |
| A | 13 | 254 | 11023 | 69.1 | 737 | 722 | 149.1 |
| B | 4 | 80 | 6749061 | 57448.88 | 614 | 598 | 117.5 |
| B | 6 | 159 | 1357282 | 11549.29 | 614 | 598 | 117.5 |
| B | 5 | 172 | 471917 | 4012.28 | 614 | 598 | 117.5 |
| C | 3 | 233 | 1331638 | 8435.39 | 676 | 679 | 157.8 |
| C | 14 | 238 | 111933 | 705.11 | 676 | 679 | 157.8 |
| C | 0 | 10 | 57885 | 362.56 | 676 | 679 | 157.8 |
| D | 8 | 195 | 523904 | 3067.85 | 710 | 693 | 170.5 |
| D | 13 | 249 | 239129 | 1398.07 | 710 | 693 | 170.5 |
| D | 1 | 47 | 151016 | 881.42 | 710 | 693 | 170.5 |
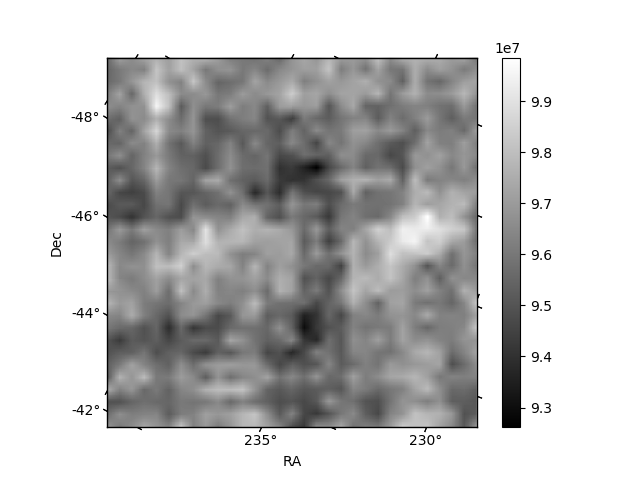
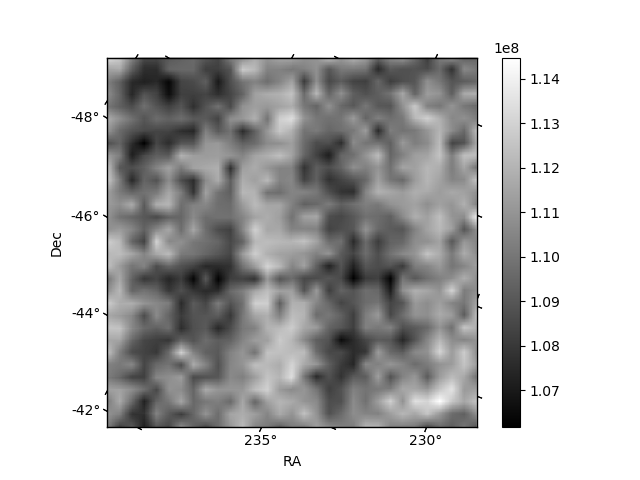
Histogram calculated using DETX and DETY for each event in the final _common_clean file
| Quadrant A |  |
 |
Quadrant B |
|---|---|---|---|
| Quadrant D | 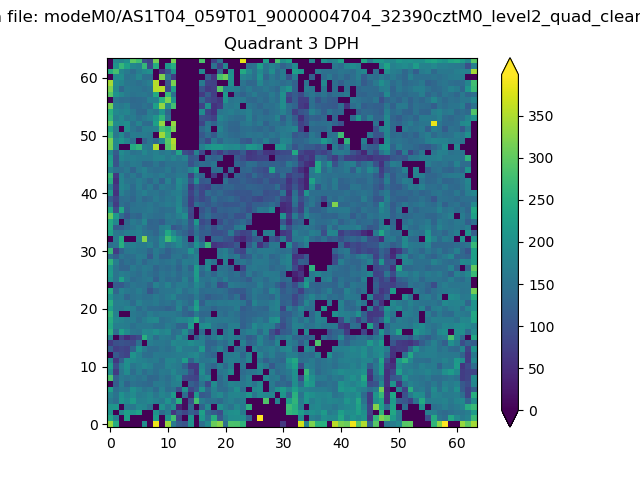 |
 |
Quadrant C |
| Plot type | Count rate plots | Images |
|---|---|---|
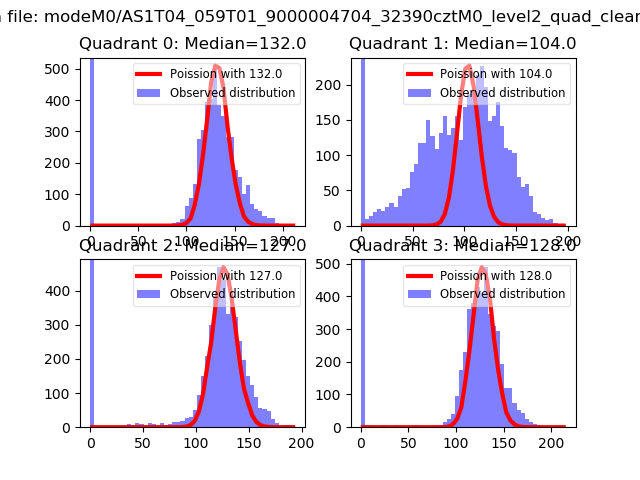
| Comparison with Poisson distribution Blue bars denote a histogram of data divided into 1 sec bins. Red curve is a Poisson curve with rate = median count rate of data. |
 |
 |
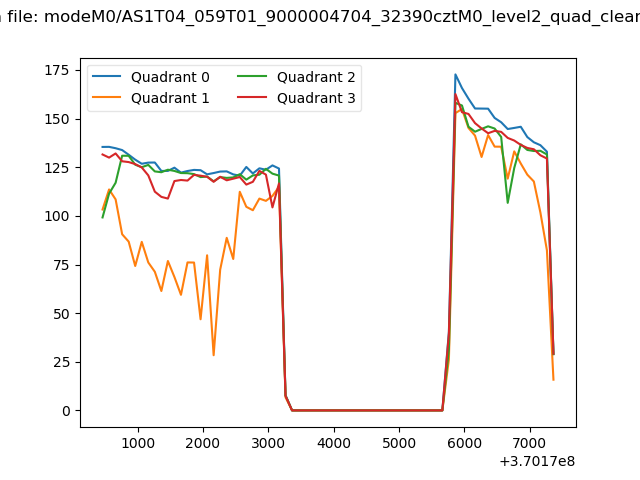
| Quadrant-wise count rates Data is divided into 100 sec bins |
 |
|
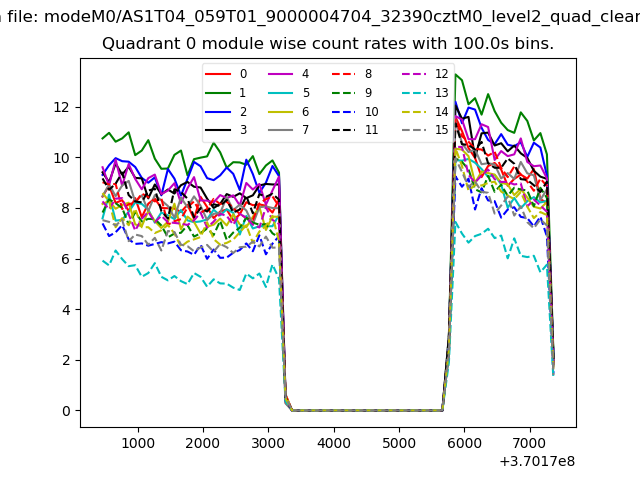
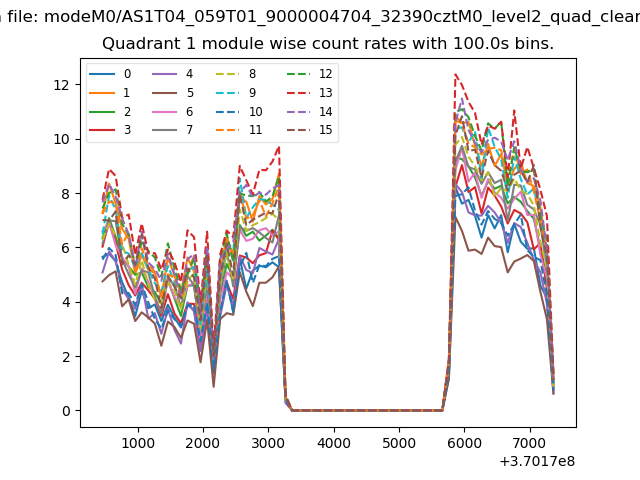
| Module-wise count rates for Quadrant A Data is divided into 100 sec bins |
 |
 |
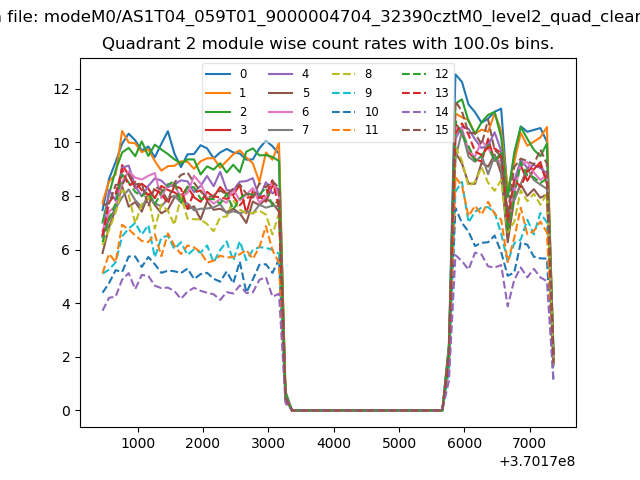
| Module-wise count rates for Quadrant B Data is divided into 100 sec bins |
 |
 |
| Module-wise count rates for Quadrant C Data is divided into 100 sec bins |
 |
 |
| Module-wise count rates for Quadrant D Data is divided into 100 sec bins |
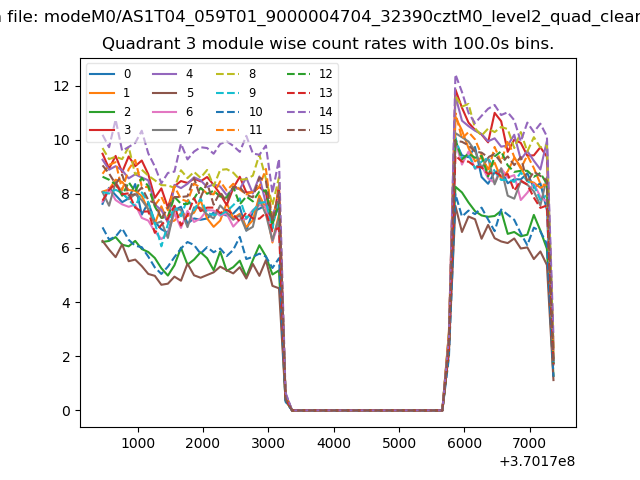 |
 |
| Parameter | Plot |
|---|---|
| CZT HV Monitor | 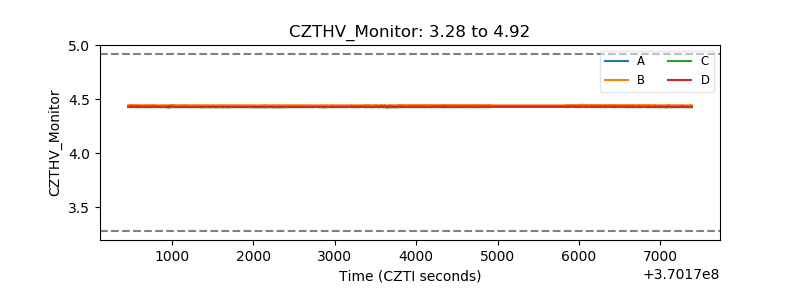 |
| D_VDD | 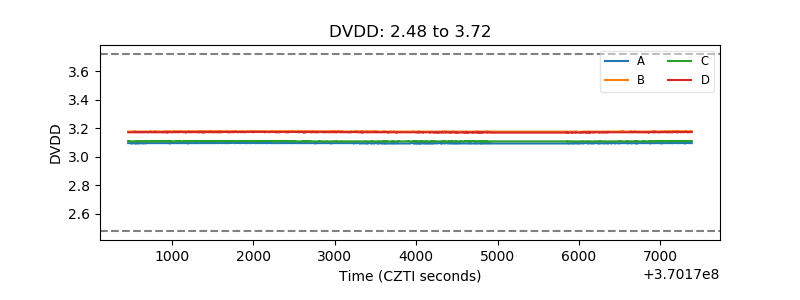 |
| Temperature 1 | 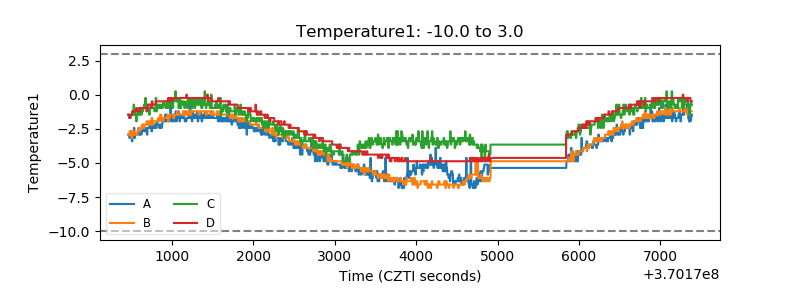 |
| Veto HV Monitor | 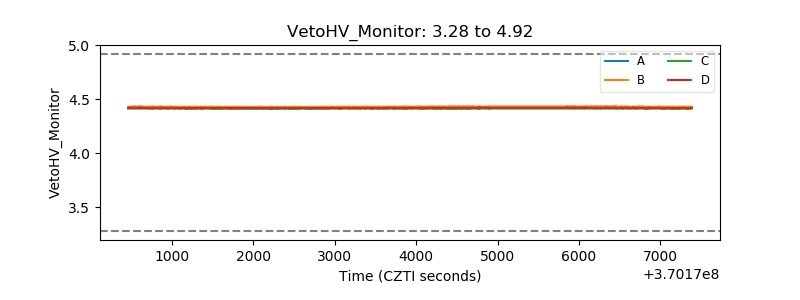 |
| Veto LLD | 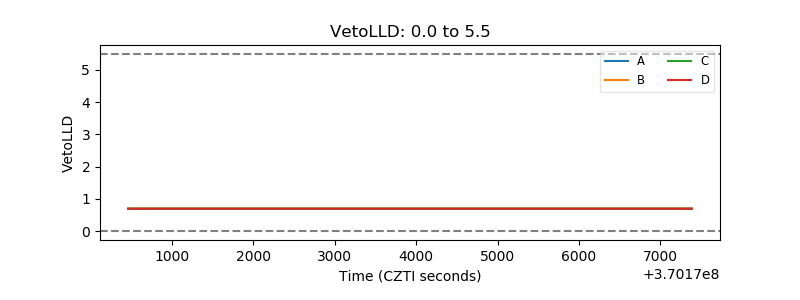 |
| Alpha Counter | 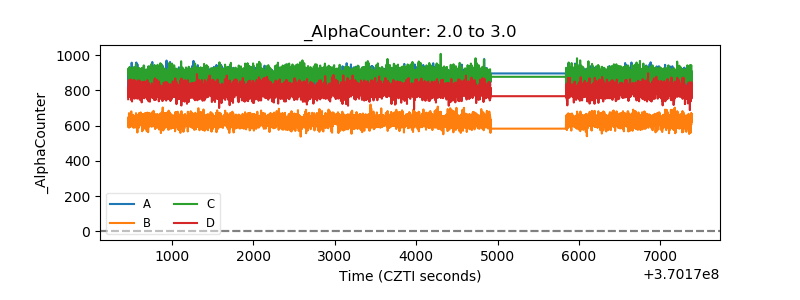 |
| _CPM_Rate | 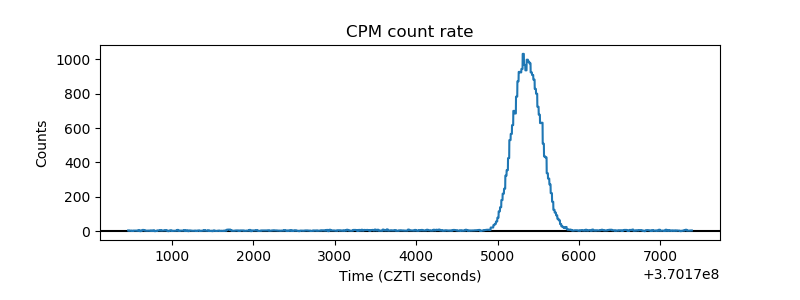 |
| CZT Counter |  |
| +2.5 Volts monitor |  |
| +5 Volts monitor | 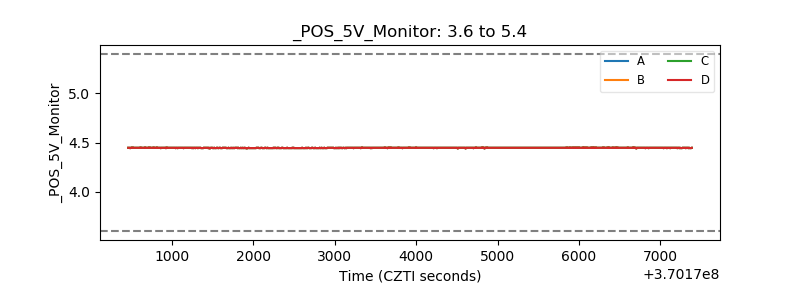 |
| _ROLL_ROT | 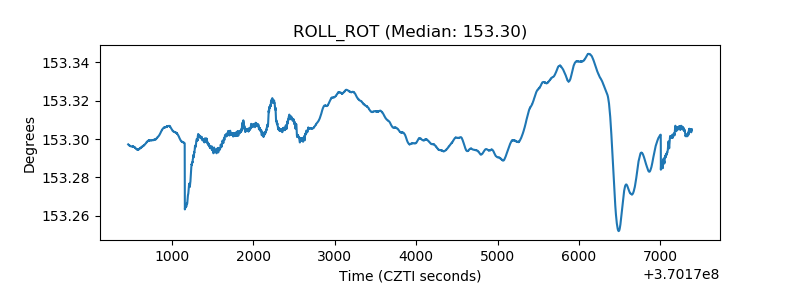 |
| _Roll_DEC | 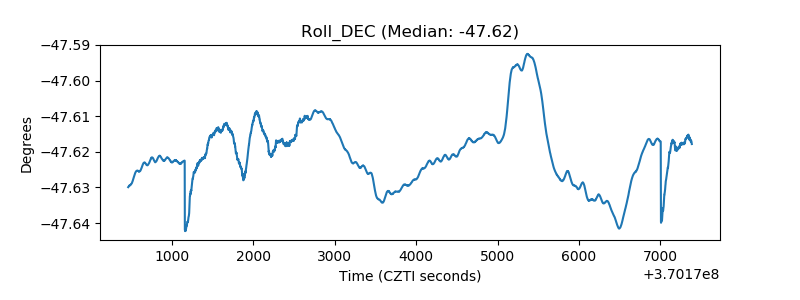 |
| _Roll_RA | 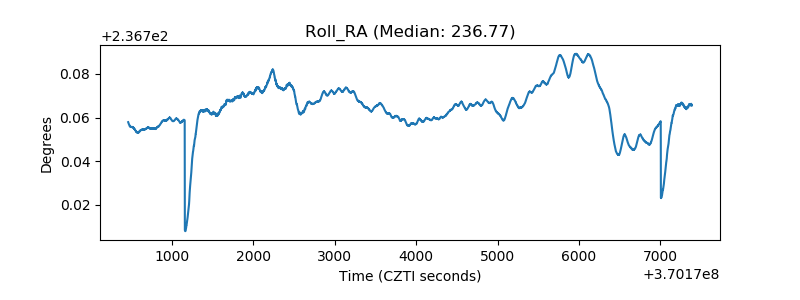 |
| Veto Counter | 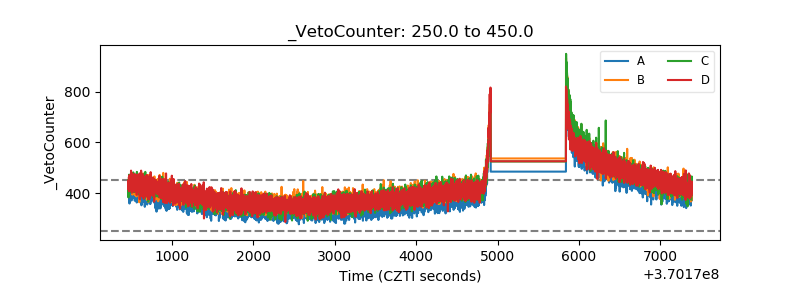 |