| Param | Original file | Final file |
|---|---|---|
| Filename | modeM0/AS1T04_059T01_9000004704_32393cztM0_level2.evt | modeM0/AS1T04_059T01_9000004704_32393cztM0_level2_quad_clean.evt |
| Size (bytes) | 648,244,800 | 79,588,800 |
| Size | 618.2 MB | 75.9 MB |
| Events in quadrant A | 2,799,983 | 549,285 |
| Events in quadrant B | 9,577,539 | 439,793 |
| Events in quadrant C | 3,135,441 | 517,958 |
| Events in quadrant D | 3,737,939 | 507,888 |
| Mode M0 | |||
|---|---|---|---|
| Quadrant | BADHDUFLAG | Total packets | Discarded packets |
| A | 0 | 11949 | 2 |
| B | 0 | 32344 | 1 |
| C | 0 | 12755 | 1 |
| D | 0 | 14877 | 1 |
| Mode M9 | |||
|---|---|---|---|
| Quadrant | BADHDUFLAG | Total packets | Discarded packets |
| A | 0 | 12 | 0 |
| B | 0 | 12 | 0 |
| C | 0 | 12 | 0 |
| D | 0 | 12 | 0 |
| Mode SS | |||
|---|---|---|---|
| Quadrant | BADHDUFLAG | Total packets | Discarded packets |
| A | 0 | 114 | 0 |
| B | 0 | 114 | 0 |
| C | 0 | 114 | 0 |
| D | 0 | 114 | 0 |
| Quadrant | Total seconds | Saturated seconds | Saturation percentage |
|---|---|---|---|
| A | 5640 | 36 | 0.638298% |
| B | 5640 | 2389 | 42.358156% |
| C | 5640 | 142 | 2.517730% |
| D | 5640 | 98 | 1.737589% |
Noise dominated data is calculated using 1-second bins in cleaned event files. If a bin has >2000 counts, and if more than 50% of those come from <1% of pixels, then it is considered to be noise-dominated and hence unusable.
| Quadrant | # 1 sec bins | Bins with >0 counts | Bins with >2000 counts | High rate bins dominated by noise | Noise dominated (total time) | Noise dominated (detector-on time) | Marked lightcurve |
|---|---|---|---|---|---|---|---|
| A | 6850 | 5641 | 0 | 0 | 0.00% | 0.00% |  |
| B | 6850 | 5641 | 1878 | 1878 | 27.42% | 33.29% |  |
| C | 6850 | 5641 | 21 | 21 | 0.31% | 0.37% |  |
| D | 6850 | 5641 | 70 | 70 | 1.02% | 1.24% | 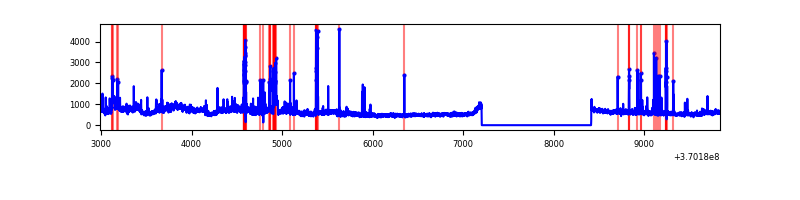 |
Top three noisy pixels from each quadrant. If the there are fewer than three noisy pixels in the level2.evt file, extra rows are filled as -1
| Pixel properties | Quadrant properties | ||||||
|---|---|---|---|---|---|---|---|
| Quadrant | DetID | PixID | Counts | Sigma | Mean | Median | Sigma |
| A | 13 | 6 | 12740 | 83.33 | 719 | 707 | 144.4 |
| A | 13 | 254 | 10627 | 68.69 | 719 | 707 | 144.4 |
| A | 3 | 137 | 6868 | 42.66 | 719 | 707 | 144.4 |
| B | 4 | 80 | 4155815 | 34952.34 | 626 | 612 | 118.9 |
| B | 6 | 159 | 1442061 | 12125.04 | 626 | 612 | 118.9 |
| B | 10 | 245 | 700498 | 5887.23 | 626 | 612 | 118.9 |
| C | 0 | 10 | 216632 | 1387.17 | 669 | 674 | 155.7 |
| C | 3 | 233 | 123656 | 789.95 | 669 | 674 | 155.7 |
| C | 14 | 238 | 118321 | 755.68 | 669 | 674 | 155.7 |
| D | 8 | 195 | 797789 | 4901.27 | 680 | 663 | 162.6 |
| D | 13 | 249 | 135168 | 827.03 | 680 | 663 | 162.6 |
| D | 1 | 47 | 114217 | 698.21 | 680 | 663 | 162.6 |
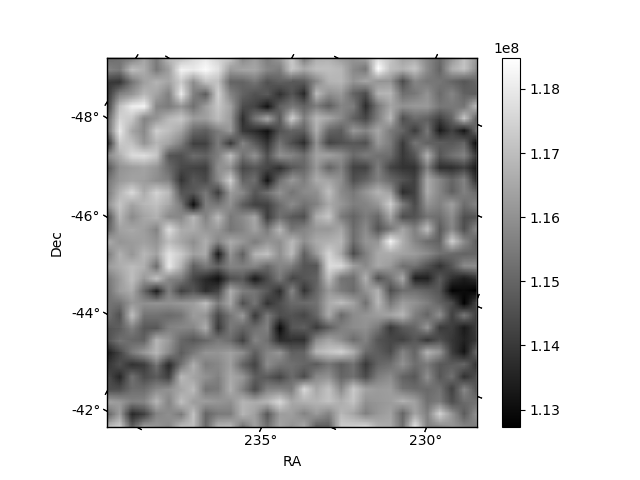
Histogram calculated using DETX and DETY for each event in the final _common_clean file
| Quadrant A | 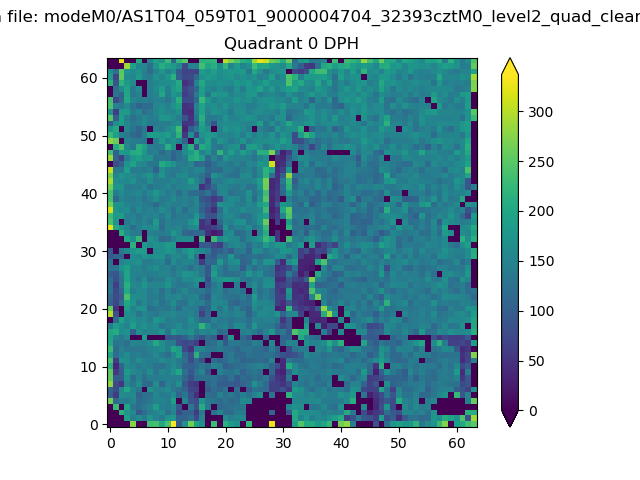 |
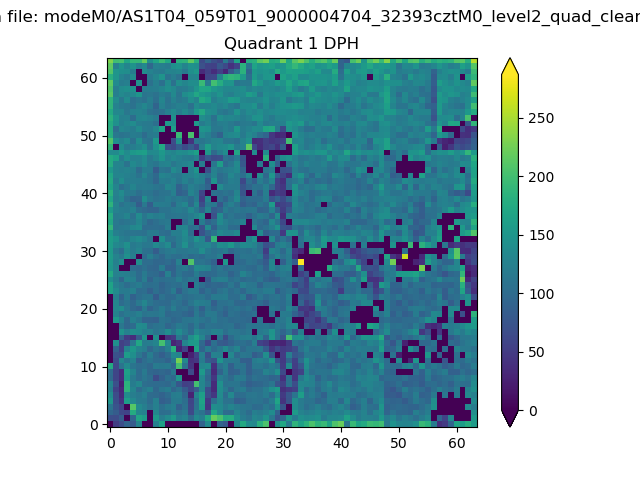 |
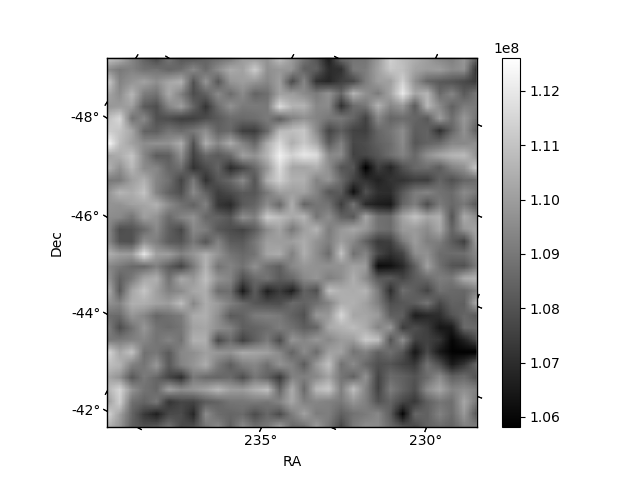
Quadrant B |
|---|---|---|---|
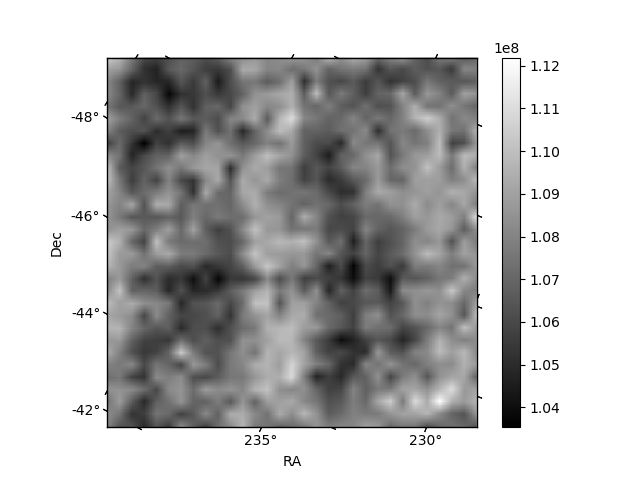
| Quadrant D | 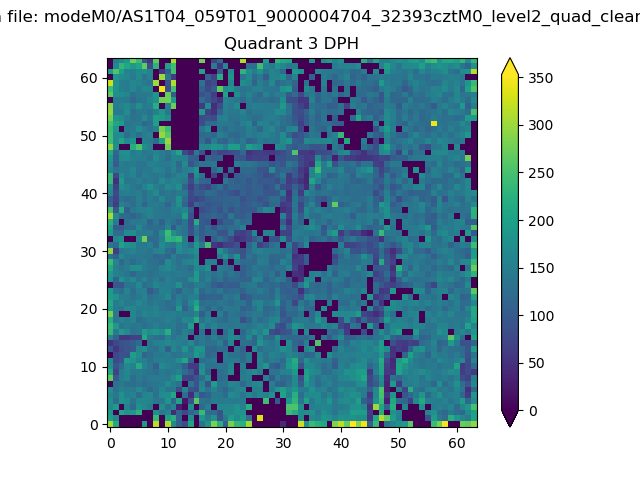 |
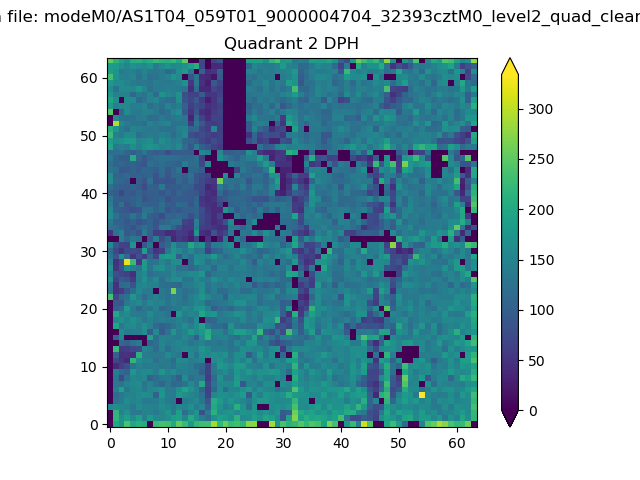 |
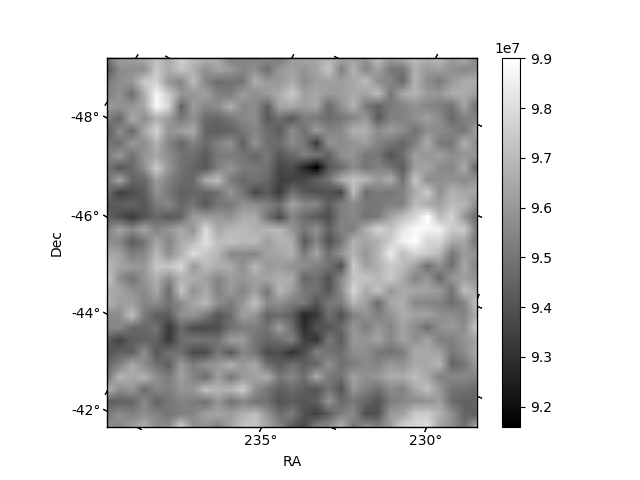
Quadrant C |
| Plot type | Count rate plots | Images |
|---|---|---|
| Comparison with Poisson distribution Blue bars denote a histogram of data divided into 1 sec bins. Red curve is a Poisson curve with rate = median count rate of data. |
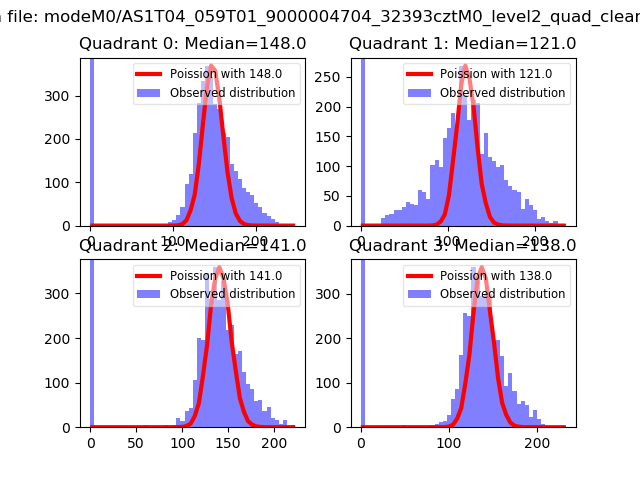 |
 |
| Quadrant-wise count rates Data is divided into 100 sec bins |
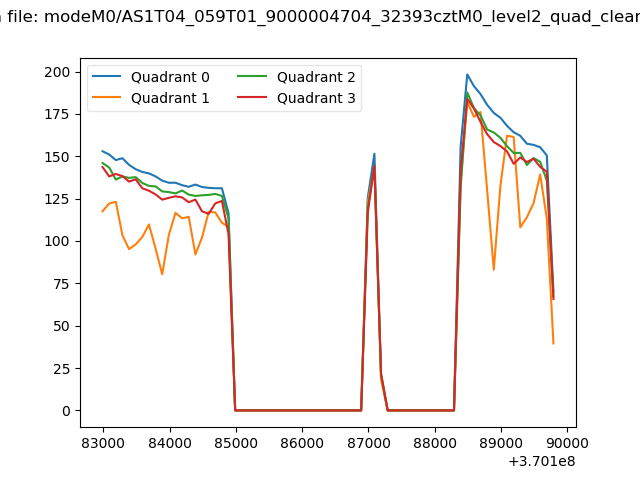 |
|
| Module-wise count rates for Quadrant A Data is divided into 100 sec bins |
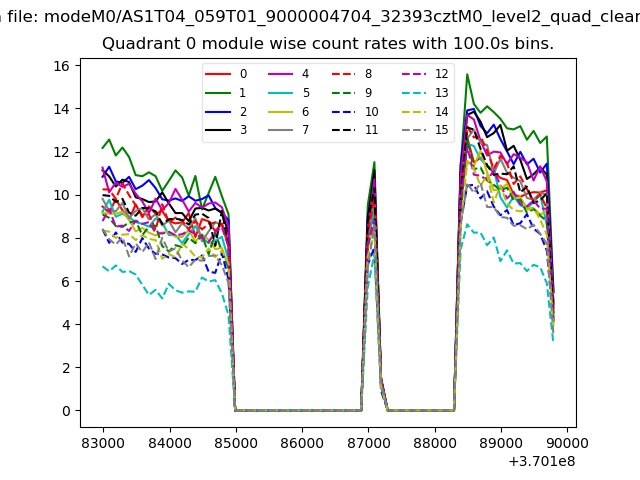 |
 |
| Module-wise count rates for Quadrant B Data is divided into 100 sec bins |
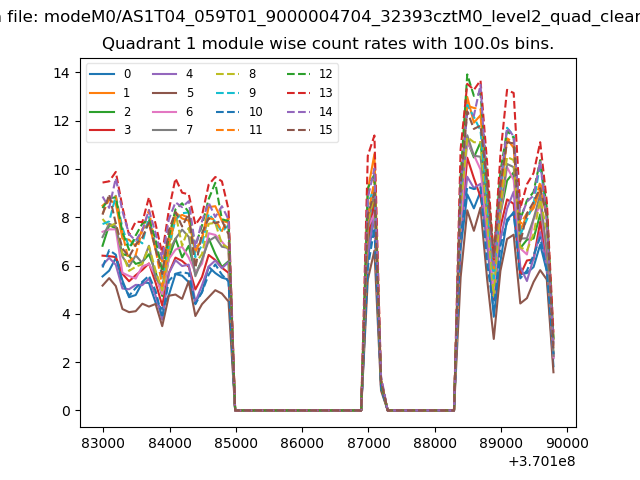 |
 |
| Module-wise count rates for Quadrant C Data is divided into 100 sec bins |
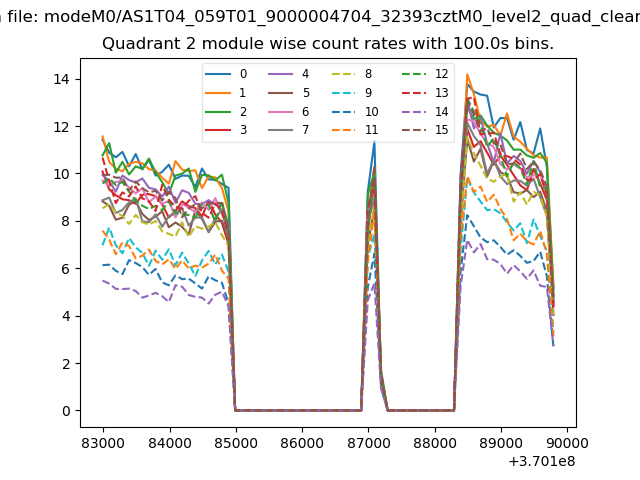 |
 |
| Module-wise count rates for Quadrant D Data is divided into 100 sec bins |
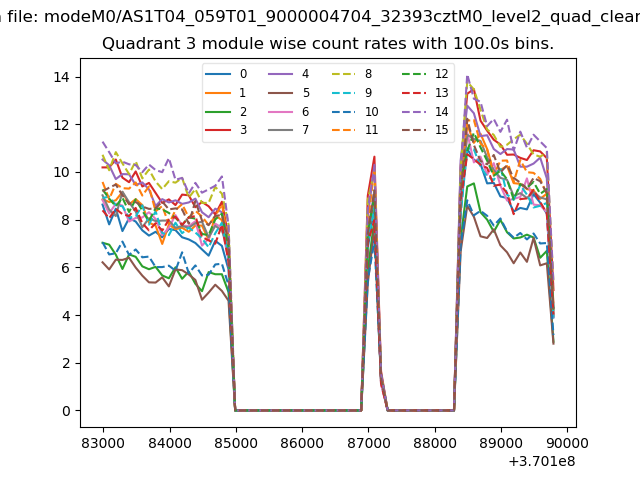 |
 |
| Parameter | Plot |
|---|---|
| CZT HV Monitor | 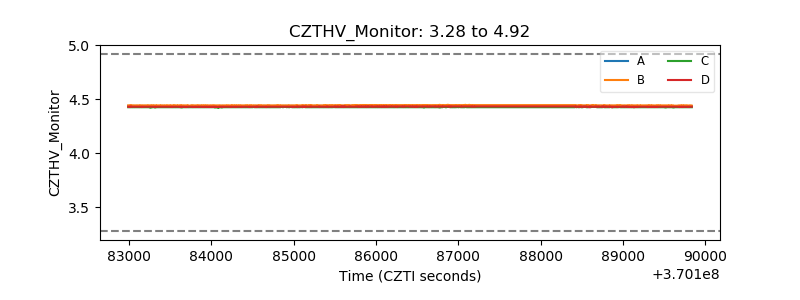 |
| D_VDD | 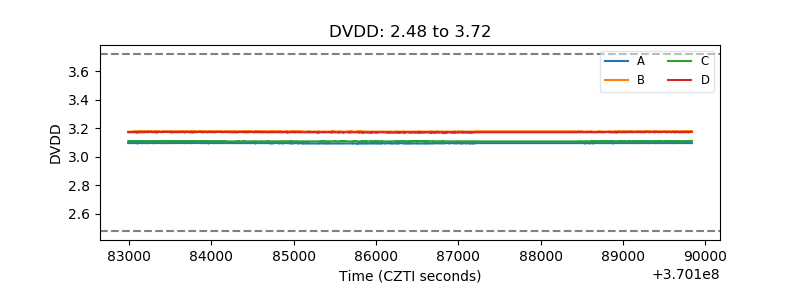 |
| Temperature 1 | 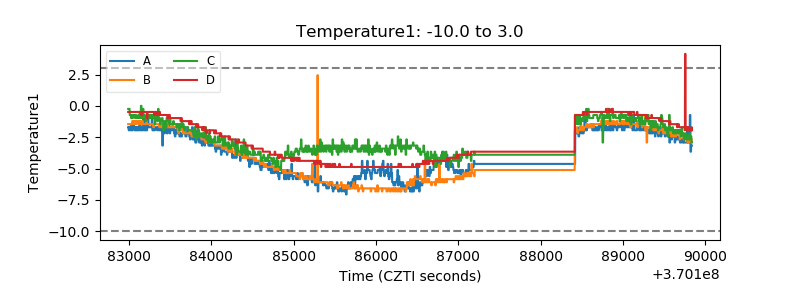 |
| Veto HV Monitor | 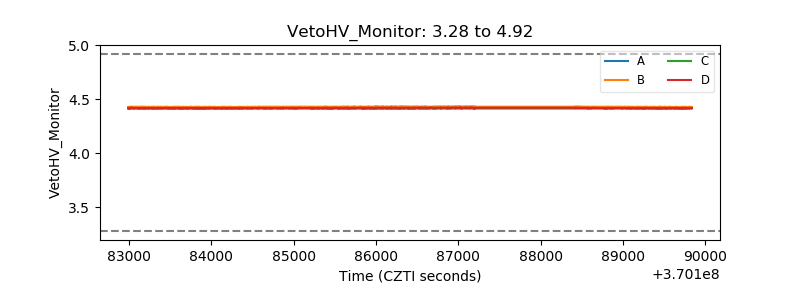 |
| Veto LLD | 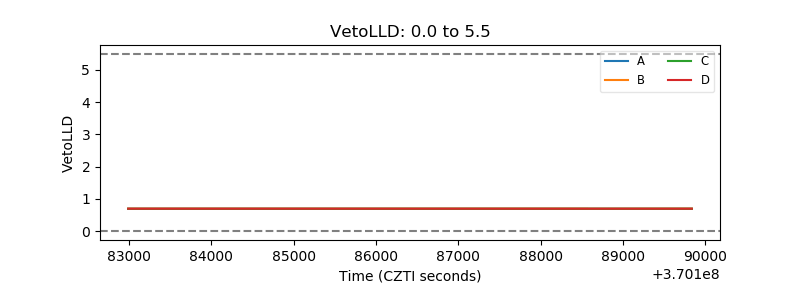 |
| Alpha Counter | 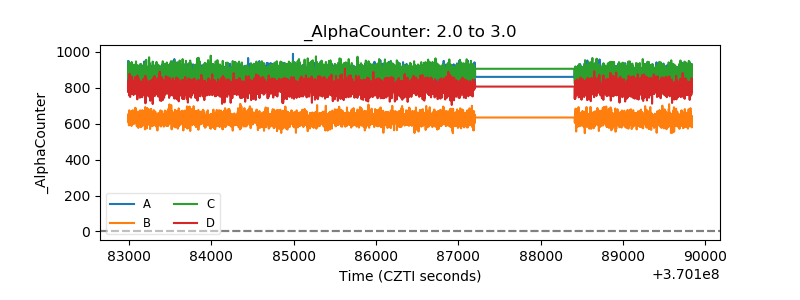 |
| _CPM_Rate | 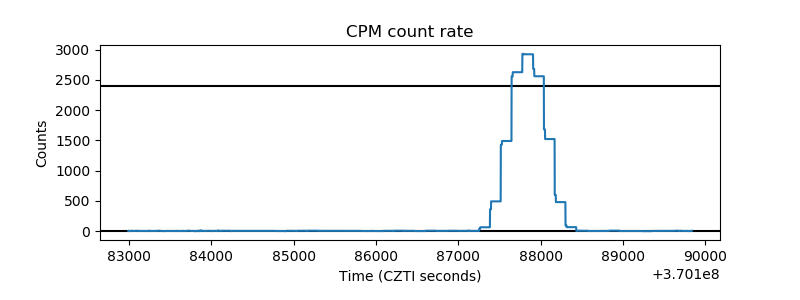 |
| CZT Counter | 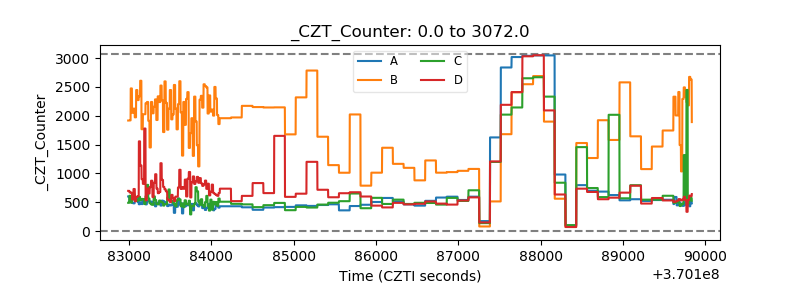 |
| +2.5 Volts monitor |  |
| +5 Volts monitor |  |
| _ROLL_ROT | 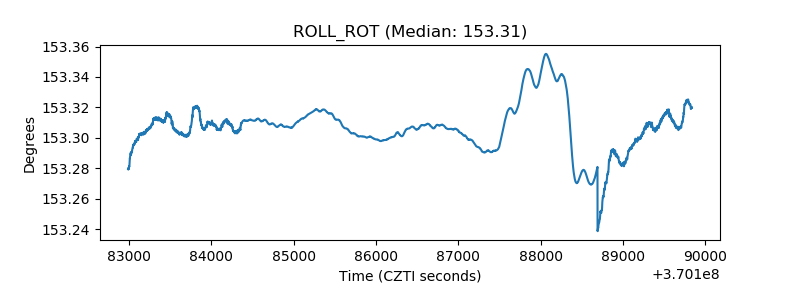 |
| _Roll_DEC | 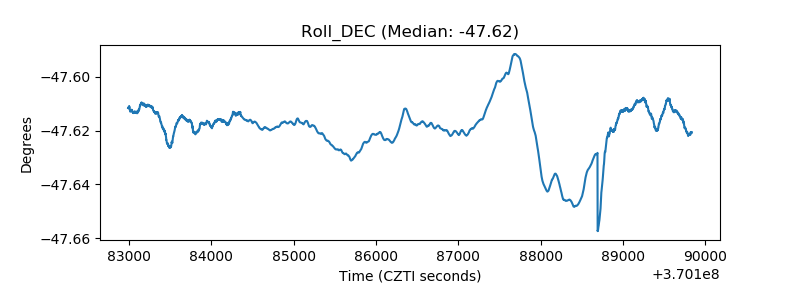 |
| _Roll_RA | 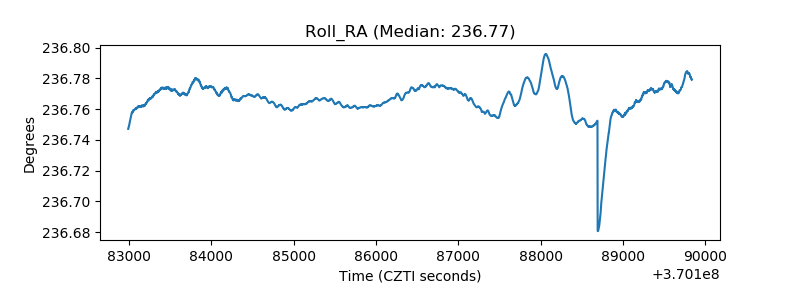 |
| Veto Counter | 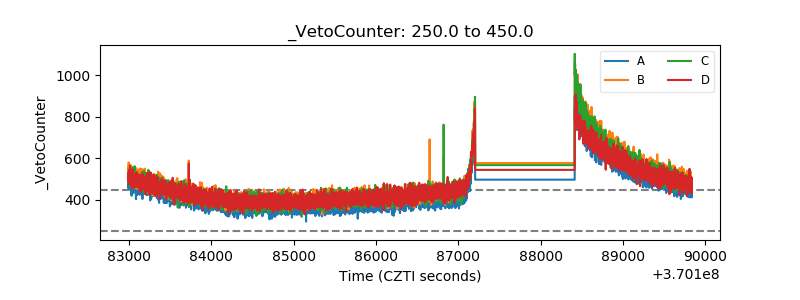 |