| Param | Original file | Final file |
|---|---|---|
| Filename | modeM0/AS1T04_059T01_9000004704_32394cztM0_level2.evt | modeM0/AS1T04_059T01_9000004704_32394cztM0_level2_quad_clean.evt |
| Size (bytes) | 782,599,680 | 81,164,160 |
| Size | 746.3 MB | 77.4 MB |
| Events in quadrant A | 3,535,130 | 581,532 |
| Events in quadrant B | 10,253,724 | 427,770 |
| Events in quadrant C | 5,855,242 | 508,146 |
| Events in quadrant D | 3,670,340 | 537,917 |
| Mode M0 | |||
|---|---|---|---|
| Quadrant | BADHDUFLAG | Total packets | Discarded packets |
| A | 0 | 14157 | 2 |
| B | 0 | 34434 | 1 |
| C | 0 | 21243 | 1 |
| D | 0 | 14504 | 1 |
| Mode M9 | |||
|---|---|---|---|
| Quadrant | BADHDUFLAG | Total packets | Discarded packets |
| A | 0 | 13 | 0 |
| B | 0 | 13 | 0 |
| C | 0 | 13 | 0 |
| D | 0 | 13 | 0 |
| Mode SS | |||
|---|---|---|---|
| Quadrant | BADHDUFLAG | Total packets | Discarded packets |
| A | 0 | 116 | 0 |
| B | 0 | 116 | 0 |
| C | 0 | 116 | 0 |
| D | 0 | 116 | 0 |
| Quadrant | Total seconds | Saturated seconds | Saturation percentage |
|---|---|---|---|
| A | 5737 | 196 | 3.416420% |
| B | 5737 | 2693 | 46.940910% |
| C | 5737 | 1198 | 20.881994% |
| D | 5737 | 123 | 2.143978% |
Noise dominated data is calculated using 1-second bins in cleaned event files. If a bin has >2000 counts, and if more than 50% of those come from <1% of pixels, then it is considered to be noise-dominated and hence unusable.
| Quadrant | # 1 sec bins | Bins with >0 counts | Bins with >2000 counts | High rate bins dominated by noise | Noise dominated (total time) | Noise dominated (detector-on time) | Marked lightcurve |
|---|---|---|---|---|---|---|---|
| A | 7027 | 5738 | 142 | 142 | 2.02% | 2.47% | 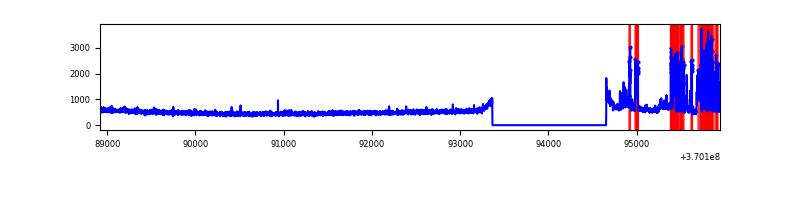 |
| B | 7027 | 5738 | 2122 | 2122 | 30.20% | 36.98% | 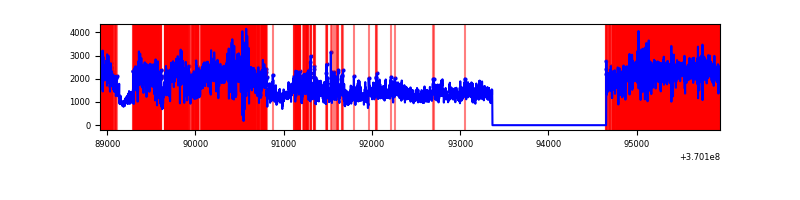 |
| C | 7027 | 5738 | 768 | 768 | 10.93% | 13.38% | 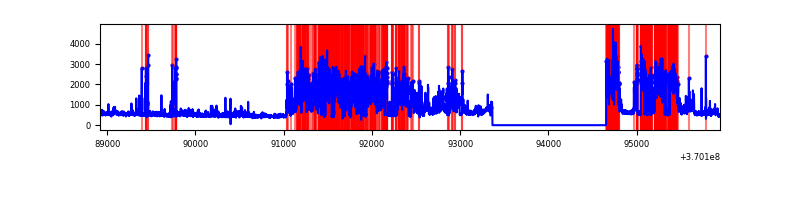 |
| D | 7027 | 5738 | 81 | 81 | 1.15% | 1.41% | 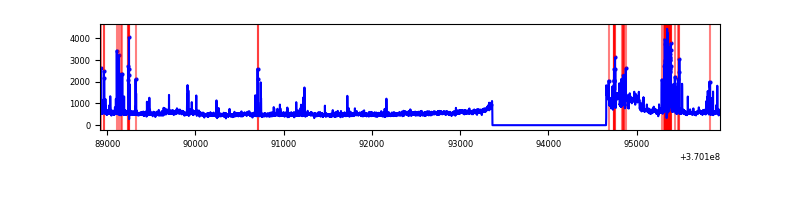 |
Top three noisy pixels from each quadrant. If the there are fewer than three noisy pixels in the level2.evt file, extra rows are filled as -1
| Pixel properties | Quadrant properties | ||||||
|---|---|---|---|---|---|---|---|
| Quadrant | DetID | PixID | Counts | Sigma | Mean | Median | Sigma |
| A | 0 | 6 | 603933 | 4047.16 | 747 | 734 | 149.0 |
| A | 0 | 226 | 42952 | 283.26 | 747 | 734 | 149.0 |
| A | 13 | 6 | 11020 | 69.01 | 747 | 734 | 149.0 |
| B | 4 | 80 | 5154896 | 43566.37 | 626 | 612 | 118.3 |
| B | 6 | 159 | 1406738 | 11885.22 | 626 | 612 | 118.3 |
| B | 5 | 172 | 616912 | 5209.25 | 626 | 612 | 118.3 |
| C | 3 | 233 | 2733162 | 18431.52 | 642 | 646 | 148.3 |
| C | 0 | 10 | 422884 | 2848.1 | 642 | 646 | 148.3 |
| C | 14 | 238 | 117762 | 789.98 | 642 | 646 | 148.3 |
| D | 8 | 195 | 531277 | 3135.09 | 707 | 688 | 169.2 |
| D | 13 | 249 | 197025 | 1160.1 | 707 | 688 | 169.2 |
| D | 1 | 47 | 73608 | 430.86 | 707 | 688 | 169.2 |
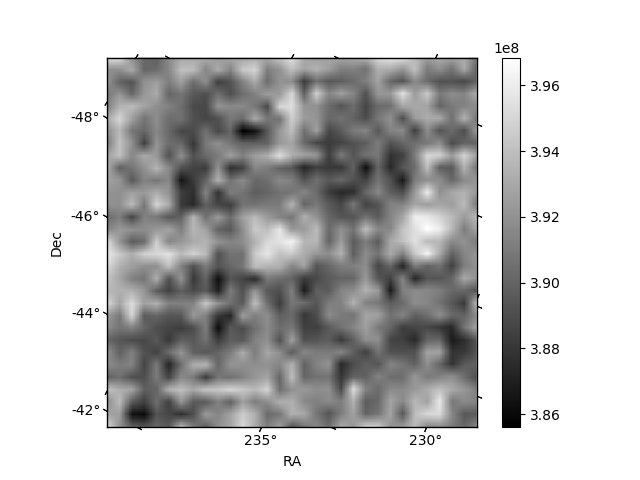
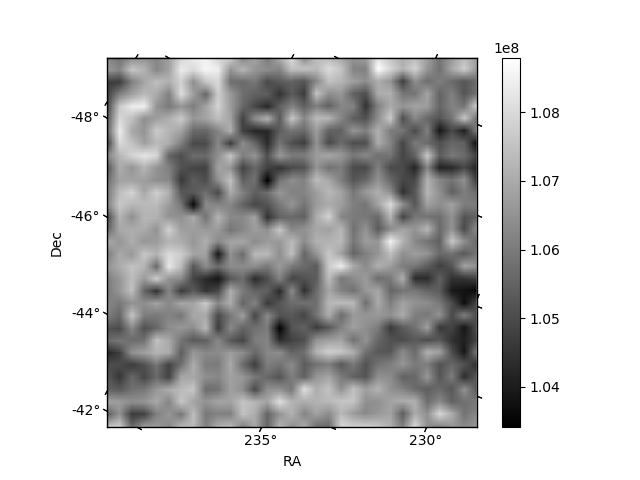
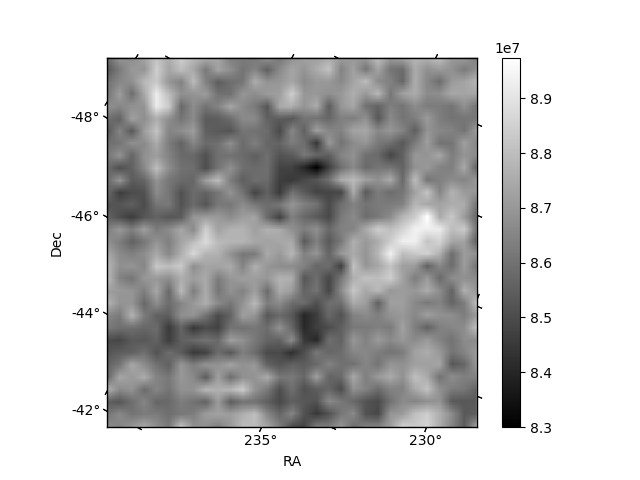
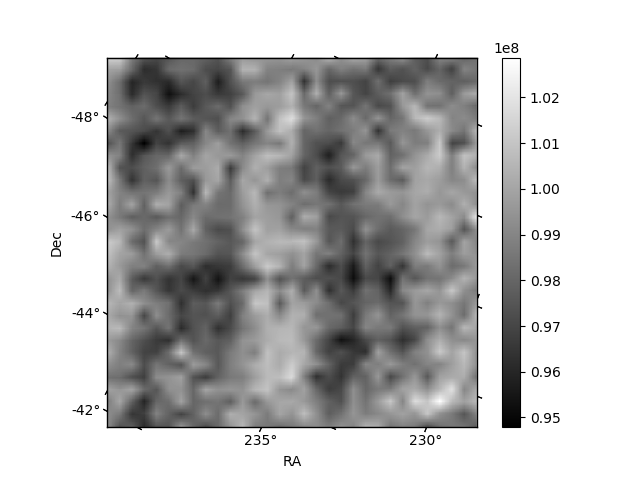
Histogram calculated using DETX and DETY for each event in the final _common_clean file
| Quadrant A | 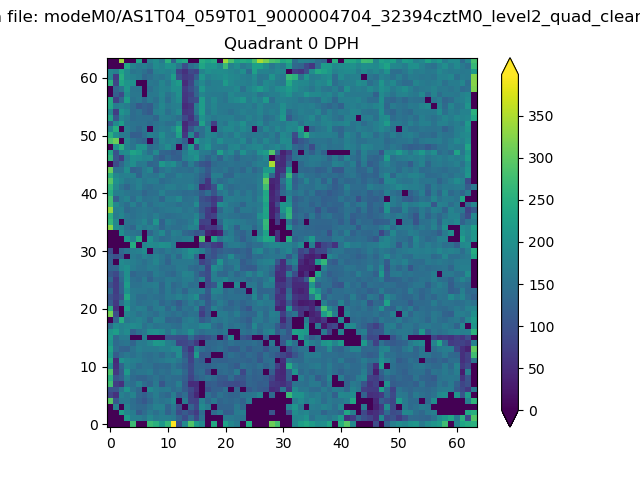 |
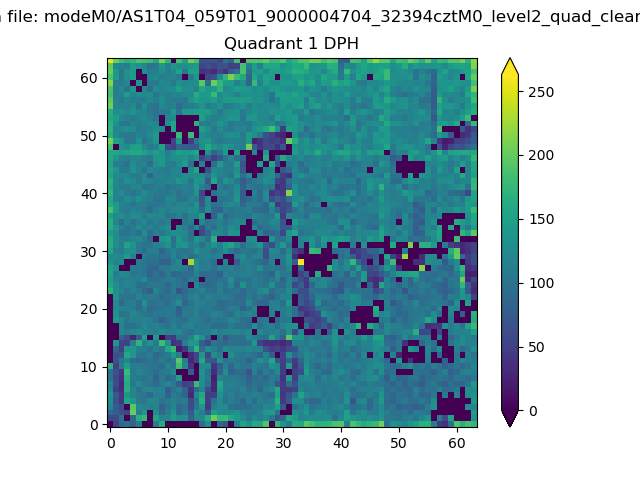 |
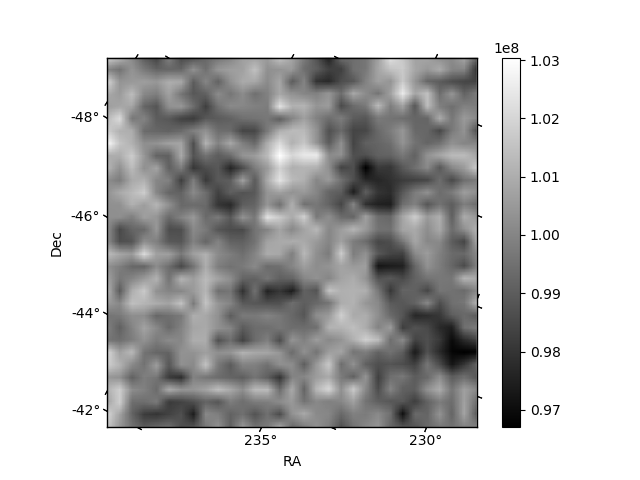
Quadrant B |
|---|---|---|---|
| Quadrant D | 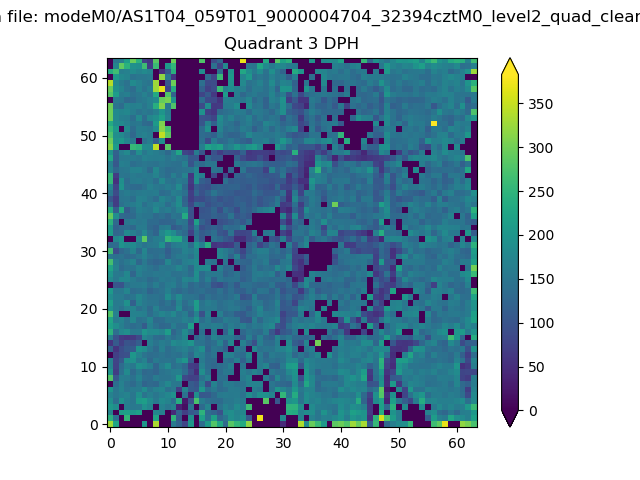 |
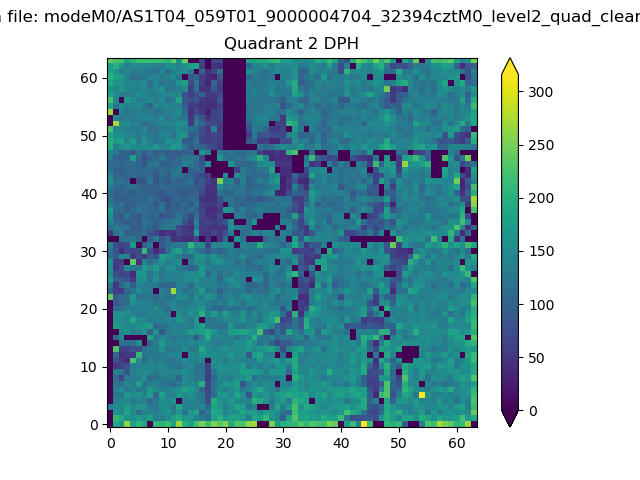 |
Quadrant C |
| Plot type | Count rate plots | Images |
|---|---|---|
| Comparison with Poisson distribution Blue bars denote a histogram of data divided into 1 sec bins. Red curve is a Poisson curve with rate = median count rate of data. |
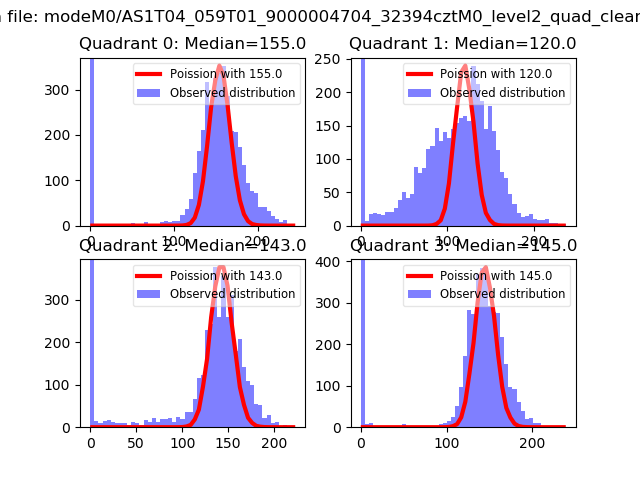 |
 |
| Quadrant-wise count rates Data is divided into 100 sec bins |
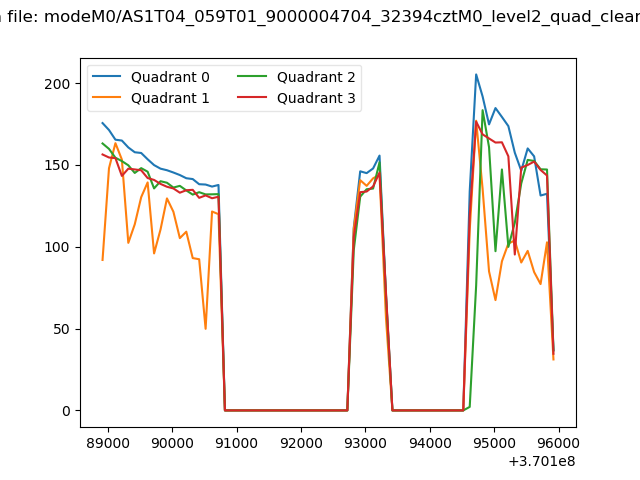 |
|
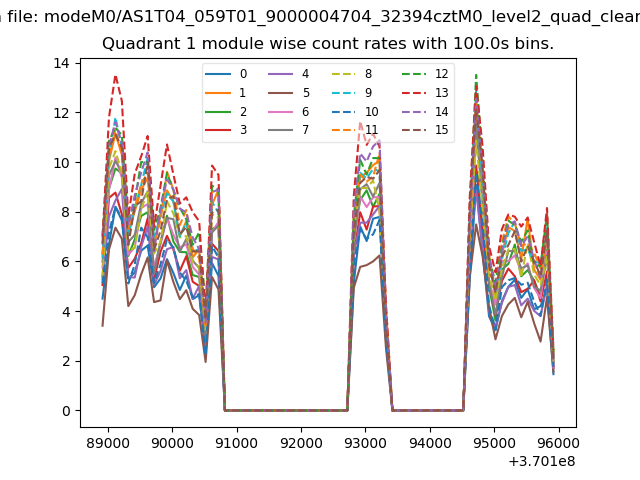
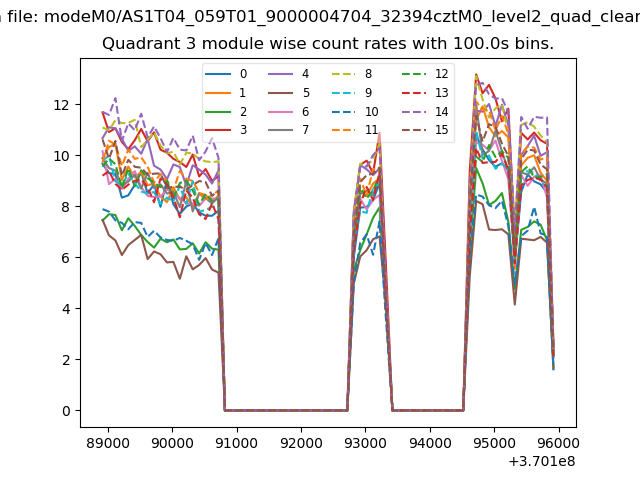
| Module-wise count rates for Quadrant A Data is divided into 100 sec bins |
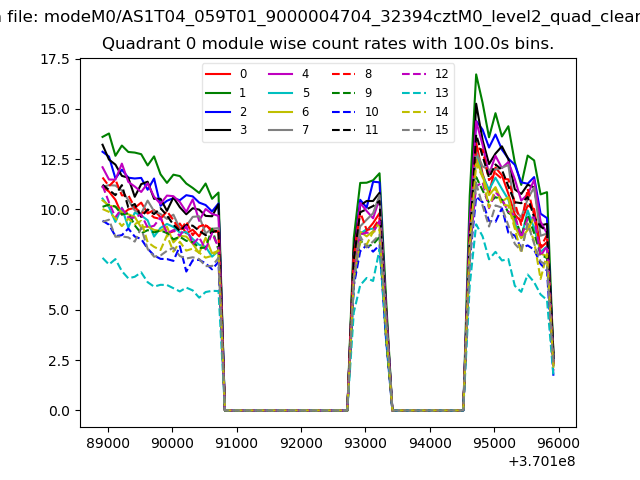 |
 |
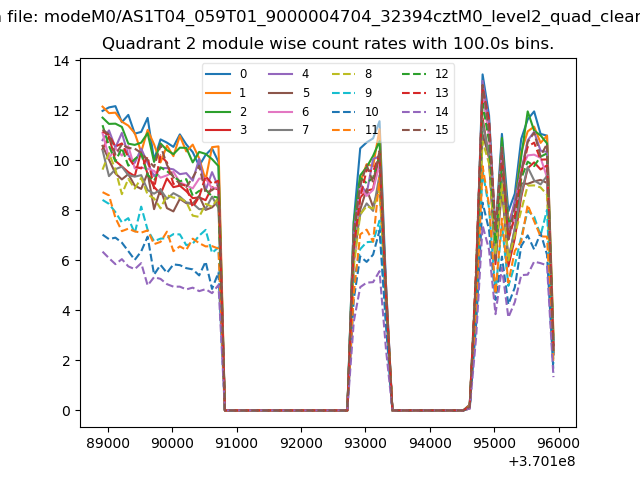
| Module-wise count rates for Quadrant B Data is divided into 100 sec bins |
 |
 |
| Module-wise count rates for Quadrant C Data is divided into 100 sec bins |
 |
 |
| Module-wise count rates for Quadrant D Data is divided into 100 sec bins |
 |
 |
| Parameter | Plot |
|---|---|
| CZT HV Monitor | 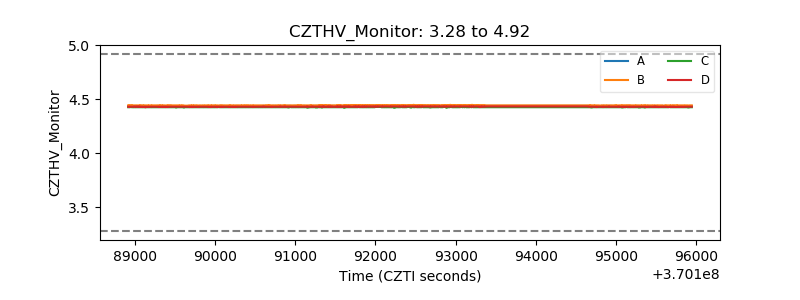 |
| D_VDD | 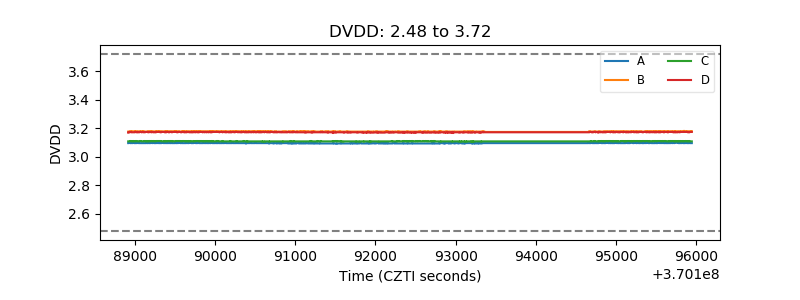 |
| Temperature 1 | 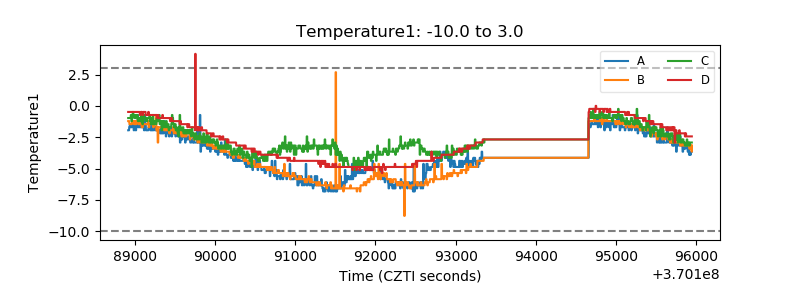 |
| Veto HV Monitor | 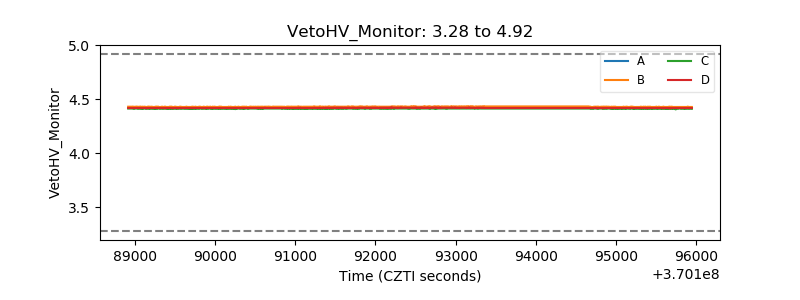 |
| Veto LLD | 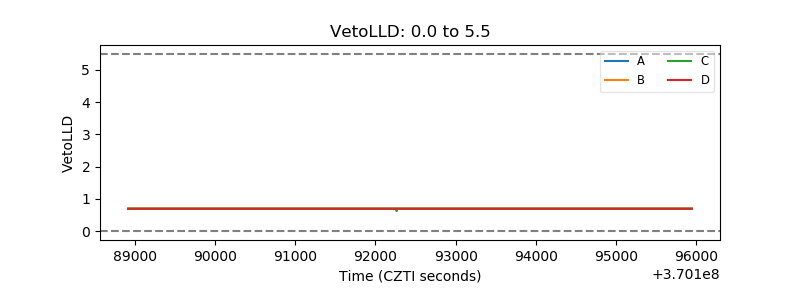 |
| Alpha Counter | 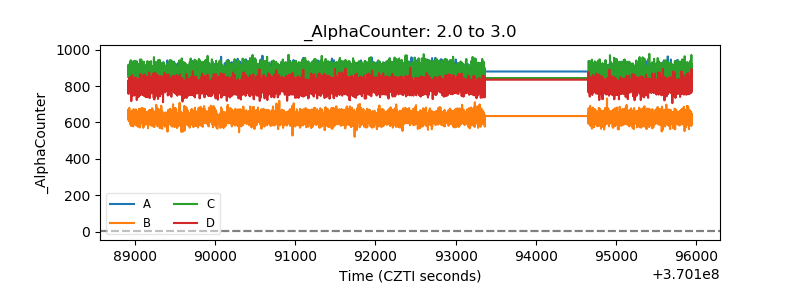 |
| _CPM_Rate | 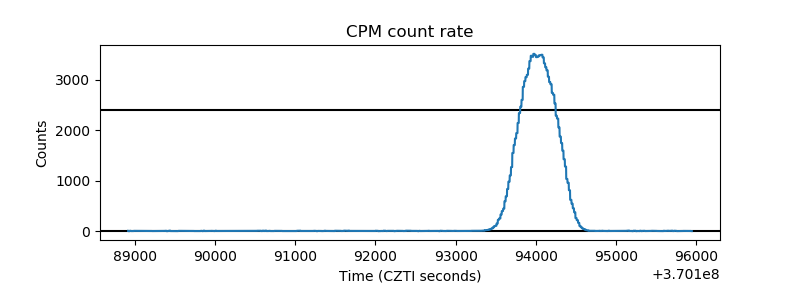 |
| CZT Counter | 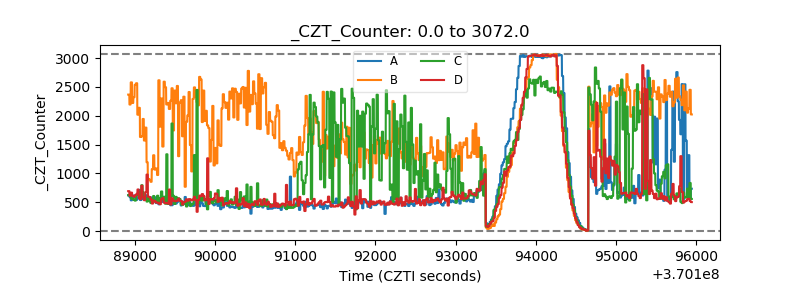 |
| +2.5 Volts monitor | 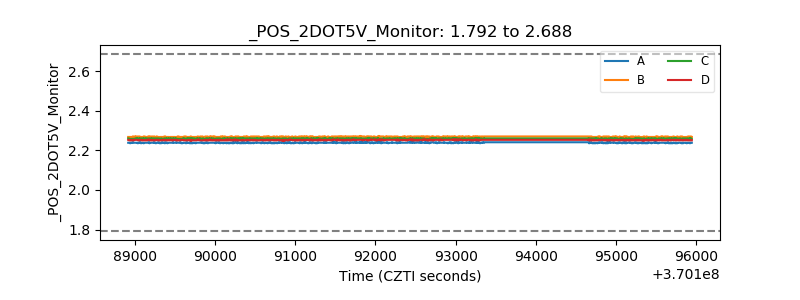 |
| +5 Volts monitor |  |
| _ROLL_ROT | 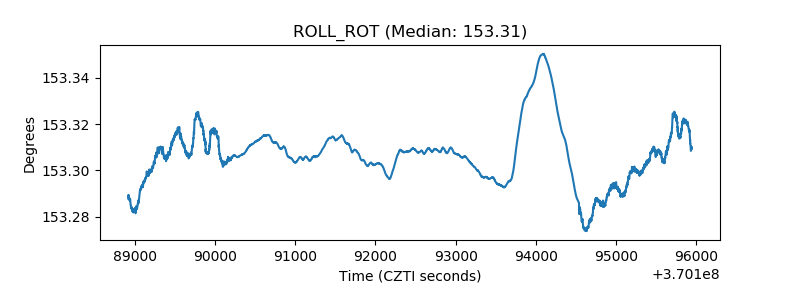 |
| _Roll_DEC | 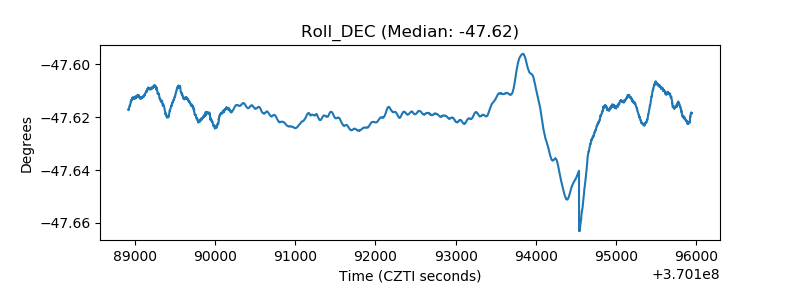 |
| _Roll_RA | 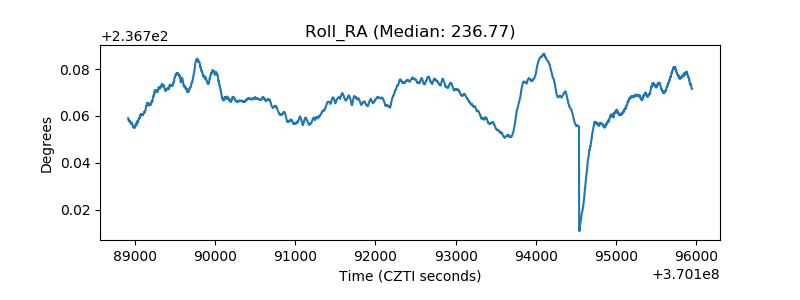 |
| Veto Counter | 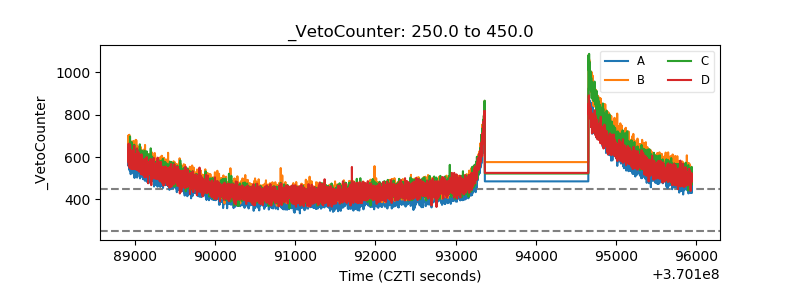 |