| Param | Original file | Final file |
|---|---|---|
| Filename | modeM0/AS1T04_059T01_9000004704_32395cztM0_level2.evt | modeM0/AS1T04_059T01_9000004704_32395cztM0_level2_quad_clean.evt |
| Size (bytes) | 784,013,760 | 77,561,280 |
| Size | 747.7 MB | 74.0 MB |
| Events in quadrant A | 3,488,590 | 559,931 |
| Events in quadrant B | 11,137,316 | 383,671 |
| Events in quadrant C | 4,290,249 | 510,623 |
| Events in quadrant D | 4,449,027 | 500,378 |
| Mode M0 | |||
|---|---|---|---|
| Quadrant | BADHDUFLAG | Total packets | Discarded packets |
| A | 0 | 13863 | 2 |
| B | 0 | 36975 | 1 |
| C | 0 | 16654 | 1 |
| D | 0 | 17080 | 1 |
| Mode M9 | |||
|---|---|---|---|
| Quadrant | BADHDUFLAG | Total packets | Discarded packets |
| A | 0 | 13 | 0 |
| B | 0 | 13 | 0 |
| C | 0 | 13 | 0 |
| D | 0 | 13 | 0 |
| Mode SS | |||
|---|---|---|---|
| Quadrant | BADHDUFLAG | Total packets | Discarded packets |
| A | 0 | 114 | 0 |
| B | 0 | 114 | 0 |
| C | 0 | 114 | 0 |
| D | 0 | 114 | 0 |
| Quadrant | Total seconds | Saturated seconds | Saturation percentage |
|---|---|---|---|
| A | 5610 | 168 | 2.994652% |
| B | 5610 | 3770 | 67.201426% |
| C | 5610 | 411 | 7.326203% |
| D | 5610 | 323 | 5.757576% |
Noise dominated data is calculated using 1-second bins in cleaned event files. If a bin has >2000 counts, and if more than 50% of those come from <1% of pixels, then it is considered to be noise-dominated and hence unusable.
| Quadrant | # 1 sec bins | Bins with >0 counts | Bins with >2000 counts | High rate bins dominated by noise | Noise dominated (total time) | Noise dominated (detector-on time) | Marked lightcurve |
|---|---|---|---|---|---|---|---|
| A | 6945 | 5611 | 136 | 136 | 1.96% | 2.42% |  |
| B | 6945 | 5611 | 2988 | 2988 | 43.02% | 53.25% | 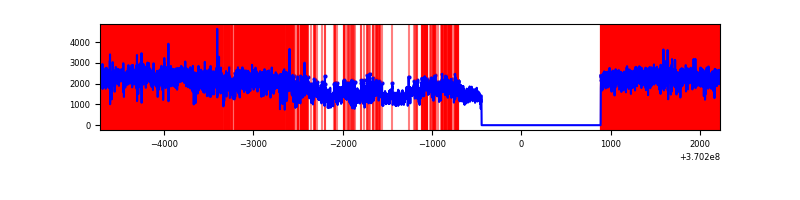 |
| C | 6945 | 5611 | 231 | 231 | 3.33% | 4.12% | 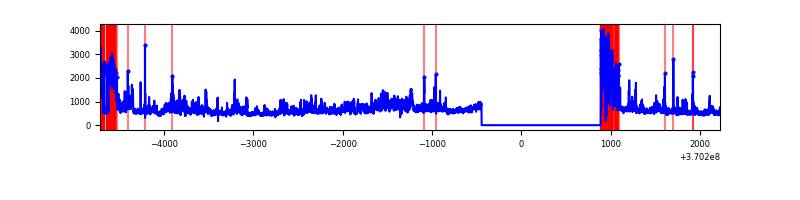 |
| D | 6945 | 5611 | 276 | 276 | 3.97% | 4.92% |  |
Top three noisy pixels from each quadrant. If the there are fewer than three noisy pixels in the level2.evt file, extra rows are filled as -1
| Pixel properties | Quadrant properties | ||||||
|---|---|---|---|---|---|---|---|
| Quadrant | DetID | PixID | Counts | Sigma | Mean | Median | Sigma |
| A | 0 | 6 | 623167 | 4238.65 | 730 | 718 | 146.9 |
| A | 0 | 226 | 43659 | 292.41 | 730 | 718 | 146.9 |
| A | 13 | 6 | 12492 | 80.18 | 730 | 718 | 146.9 |
| B | 4 | 80 | 6909810 | 63321.61 | 580 | 567 | 109.1 |
| B | 6 | 159 | 1320296 | 12095.01 | 580 | 567 | 109.1 |
| B | 5 | 172 | 260394 | 2381.25 | 580 | 567 | 109.1 |
| C | 3 | 233 | 977672 | 6350.83 | 666 | 671 | 153.8 |
| C | 0 | 10 | 500676 | 3250.2 | 666 | 671 | 153.8 |
| C | 14 | 238 | 124072 | 802.15 | 666 | 671 | 153.8 |
| D | 8 | 195 | 743900 | 4649.19 | 678 | 662 | 159.9 |
| D | 12 | 233 | 514051 | 3211.41 | 678 | 662 | 159.9 |
| D | 1 | 47 | 212282 | 1323.75 | 678 | 662 | 159.9 |
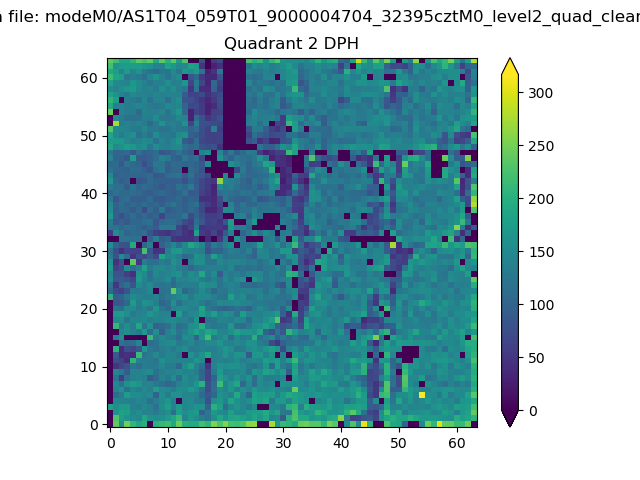
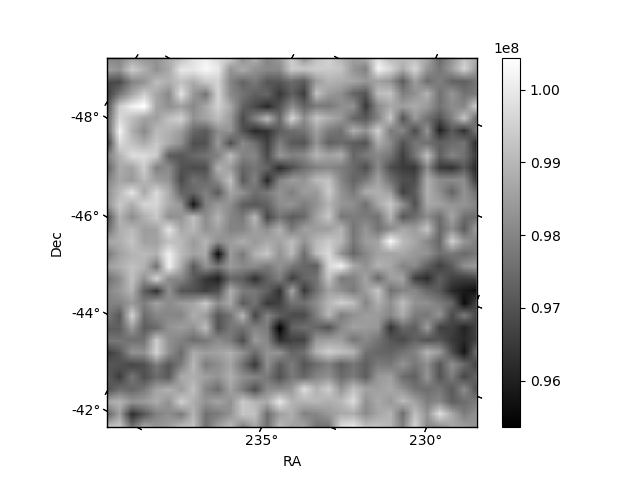
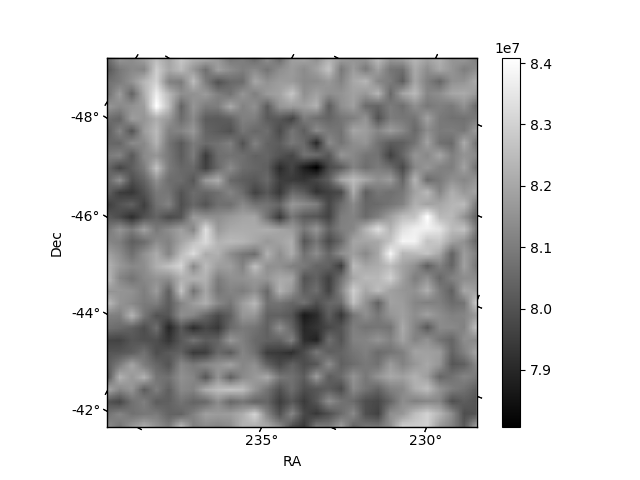
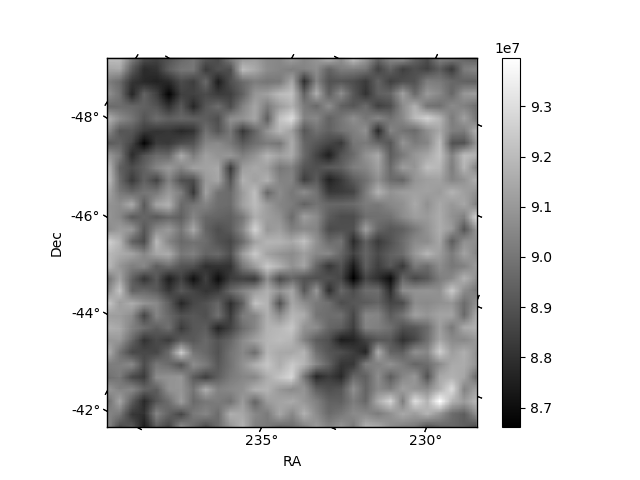
Histogram calculated using DETX and DETY for each event in the final _common_clean file
| Quadrant A | 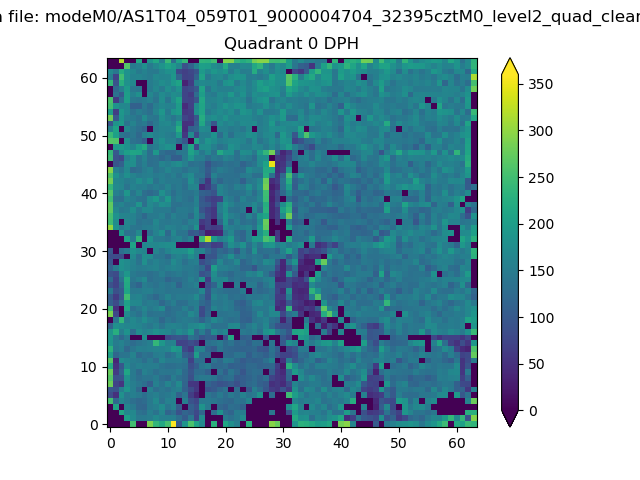 |
 |
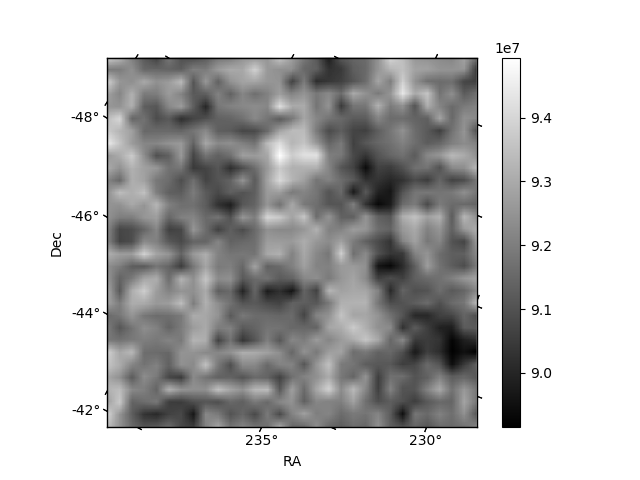
Quadrant B |
|---|---|---|---|
| Quadrant D | 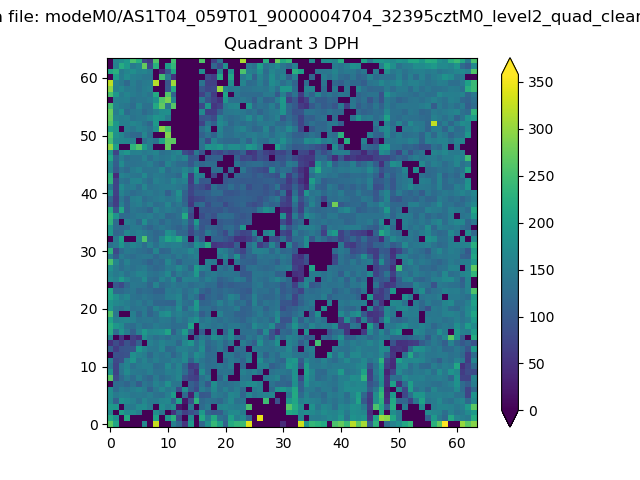 |
 |
Quadrant C |
| Plot type | Count rate plots | Images |
|---|---|---|
| Comparison with Poisson distribution Blue bars denote a histogram of data divided into 1 sec bins. Red curve is a Poisson curve with rate = median count rate of data. |
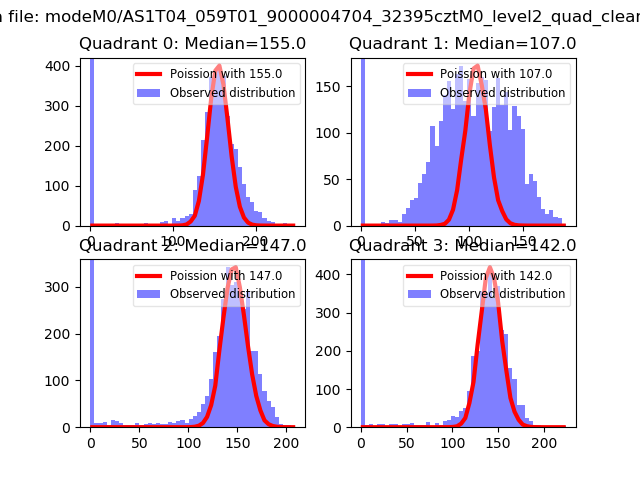 |
 |
| Quadrant-wise count rates Data is divided into 100 sec bins |
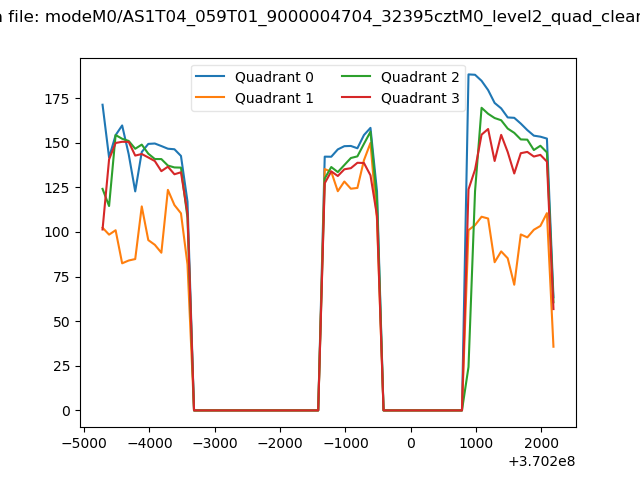 |
|
| Module-wise count rates for Quadrant A Data is divided into 100 sec bins |
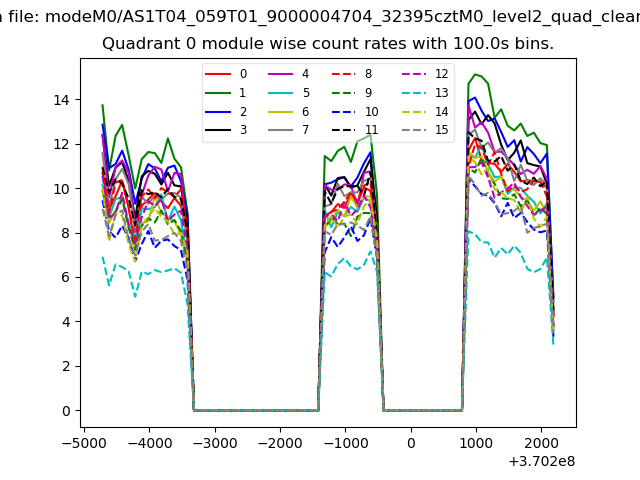 |
 |
| Module-wise count rates for Quadrant B Data is divided into 100 sec bins |
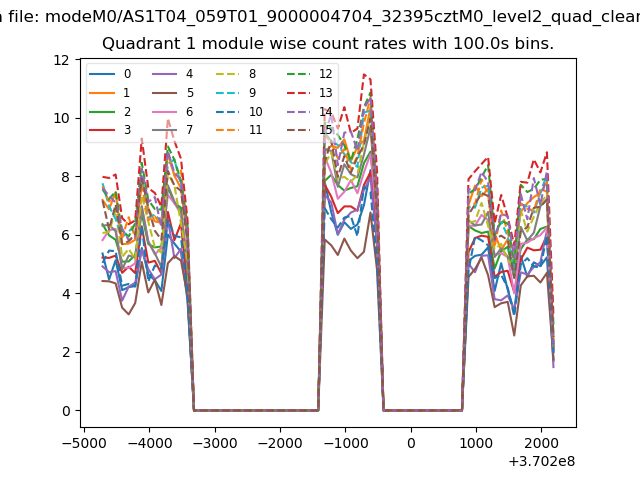 |
 |
| Module-wise count rates for Quadrant C Data is divided into 100 sec bins |
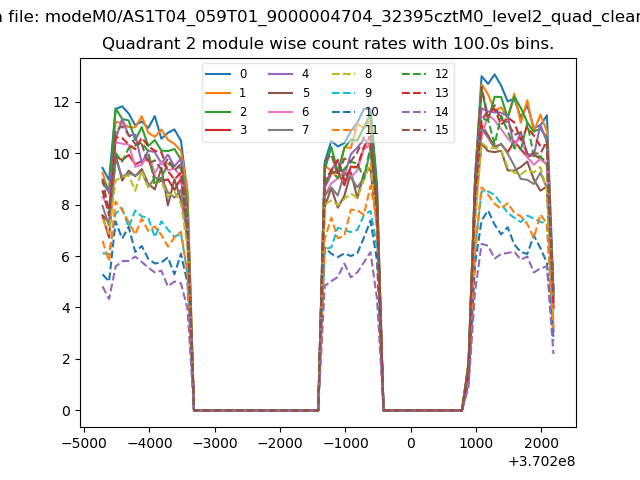 |
 |
| Module-wise count rates for Quadrant D Data is divided into 100 sec bins |
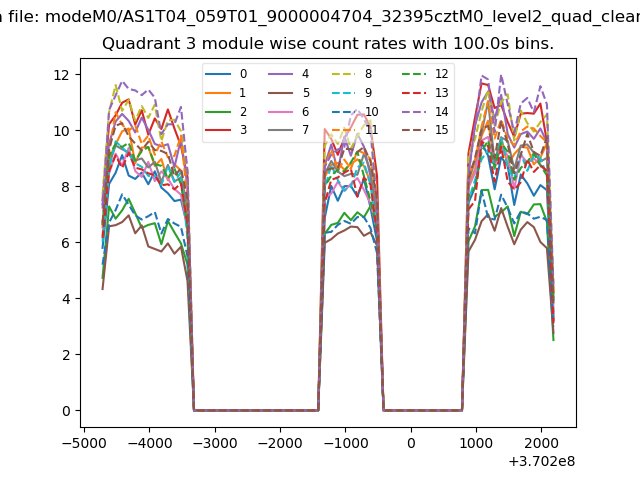 |
 |
| Parameter | Plot |
|---|---|
| CZT HV Monitor | 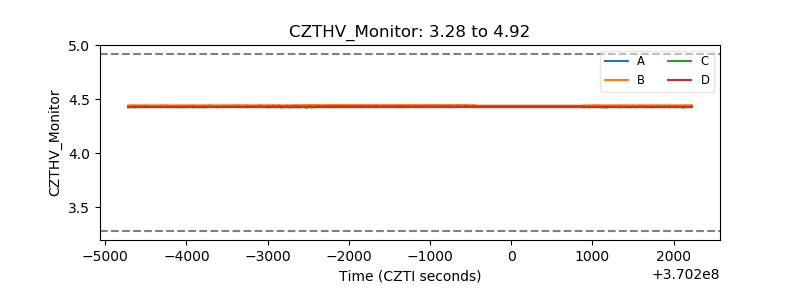 |
| D_VDD | 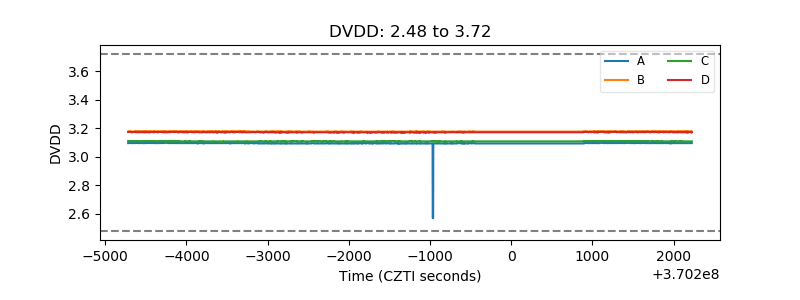 |
| Temperature 1 | 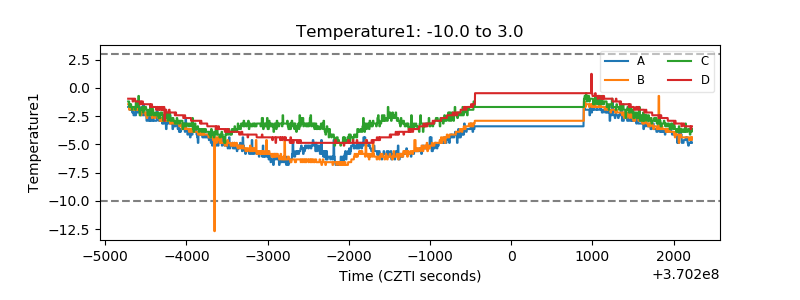 |
| Veto HV Monitor | 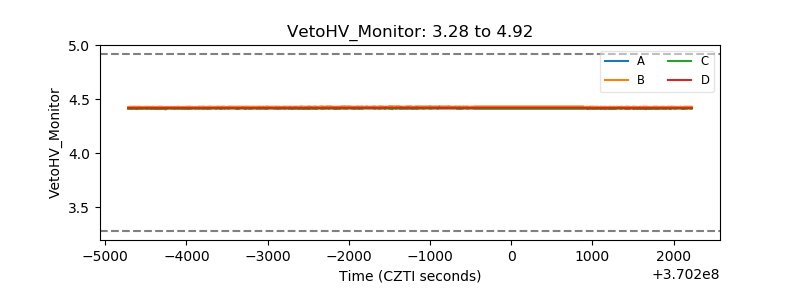 |
| Veto LLD | 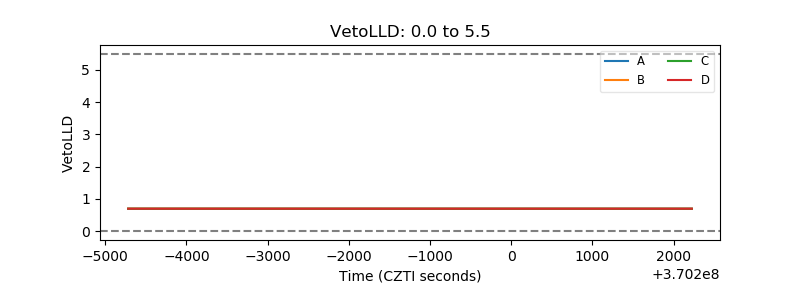 |
| Alpha Counter | 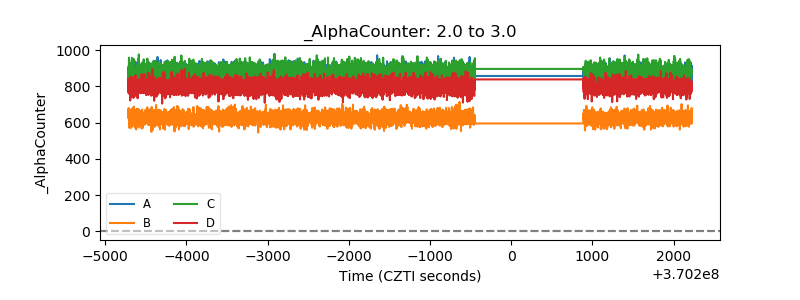 |
| _CPM_Rate | 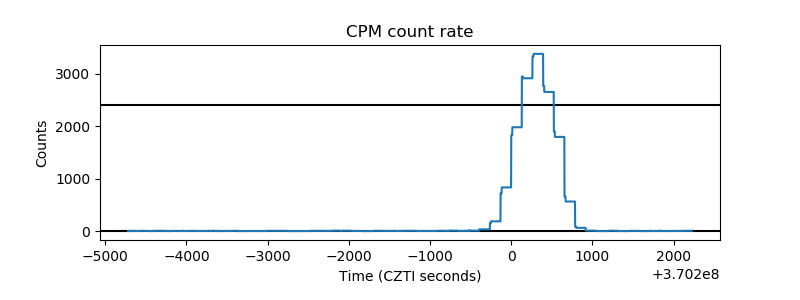 |
| CZT Counter | 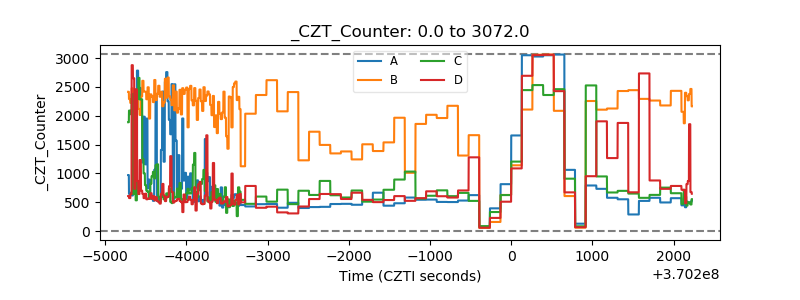 |
| +2.5 Volts monitor | 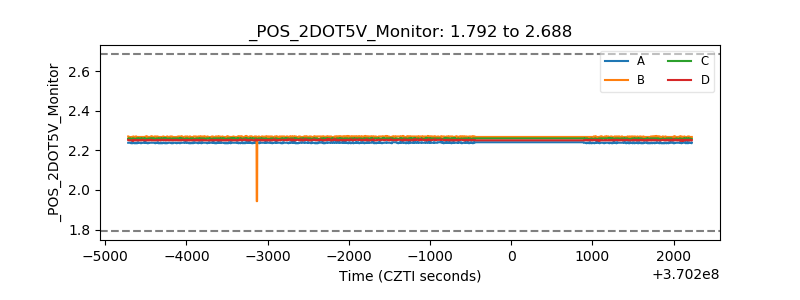 |
| +5 Volts monitor |  |
| _ROLL_ROT | 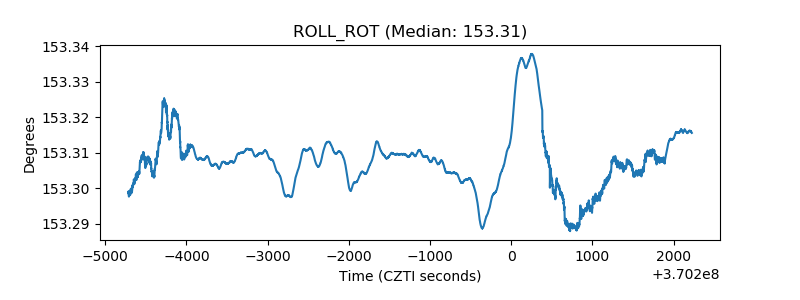 |
| _Roll_DEC | 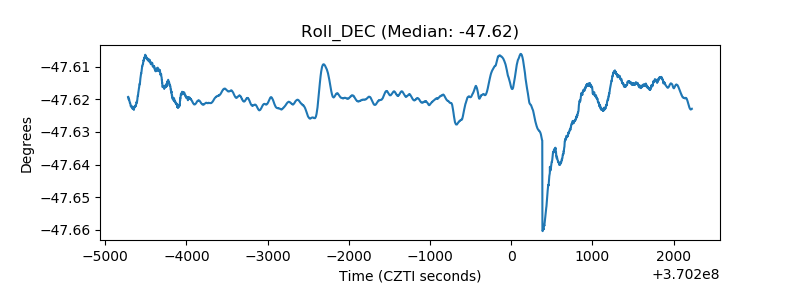 |
| _Roll_RA | 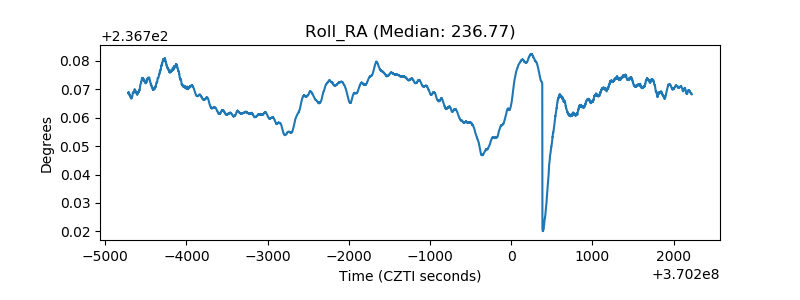 |
| Veto Counter | 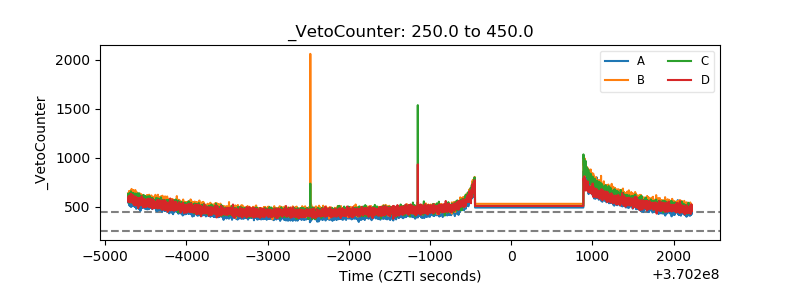 |