| Param | Original file | Final file |
|---|---|---|
| Filename | modeM0/AS1T04_059T01_9000004704_32396cztM0_level2.evt | modeM0/AS1T04_059T01_9000004704_32396cztM0_level2_quad_clean.evt |
| Size (bytes) | 809,853,120 | 88,142,400 |
| Size | 772.3 MB | 84.1 MB |
| Events in quadrant A | 3,155,353 | 641,755 |
| Events in quadrant B | 11,502,060 | 458,762 |
| Events in quadrant C | 4,468,042 | 556,659 |
| Events in quadrant D | 4,982,401 | 577,798 |
| Mode M0 | |||
|---|---|---|---|
| Quadrant | BADHDUFLAG | Total packets | Discarded packets |
| A | 0 | 13109 | 3 |
| B | 0 | 38444 | 2 |
| C | 0 | 17382 | 2 |
| D | 0 | 19204 | 2 |
| Mode M9 | |||
|---|---|---|---|
| Quadrant | BADHDUFLAG | Total packets | Discarded packets |
| A | 0 | 13 | 0 |
| B | 0 | 13 | 0 |
| C | 0 | 13 | 0 |
| D | 0 | 13 | 0 |
| Mode SS | |||
|---|---|---|---|
| Quadrant | BADHDUFLAG | Total packets | Discarded packets |
| A | 0 | 126 | 0 |
| B | 0 | 126 | 0 |
| C | 0 | 126 | 0 |
| D | 0 | 126 | 0 |
| Quadrant | Total seconds | Saturated seconds | Saturation percentage |
|---|---|---|---|
| A | 6198 | 27 | 0.435624% |
| B | 6198 | 3389 | 54.678929% |
| C | 6198 | 1157 | 18.667312% |
| D | 6198 | 239 | 3.856083% |
Noise dominated data is calculated using 1-second bins in cleaned event files. If a bin has >2000 counts, and if more than 50% of those come from <1% of pixels, then it is considered to be noise-dominated and hence unusable.
| Quadrant | # 1 sec bins | Bins with >0 counts | Bins with >2000 counts | High rate bins dominated by noise | Noise dominated (total time) | Noise dominated (detector-on time) | Marked lightcurve |
|---|---|---|---|---|---|---|---|
| A | 7518 | 6199 | 0 | 0 | 0.00% | 0.00% | 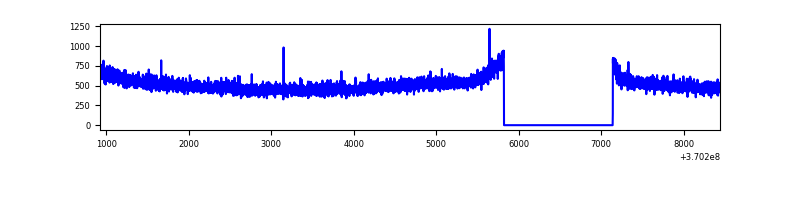 |
| B | 7518 | 6199 | 2735 | 2735 | 36.38% | 44.12% |  |
| C | 7518 | 6198 | 184 | 184 | 2.45% | 2.97% |  |
| D | 7518 | 6199 | 227 | 227 | 3.02% | 3.66% | 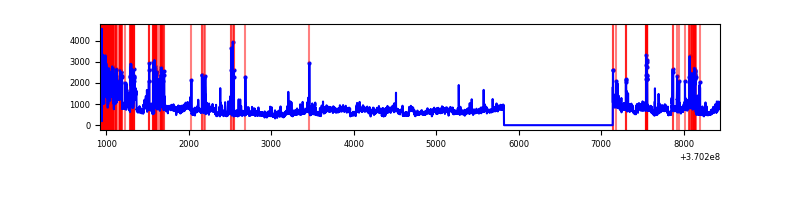 |
Top three noisy pixels from each quadrant. If the there are fewer than three noisy pixels in the level2.evt file, extra rows are filled as -1
| Pixel properties | Quadrant properties | ||||||
|---|---|---|---|---|---|---|---|
| Quadrant | DetID | PixID | Counts | Sigma | Mean | Median | Sigma |
| A | 13 | 6 | 20265 | 119.97 | 812 | 797 | 162.3 |
| A | 13 | 254 | 11497 | 65.94 | 812 | 797 | 162.3 |
| A | 3 | 137 | 7792 | 43.11 | 812 | 797 | 162.3 |
| B | 4 | 80 | 6511993 | 52622.81 | 664 | 649 | 123.7 |
| B | 6 | 159 | 1506665 | 12171.18 | 664 | 649 | 123.7 |
| B | 5 | 172 | 480557 | 3878.47 | 664 | 649 | 123.7 |
| C | 3 | 233 | 554444 | 3507.31 | 683 | 688 | 157.9 |
| C | 0 | 10 | 473353 | 2993.71 | 683 | 688 | 157.9 |
| C | 14 | 238 | 338472 | 2139.41 | 683 | 688 | 157.9 |
| D | 8 | 195 | 1233530 | 6836.39 | 758 | 740 | 180.3 |
| D | 12 | 233 | 479941 | 2657.39 | 758 | 740 | 180.3 |
| D | 1 | 47 | 181949 | 1004.89 | 758 | 740 | 180.3 |
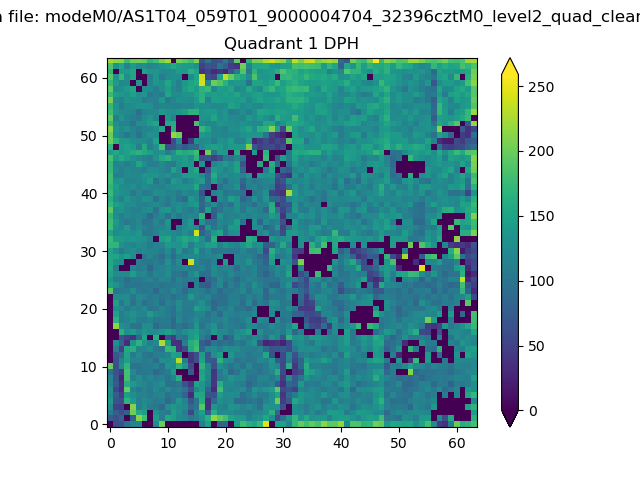
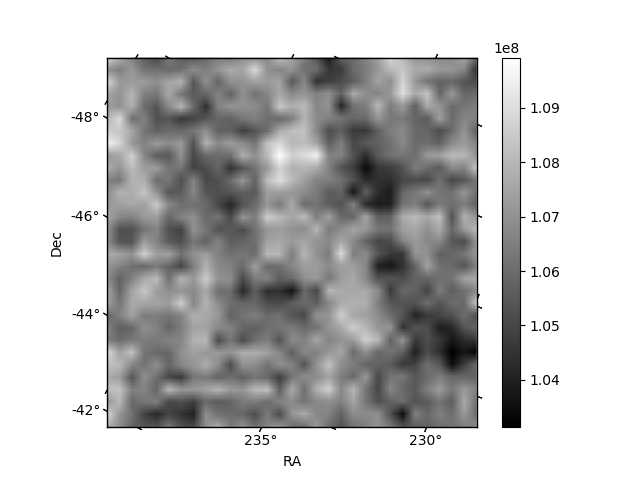
Histogram calculated using DETX and DETY for each event in the final _common_clean file
| Quadrant A |  |
 |
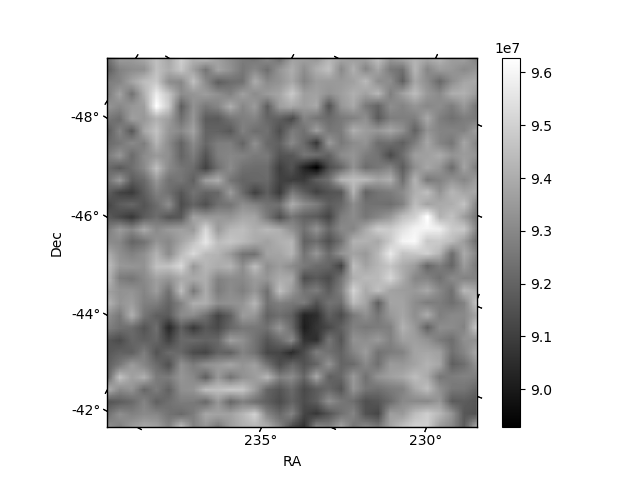
Quadrant B |
|---|---|---|---|
| Quadrant D | 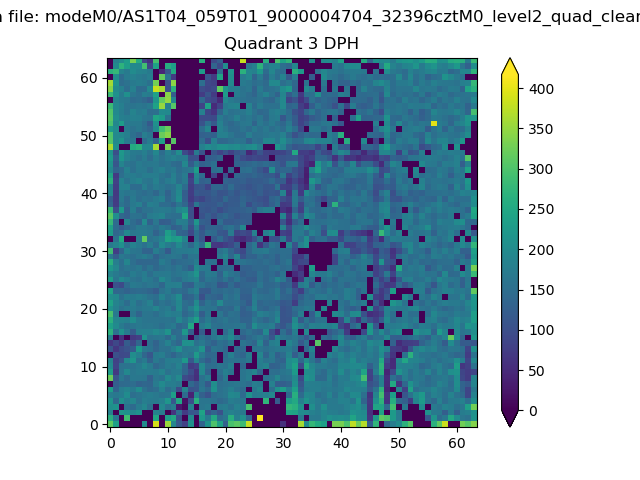 |
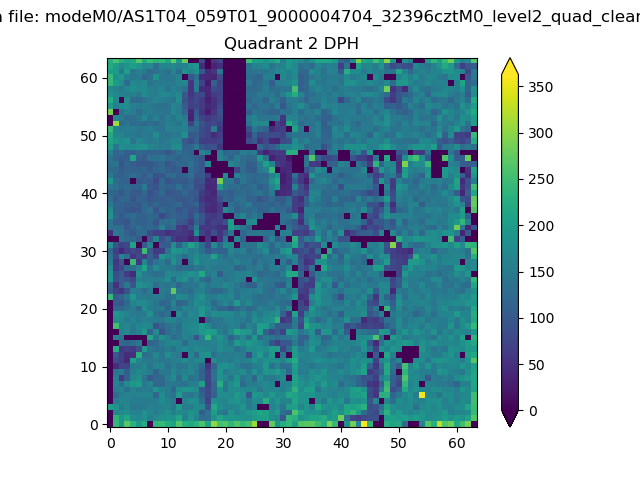 |
Quadrant C |
| Plot type | Count rate plots | Images |
|---|---|---|
| Comparison with Poisson distribution Blue bars denote a histogram of data divided into 1 sec bins. Red curve is a Poisson curve with rate = median count rate of data. |
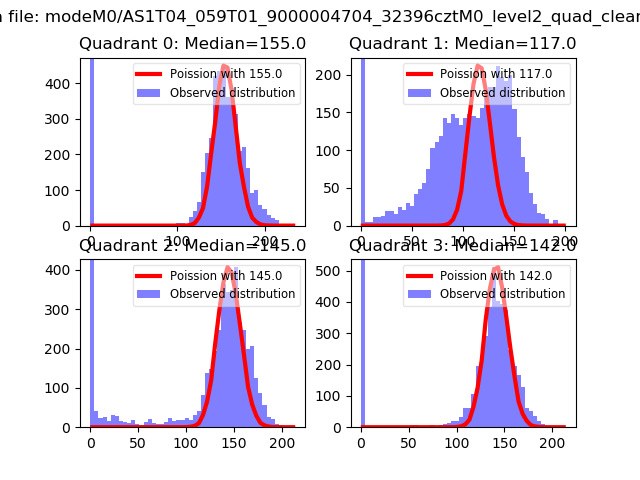 |
 |
| Quadrant-wise count rates Data is divided into 100 sec bins |
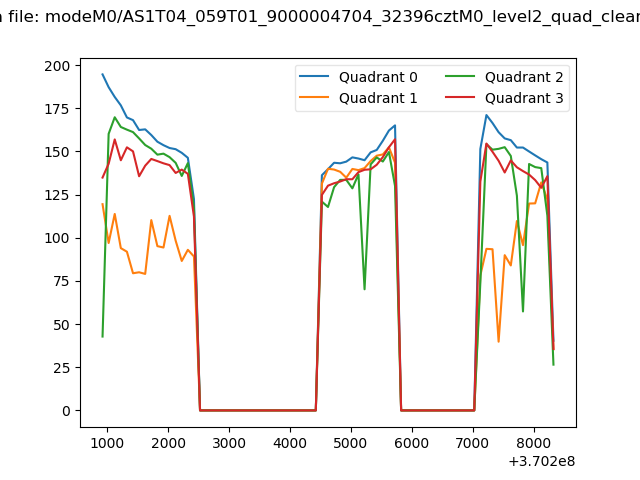 |
|
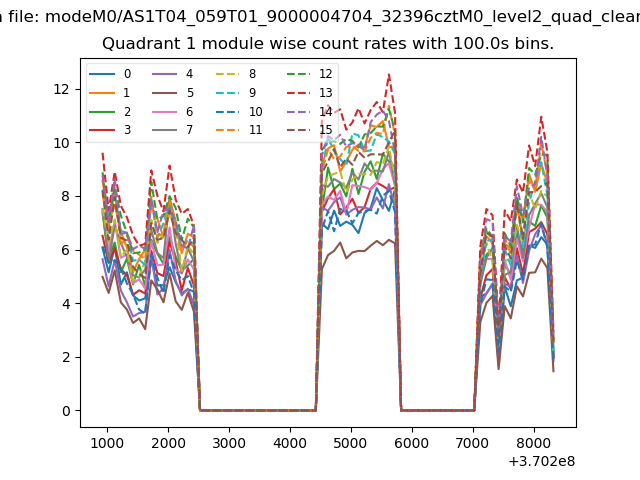
| Module-wise count rates for Quadrant A Data is divided into 100 sec bins |
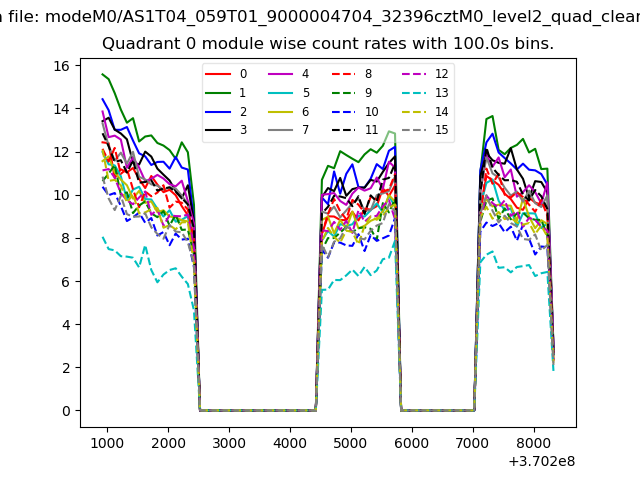 |
 |
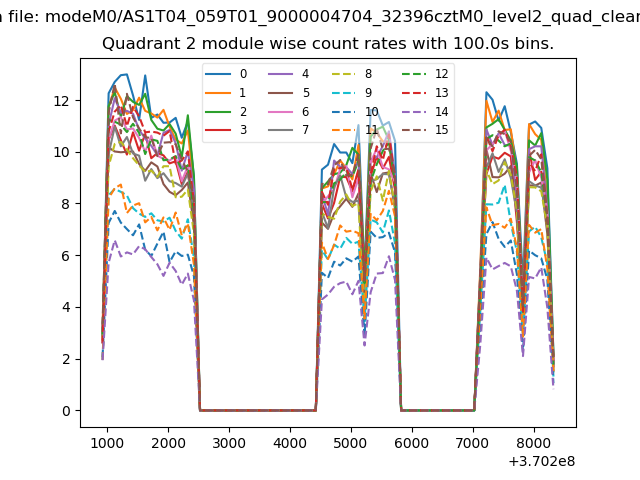
| Module-wise count rates for Quadrant B Data is divided into 100 sec bins |
 |
 |
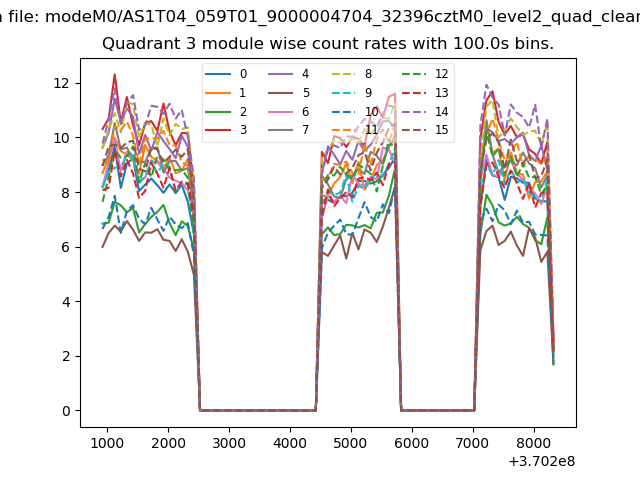
| Module-wise count rates for Quadrant C Data is divided into 100 sec bins |
 |
 |
| Module-wise count rates for Quadrant D Data is divided into 100 sec bins |
 |
 |
| Parameter | Plot |
|---|---|
| CZT HV Monitor |  |
| D_VDD | 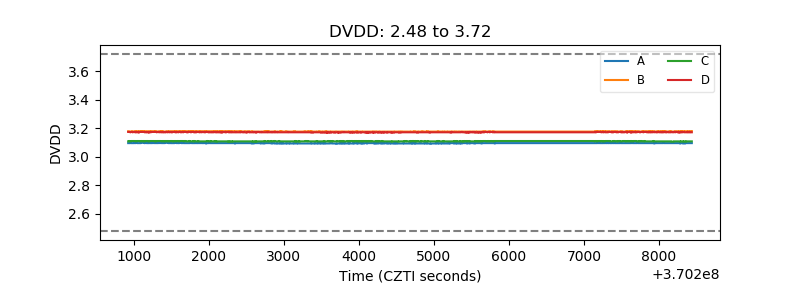 |
| Temperature 1 | 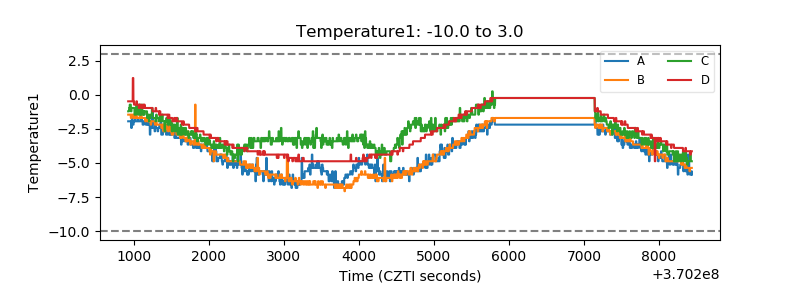 |
| Veto HV Monitor | 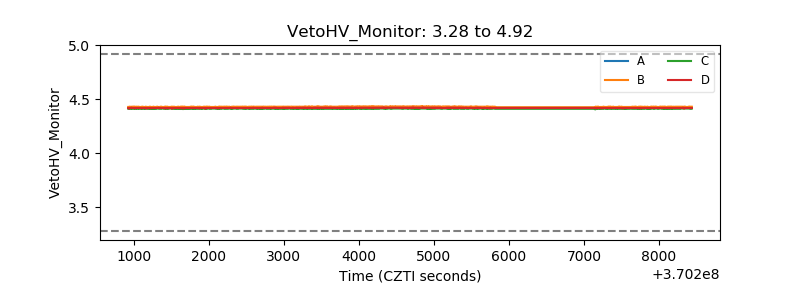 |
| Veto LLD | 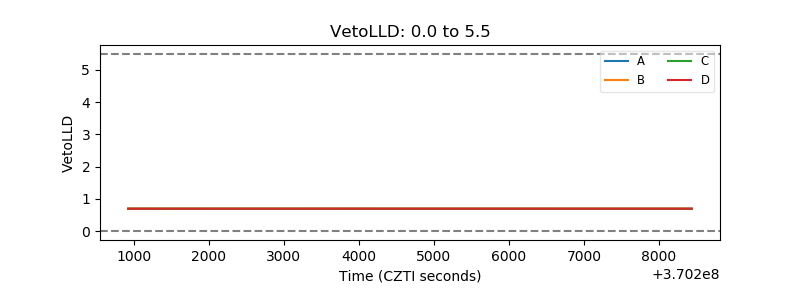 |
| Alpha Counter | 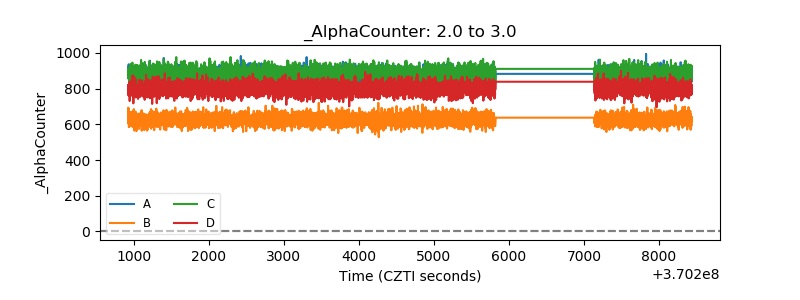 |
| _CPM_Rate | 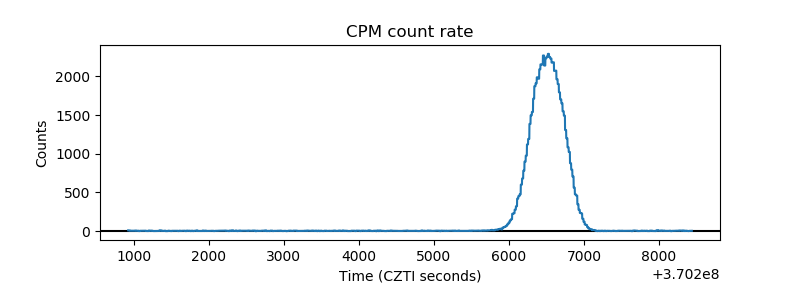 |
| CZT Counter | 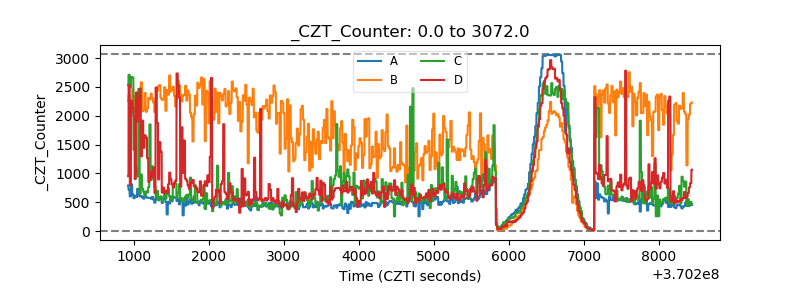 |
| +2.5 Volts monitor |  |
| +5 Volts monitor |  |
| _ROLL_ROT | 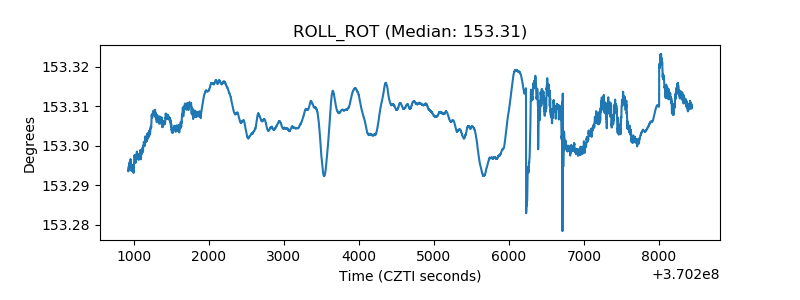 |
| _Roll_DEC | 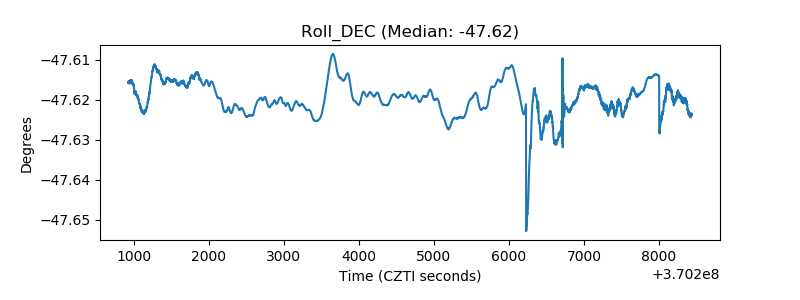 |
| _Roll_RA | 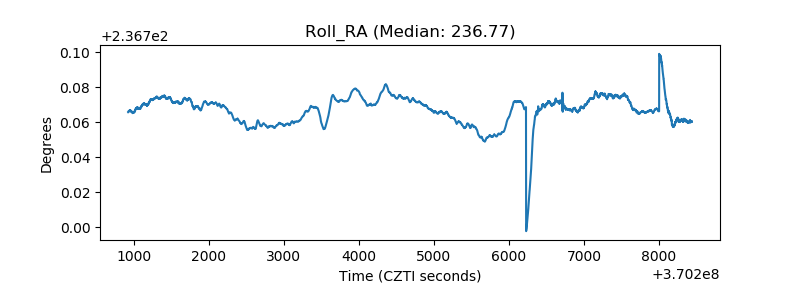 |
| Veto Counter | 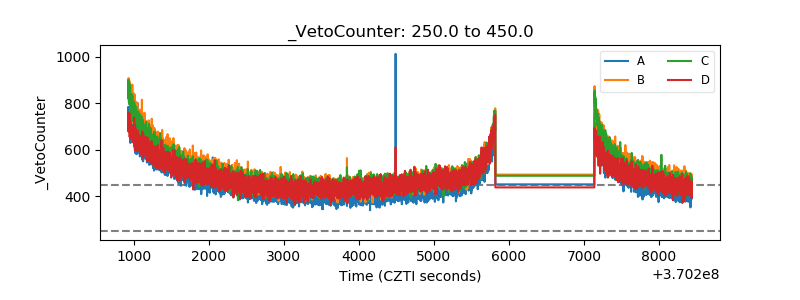 |