| Param | Original file | Final file |
|---|---|---|
| Filename | modeM0/AS1T04_059T01_9000004704_32399cztM0_level2.evt | modeM0/AS1T04_059T01_9000004704_32399cztM0_level2_quad_clean.evt |
| Size (bytes) | 830,462,400 | 71,343,360 |
| Size | 792.0 MB | 68.0 MB |
| Events in quadrant A | 3,246,310 | 461,641 |
| Events in quadrant B | 12,148,361 | 356,018 |
| Events in quadrant C | 3,744,339 | 448,377 |
| Events in quadrant D | 5,545,694 | 411,914 |
| Mode M0 | |||
|---|---|---|---|
| Quadrant | BADHDUFLAG | Total packets | Discarded packets |
| A | 0 | 14214 | 2 |
| B | 0 | 40908 | 1 |
| C | 0 | 15475 | 1 |
| D | 0 | 21252 | 1 |
| Mode M9 | |||
|---|---|---|---|
| Quadrant | BADHDUFLAG | Total packets | Discarded packets |
| A | 0 | 4 | 0 |
| B | 0 | 4 | 0 |
| C | 0 | 4 | 0 |
| D | 0 | 4 | 0 |
| Mode SS | |||
|---|---|---|---|
| Quadrant | BADHDUFLAG | Total packets | Discarded packets |
| A | 0 | 138 | 0 |
| B | 0 | 138 | 0 |
| C | 0 | 138 | 0 |
| D | 0 | 138 | 0 |
| Quadrant | Total seconds | Saturated seconds | Saturation percentage |
|---|---|---|---|
| A | 6910 | 62 | 0.897250% |
| B | 6910 | 3326 | 48.133140% |
| C | 6910 | 159 | 2.301013% |
| D | 6910 | 610 | 8.827786% |
Noise dominated data is calculated using 1-second bins in cleaned event files. If a bin has >2000 counts, and if more than 50% of those come from <1% of pixels, then it is considered to be noise-dominated and hence unusable.
| Quadrant | # 1 sec bins | Bins with >0 counts | Bins with >2000 counts | High rate bins dominated by noise | Noise dominated (total time) | Noise dominated (detector-on time) | Marked lightcurve |
|---|---|---|---|---|---|---|---|
| A | 7275 | 6911 | 1 | 1 | 0.01% | 0.01% | 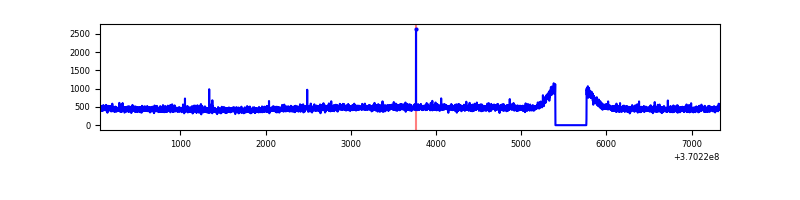 |
| B | 7275 | 6911 | 2208 | 2208 | 30.35% | 31.95% | 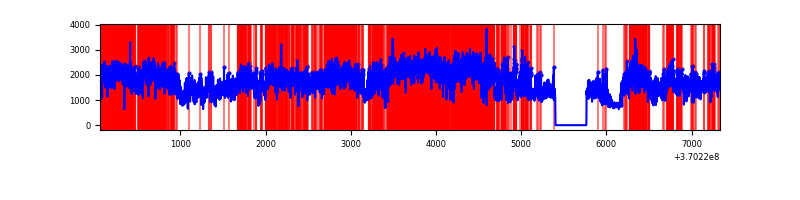 |
| C | 7275 | 6911 | 2 | 2 | 0.03% | 0.03% | 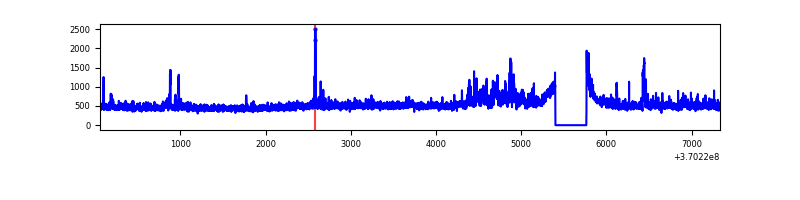 |
| D | 7275 | 6911 | 503 | 503 | 6.91% | 7.28% | 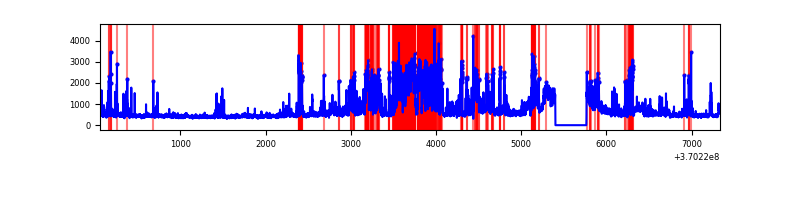 |
Top three noisy pixels from each quadrant. If the there are fewer than three noisy pixels in the level2.evt file, extra rows are filled as -1
| Pixel properties | Quadrant properties | ||||||
|---|---|---|---|---|---|---|---|
| Quadrant | DetID | PixID | Counts | Sigma | Mean | Median | Sigma |
| A | 13 | 254 | 13934 | 77.66 | 838 | 821 | 168.8 |
| A | 3 | 137 | 8467 | 45.29 | 838 | 821 | 168.8 |
| A | 0 | 226 | 7099 | 37.18 | 838 | 821 | 168.8 |
| B | 4 | 80 | 7016069 | 50262.1 | 725 | 707 | 139.6 |
| B | 6 | 159 | 1720506 | 12321.63 | 725 | 707 | 139.6 |
| B | 10 | 245 | 202660 | 1446.91 | 725 | 707 | 139.6 |
| C | 3 | 233 | 345544 | 1832.15 | 797 | 802 | 188.2 |
| C | 14 | 238 | 131883 | 696.64 | 797 | 802 | 188.2 |
| C | 0 | 10 | 68161 | 357.98 | 797 | 802 | 188.2 |
| D | 12 | 227 | 1307980 | 6885.78 | 784 | 759 | 189.8 |
| D | 12 | 233 | 484441 | 2547.79 | 784 | 759 | 189.8 |
| D | 8 | 195 | 190503 | 999.47 | 784 | 759 | 189.8 |
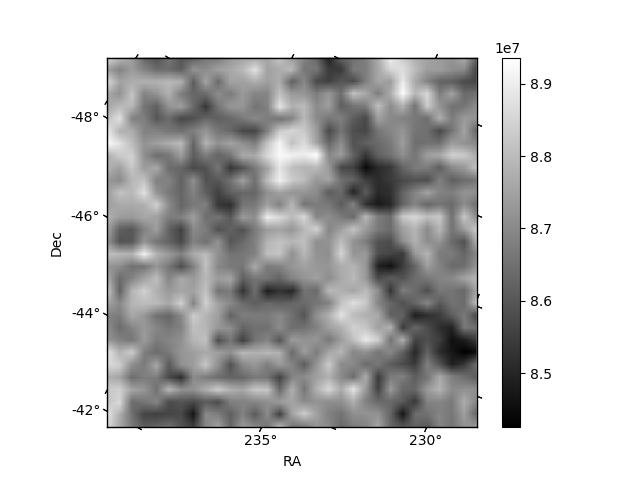
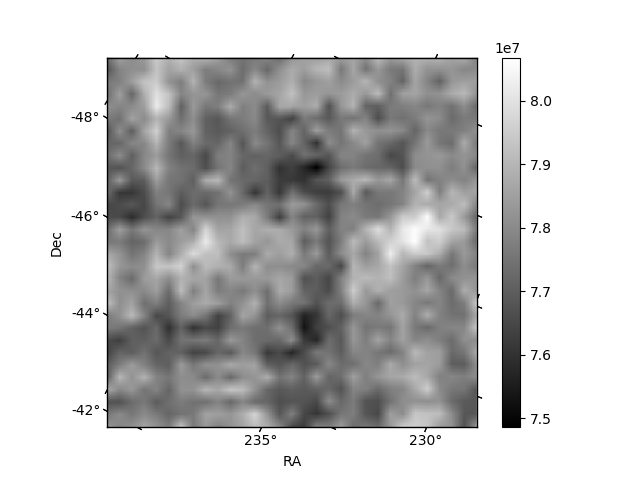
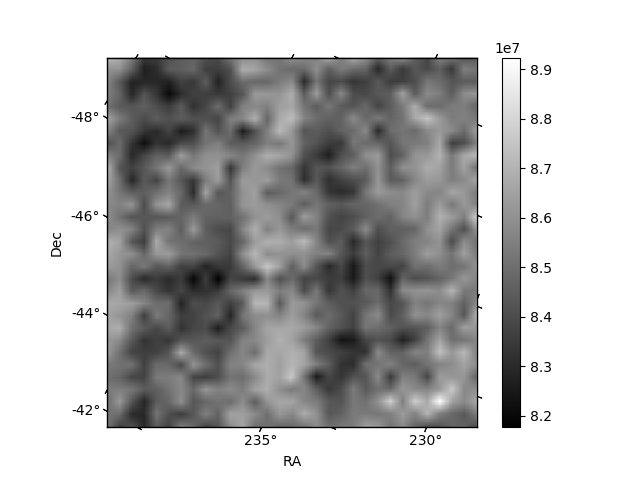
Histogram calculated using DETX and DETY for each event in the final _common_clean file
| Quadrant A | 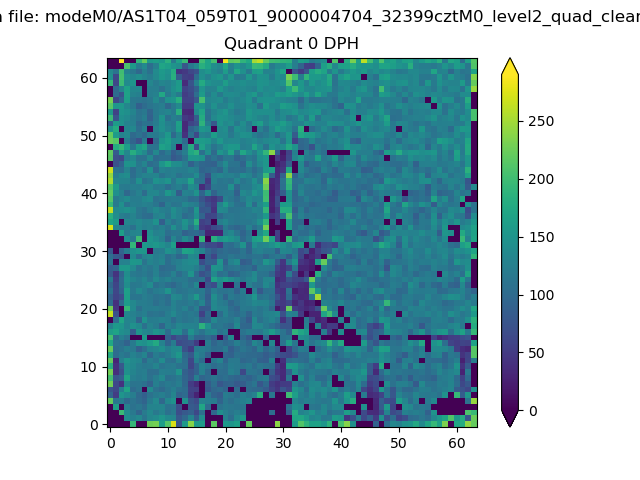 |
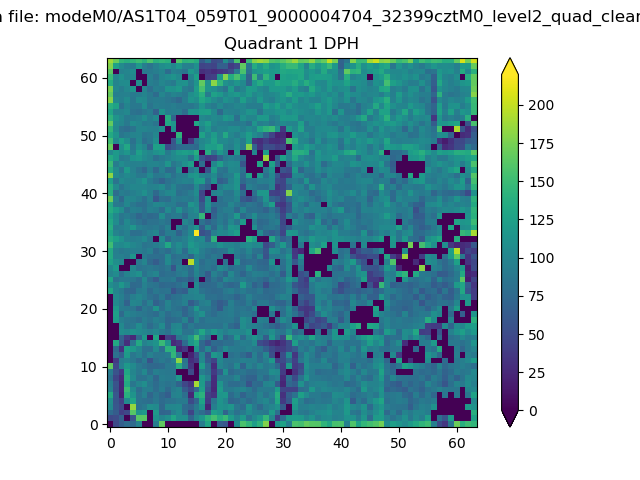 |
Quadrant B |
|---|---|---|---|
| Quadrant D | 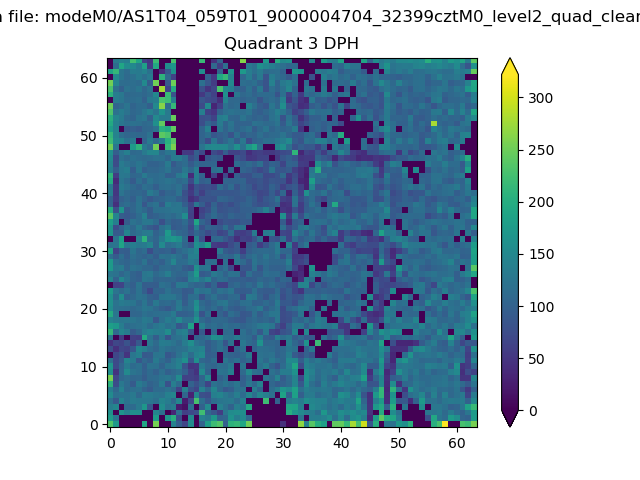 |
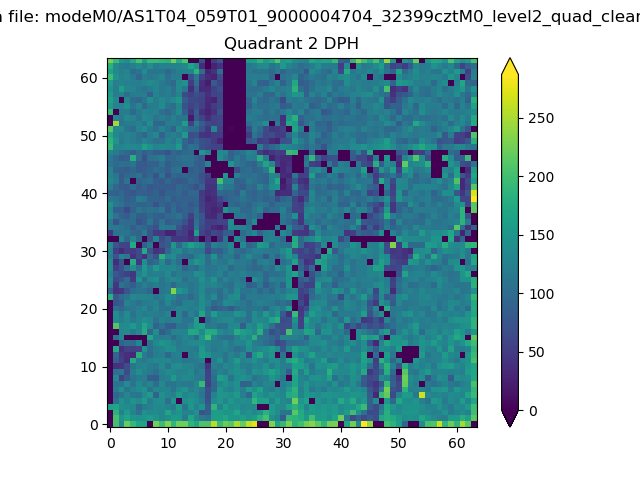 |
Quadrant C |
| Plot type | Count rate plots | Images |
|---|---|---|
| Comparison with Poisson distribution Blue bars denote a histogram of data divided into 1 sec bins. Red curve is a Poisson curve with rate = median count rate of data. |
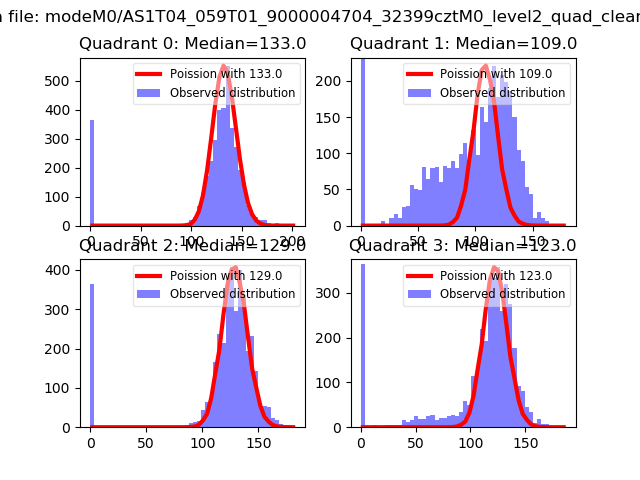 |
 |
| Quadrant-wise count rates Data is divided into 100 sec bins |
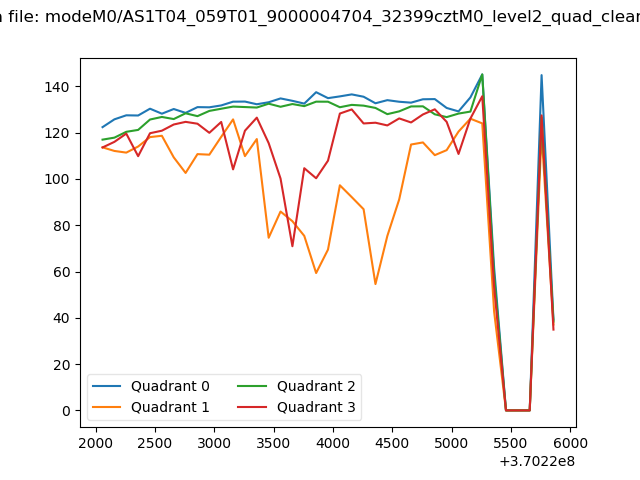 |
|
| Module-wise count rates for Quadrant A Data is divided into 100 sec bins |
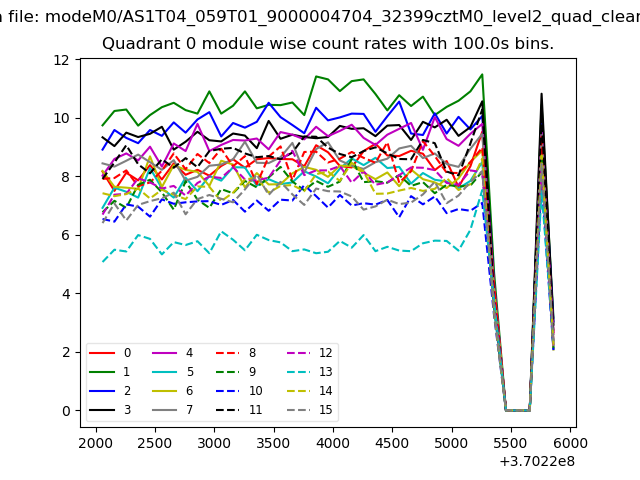 |
 |
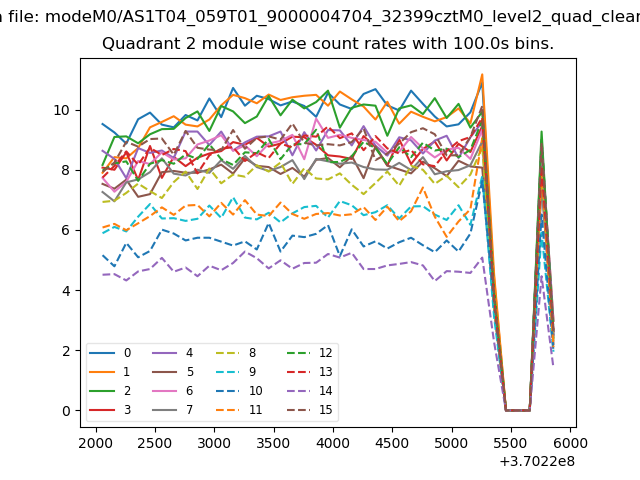
| Module-wise count rates for Quadrant B Data is divided into 100 sec bins |
 |
 |
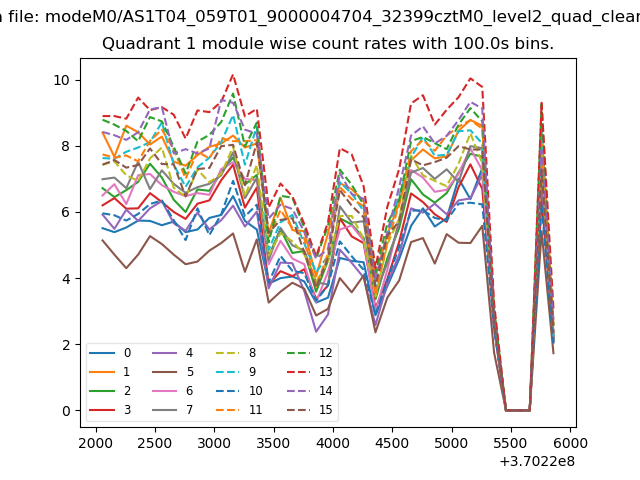
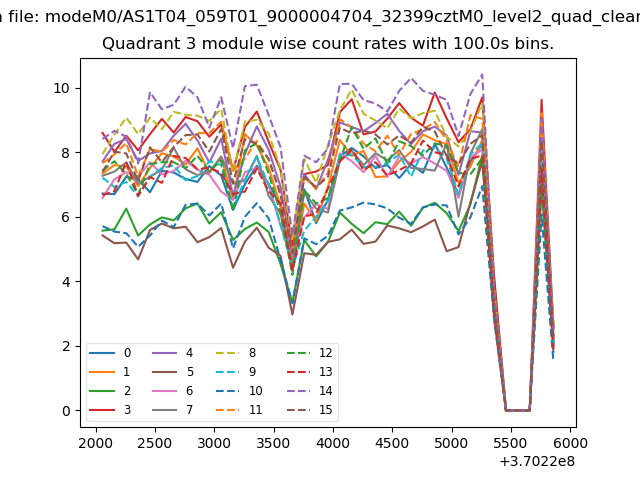
| Module-wise count rates for Quadrant C Data is divided into 100 sec bins |
 |
 |
| Module-wise count rates for Quadrant D Data is divided into 100 sec bins |
 |
 |
| Parameter | Plot |
|---|---|
| CZT HV Monitor | 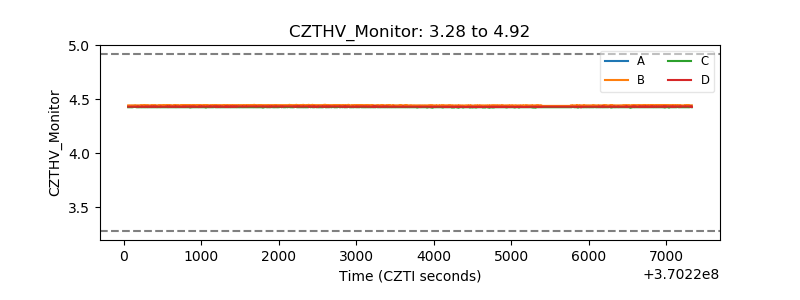 |
| D_VDD | 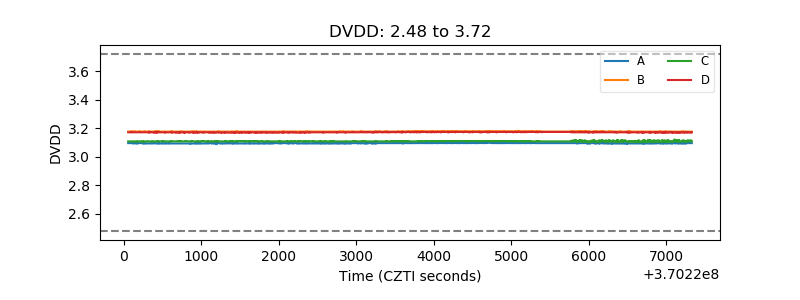 |
| Temperature 1 | 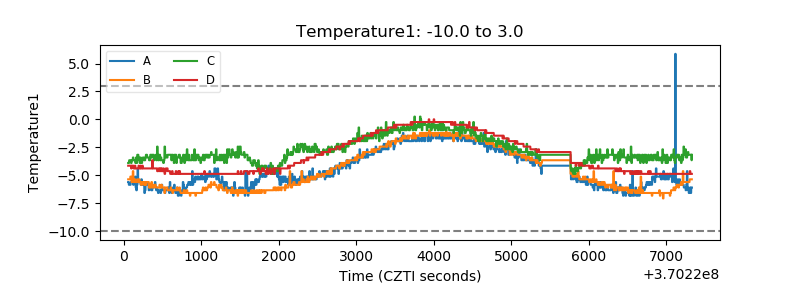 |
| Veto HV Monitor | 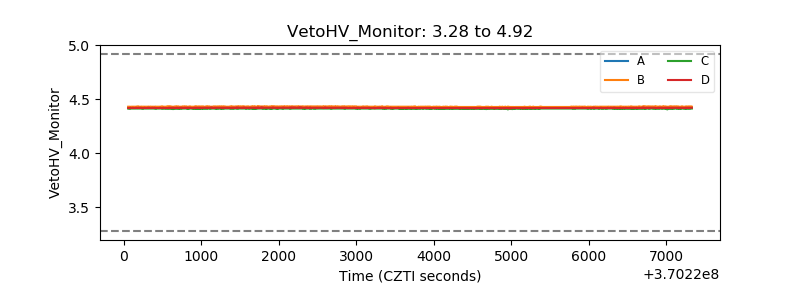 |
| Veto LLD | 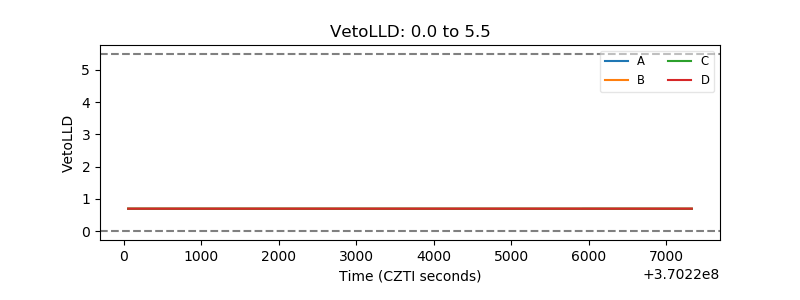 |
| Alpha Counter | 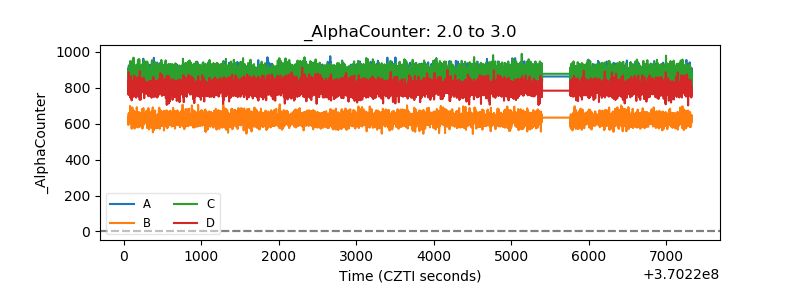 |
| _CPM_Rate | 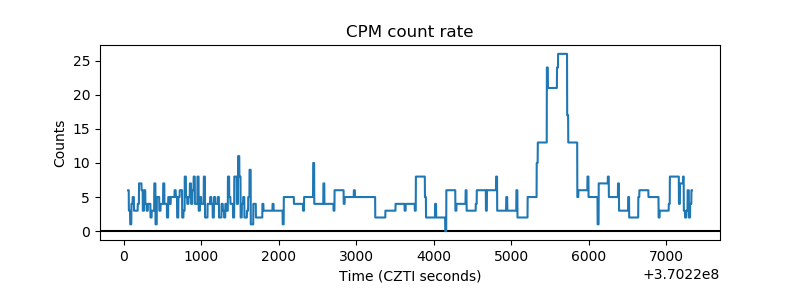 |
| CZT Counter | 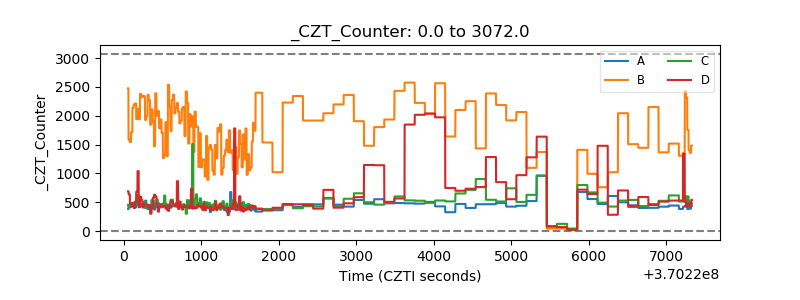 |
| +2.5 Volts monitor |  |
| +5 Volts monitor |  |
| _ROLL_ROT | 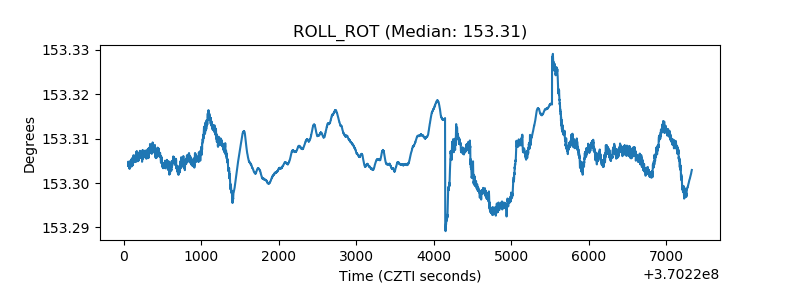 |
| _Roll_DEC | 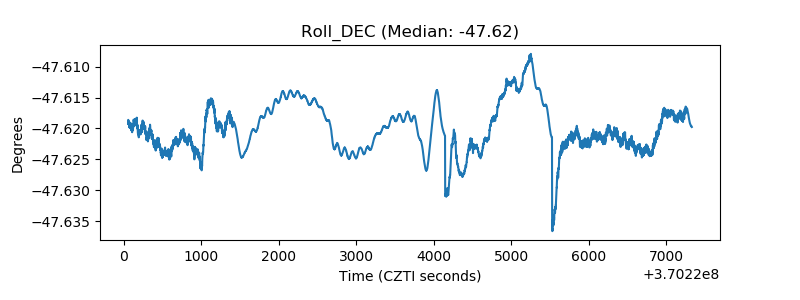 |
| _Roll_RA |  |
| Veto Counter | 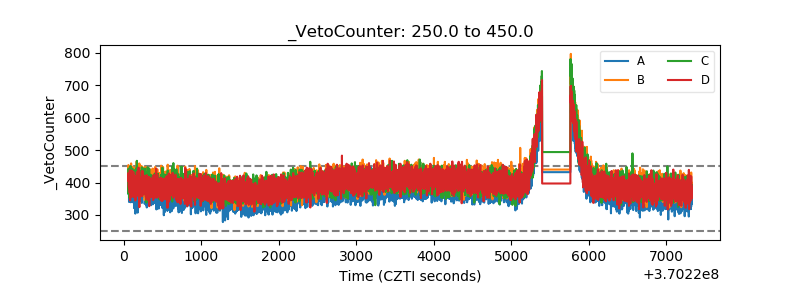 |