| Param | Original file | Final file |
|---|---|---|
| Filename | modeM0/AS1T04_059T01_9000004704_32400cztM0_level2.evt | modeM0/AS1T04_059T01_9000004704_32400cztM0_level2_quad_clean.evt |
| Size (bytes) | 830,695,680 | 77,584,320 |
| Size | 792.2 MB | 74.0 MB |
| Events in quadrant A | 3,503,107 | 492,886 |
| Events in quadrant B | 12,684,511 | 399,732 |
| Events in quadrant C | 3,767,350 | 483,175 |
| Events in quadrant D | 4,705,281 | 459,850 |
| Mode M0 | |||
|---|---|---|---|
| Quadrant | BADHDUFLAG | Total packets | Discarded packets |
| A | 0 | 15299 | 3 |
| B | 0 | 42845 | 2 |
| C | 0 | 15679 | 2 |
| D | 0 | 18802 | 2 |
| Mode SS | |||
|---|---|---|---|
| Quadrant | BADHDUFLAG | Total packets | Discarded packets |
| A | 0 | 148 | 0 |
| B | 0 | 148 | 0 |
| C | 0 | 148 | 0 |
| D | 0 | 148 | 0 |
| Quadrant | Total seconds | Saturated seconds | Saturation percentage |
|---|---|---|---|
| A | 7361 | 186 | 2.526831% |
| B | 7361 | 3190 | 43.336503% |
| C | 7361 | 262 | 3.559299% |
| D | 7361 | 367 | 4.985736% |
Noise dominated data is calculated using 1-second bins in cleaned event files. If a bin has >2000 counts, and if more than 50% of those come from <1% of pixels, then it is considered to be noise-dominated and hence unusable.
| Quadrant | # 1 sec bins | Bins with >0 counts | Bins with >2000 counts | High rate bins dominated by noise | Noise dominated (total time) | Noise dominated (detector-on time) | Marked lightcurve |
|---|---|---|---|---|---|---|---|
| A | 7431 | 7363 | 1 | 1 | 0.01% | 0.01% | 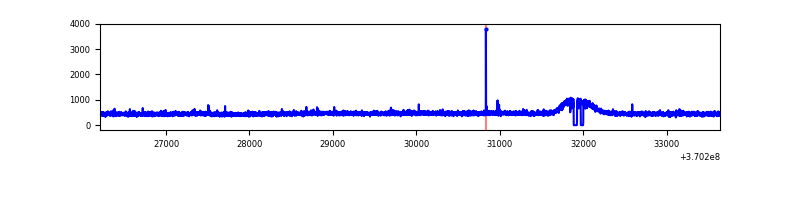 |
| B | 7431 | 7363 | 1834 | 1834 | 24.68% | 24.91% | 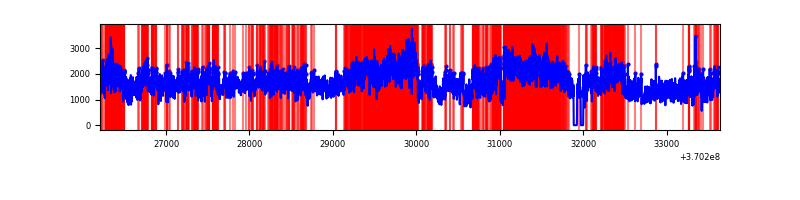 |
| C | 7431 | 7363 | 0 | 0 | 0.00% | 0.00% | 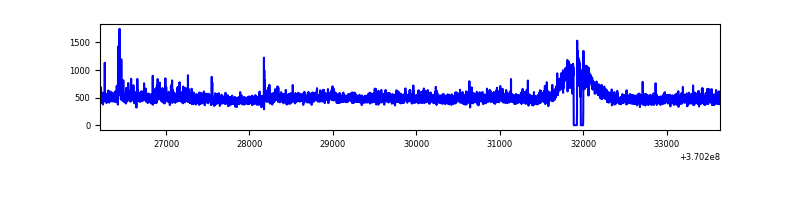 |
| D | 7431 | 7363 | 187 | 187 | 2.52% | 2.54% | 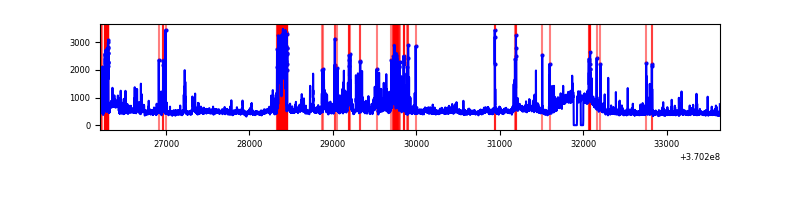 |
Top three noisy pixels from each quadrant. If the there are fewer than three noisy pixels in the level2.evt file, extra rows are filled as -1
| Pixel properties | Quadrant properties | ||||||
|---|---|---|---|---|---|---|---|
| Quadrant | DetID | PixID | Counts | Sigma | Mean | Median | Sigma |
| A | 13 | 254 | 16435 | 85.12 | 899 | 880 | 182.7 |
| A | 15 | 174 | 12474 | 63.45 | 899 | 880 | 182.7 |
| A | 0 | 6 | 10564 | 52.99 | 899 | 880 | 182.7 |
| B | 4 | 80 | 6983900 | 46189.3 | 782 | 760 | 151.2 |
| B | 6 | 159 | 1859621 | 12295.26 | 782 | 760 | 151.2 |
| B | 10 | 245 | 548675 | 3624.13 | 782 | 760 | 151.2 |
| C | 14 | 238 | 142248 | 684.27 | 861 | 865 | 206.6 |
| C | 3 | 233 | 123470 | 593.39 | 861 | 865 | 206.6 |
| C | 14 | 67 | 52992 | 252.29 | 861 | 865 | 206.6 |
| D | 12 | 233 | 770238 | 3731.0 | 860 | 835 | 206.2 |
| D | 8 | 195 | 282458 | 1365.65 | 860 | 835 | 206.2 |
| D | 1 | 47 | 110437 | 531.48 | 860 | 835 | 206.2 |
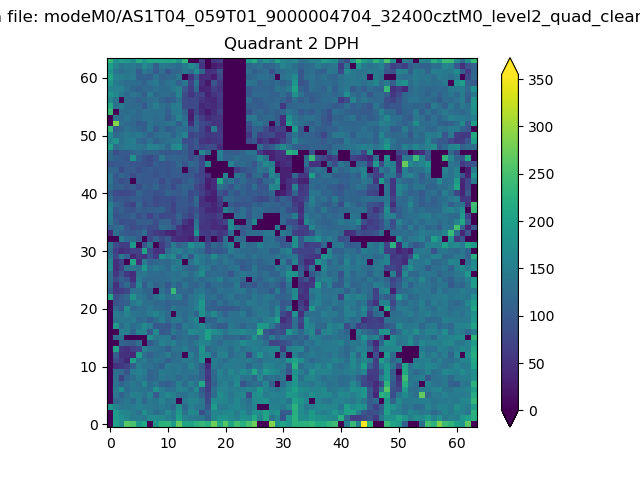
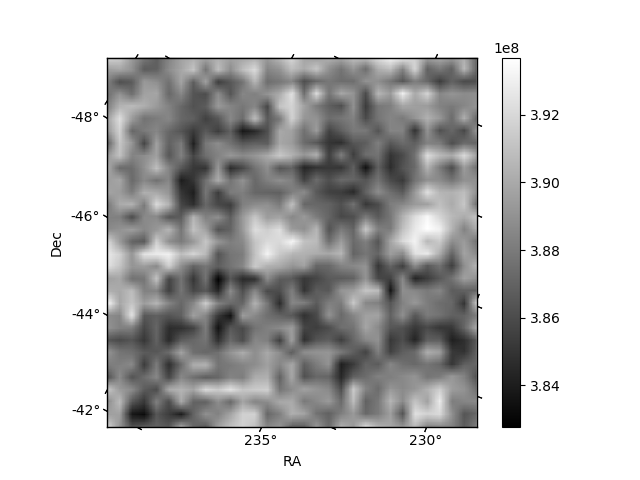
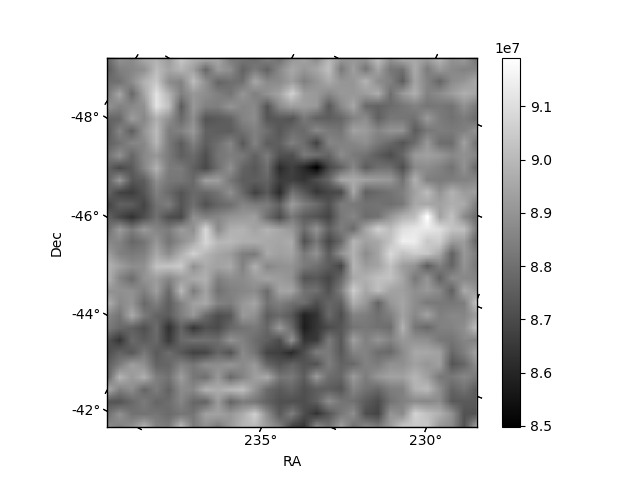
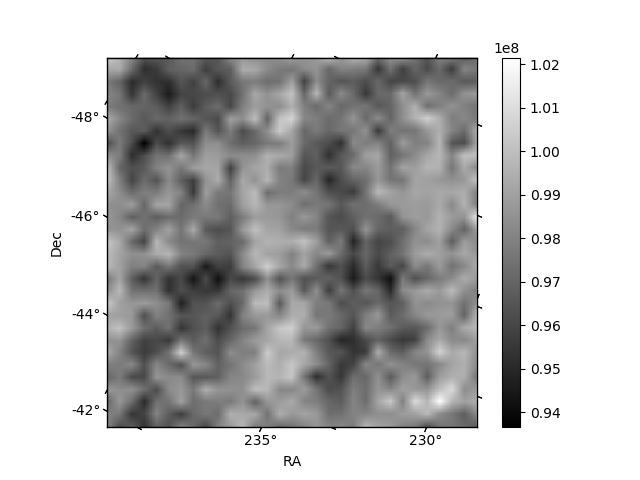
Histogram calculated using DETX and DETY for each event in the final _common_clean file
| Quadrant A | 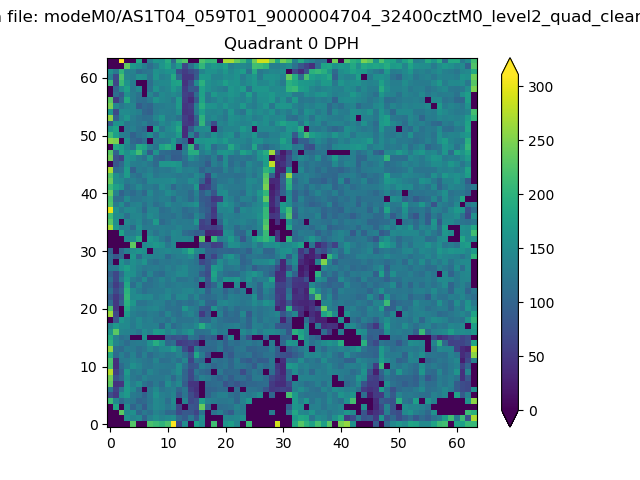 |
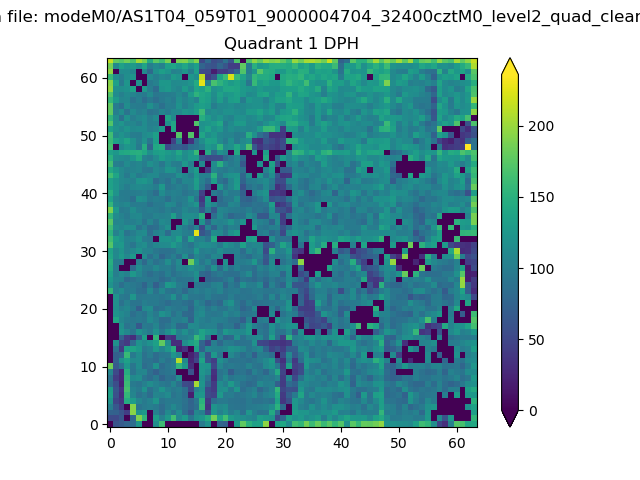 |
Quadrant B |
|---|---|---|---|
| Quadrant D | 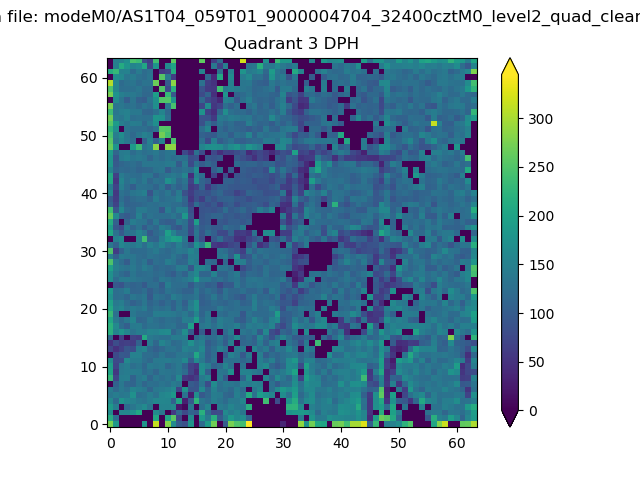 |
 |
Quadrant C |
| Plot type | Count rate plots | Images |
|---|---|---|
| Comparison with Poisson distribution Blue bars denote a histogram of data divided into 1 sec bins. Red curve is a Poisson curve with rate = median count rate of data. |
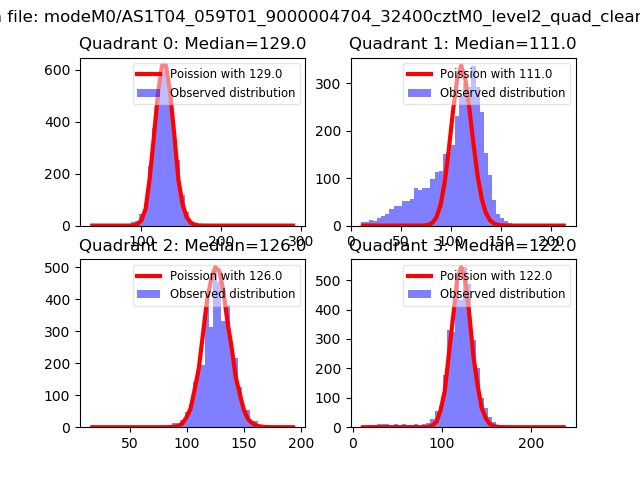 |
 |
| Quadrant-wise count rates Data is divided into 100 sec bins |
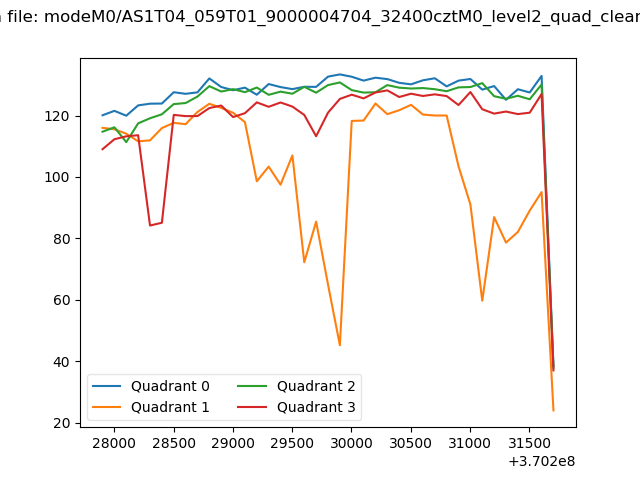 |
|
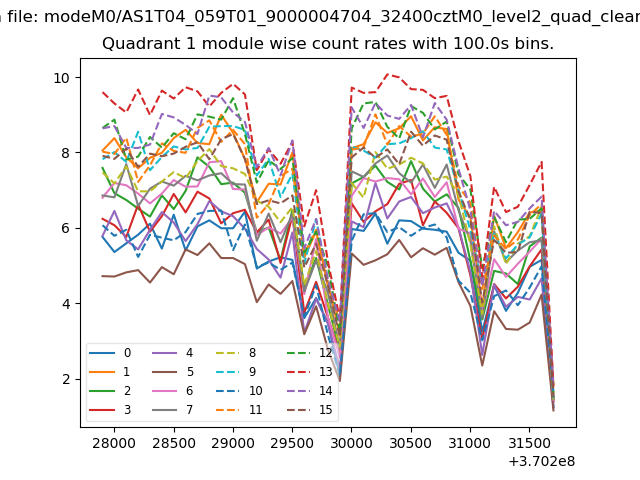
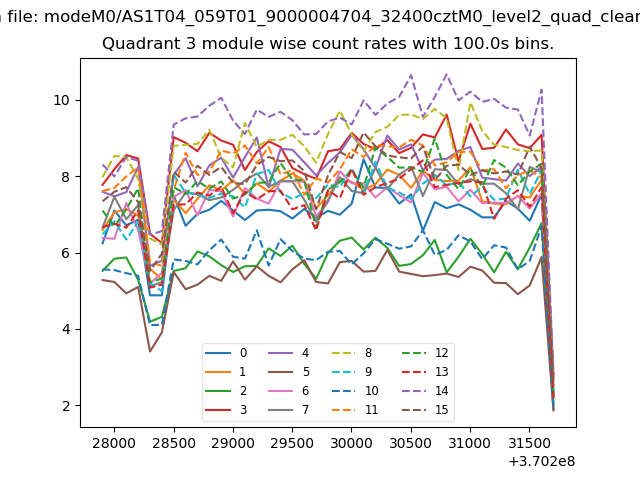
| Module-wise count rates for Quadrant A Data is divided into 100 sec bins |
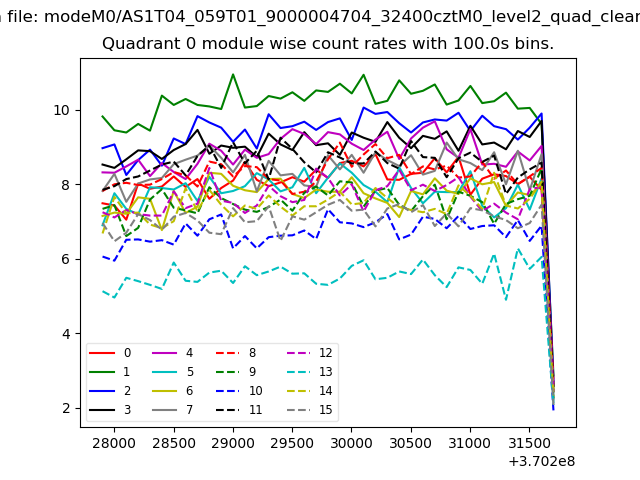 |
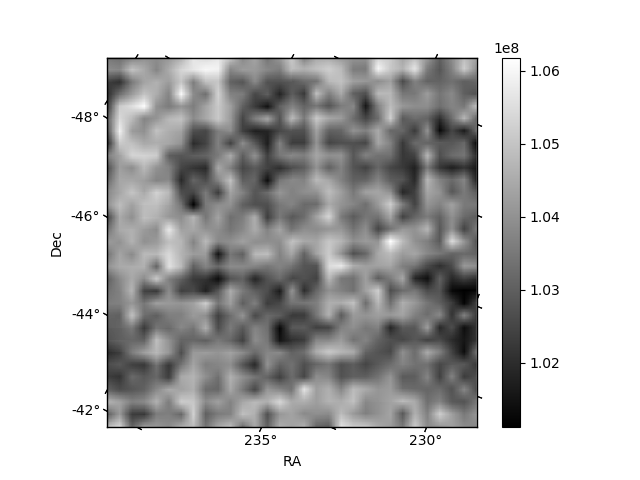 |
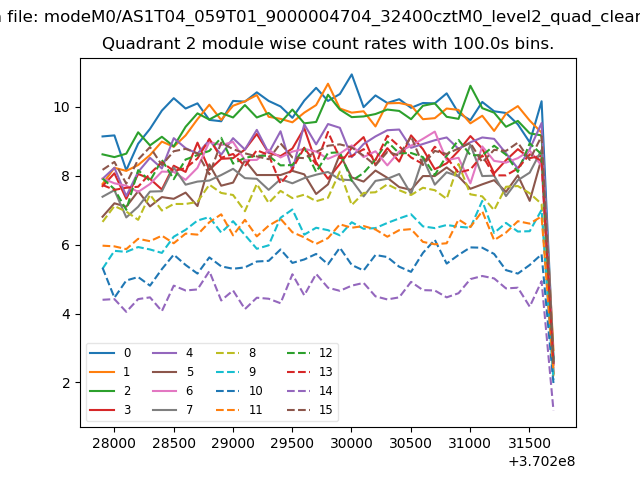
| Module-wise count rates for Quadrant B Data is divided into 100 sec bins |
 |
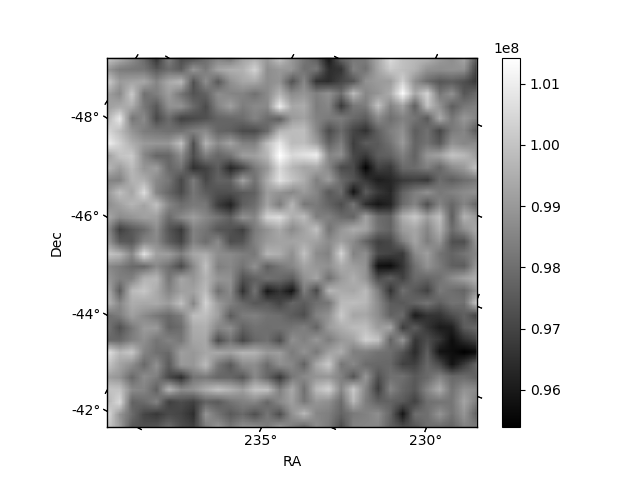 |
| Module-wise count rates for Quadrant C Data is divided into 100 sec bins |
 |
 |
| Module-wise count rates for Quadrant D Data is divided into 100 sec bins |
 |
 |
| Parameter | Plot |
|---|---|
| CZT HV Monitor | 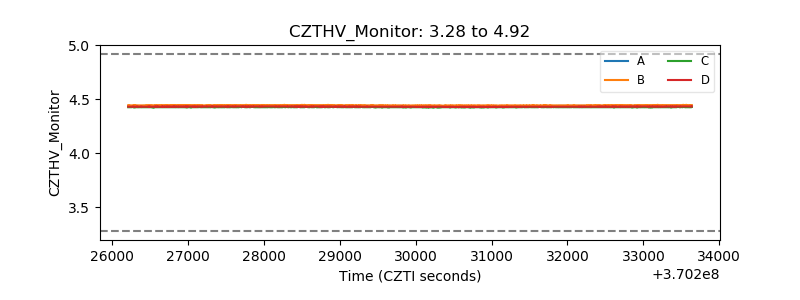 |
| D_VDD | 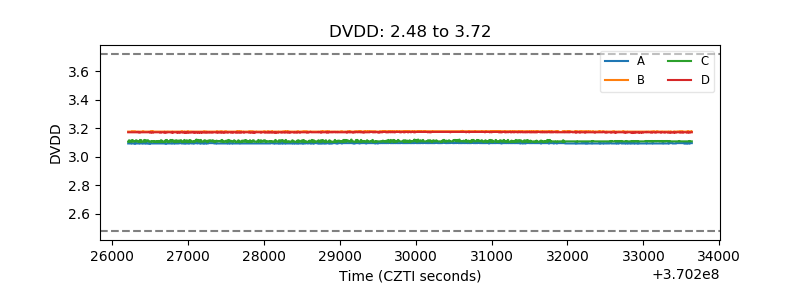 |
| Temperature 1 | 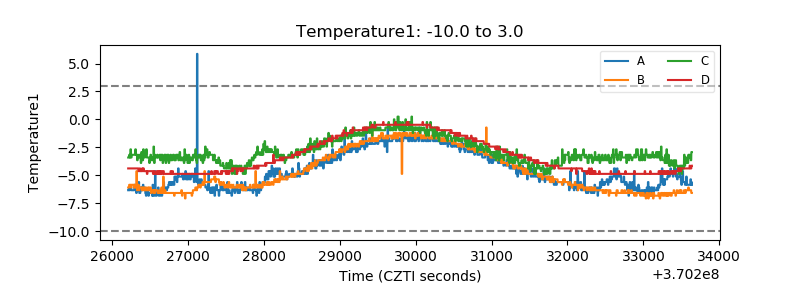 |
| Veto HV Monitor | 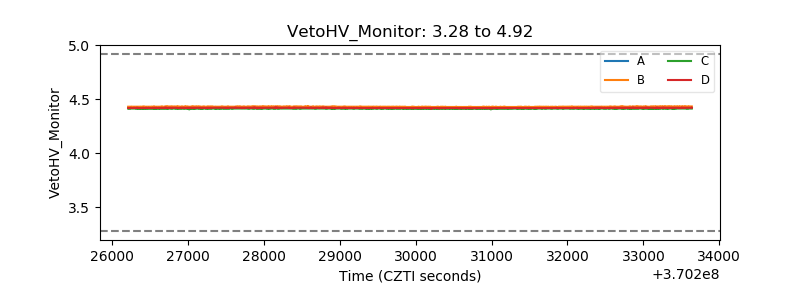 |
| Veto LLD | 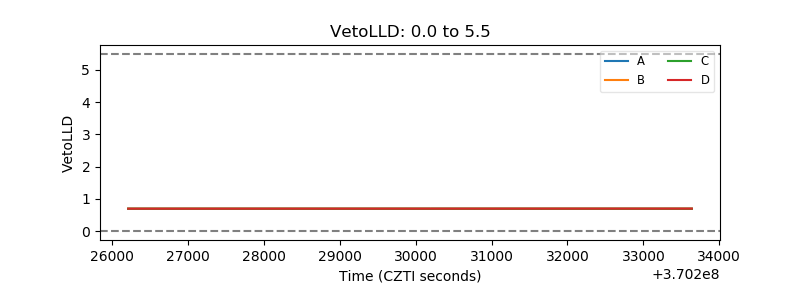 |
| Alpha Counter | 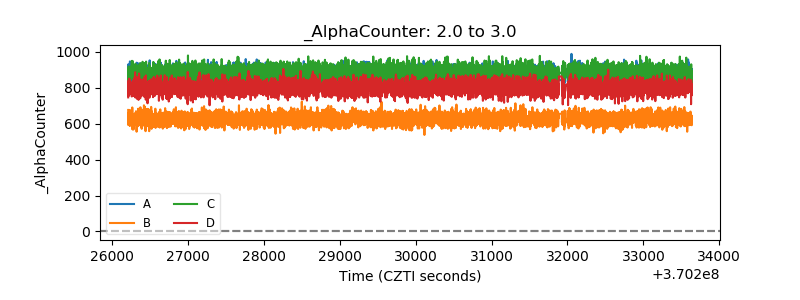 |
| _CPM_Rate | 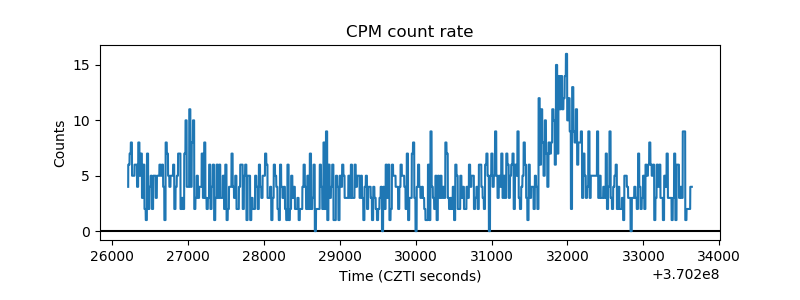 |
| CZT Counter | 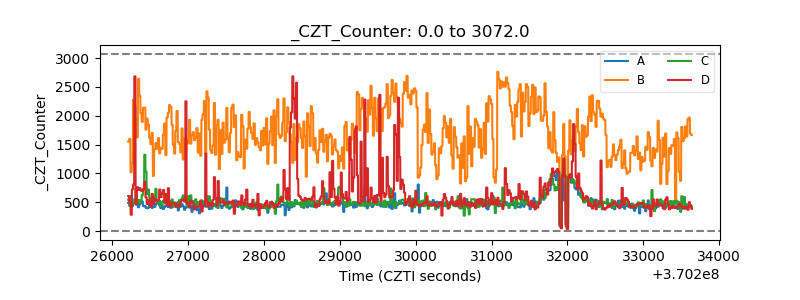 |
| +2.5 Volts monitor | 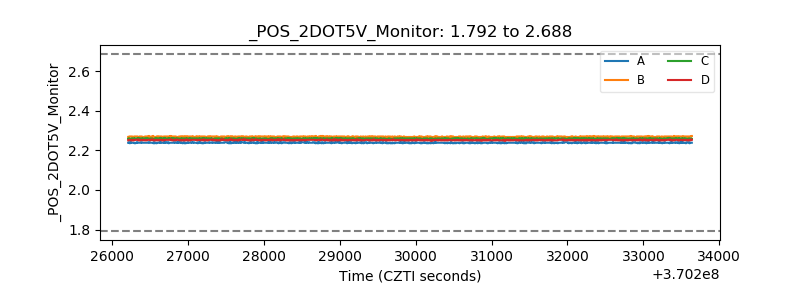 |
| +5 Volts monitor | 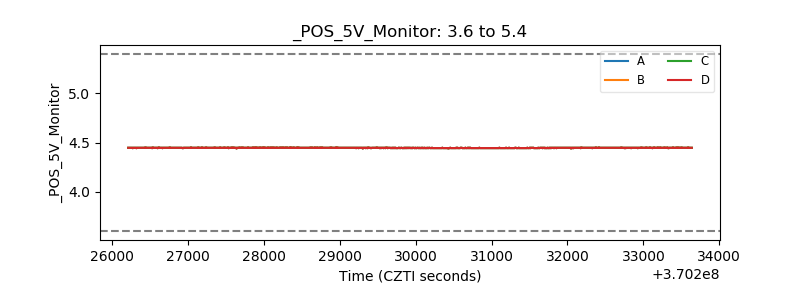 |
| _ROLL_ROT | 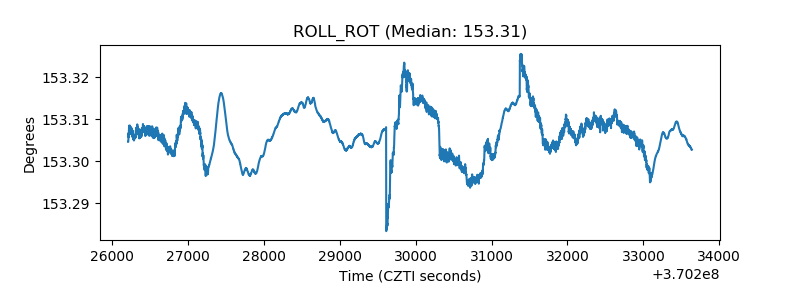 |
| _Roll_DEC | 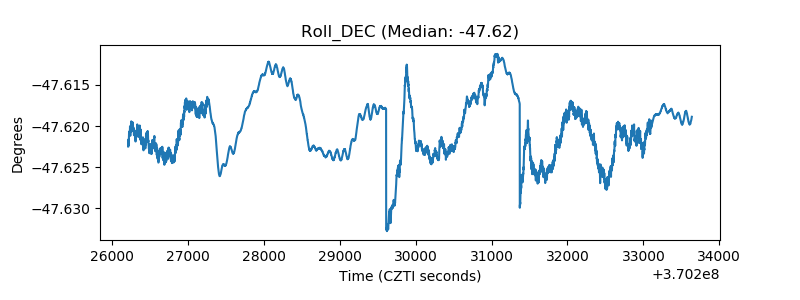 |
| _Roll_RA | 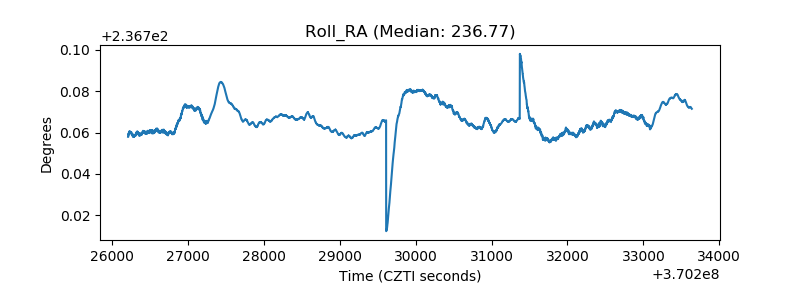 |
| Veto Counter | 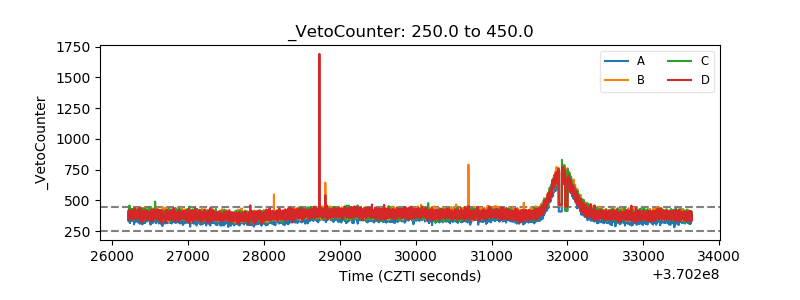 |