| Param | Original file | Final file |
|---|---|---|
| Filename | modeM0/AS1T04_059T01_9000004704_32401cztM0_level2.evt | modeM0/AS1T04_059T01_9000004704_32401cztM0_level2_quad_clean.evt |
| Size (bytes) | 889,047,360 | 83,566,080 |
| Size | 847.9 MB | 79.7 MB |
| Events in quadrant A | 3,621,705 | 546,876 |
| Events in quadrant B | 14,266,816 | 398,357 |
| Events in quadrant C | 3,923,965 | 533,614 |
| Events in quadrant D | 4,594,124 | 517,037 |
| Mode M0 | |||
|---|---|---|---|
| Quadrant | BADHDUFLAG | Total packets | Discarded packets |
| A | 0 | 15822 | 2 |
| B | 0 | 47648 | 1 |
| C | 0 | 16329 | 1 |
| D | 0 | 18813 | 1 |
| Mode M9 | |||
|---|---|---|---|
| Quadrant | BADHDUFLAG | Total packets | Discarded packets |
| A | 0 | 3 | 0 |
| B | 0 | 3 | 0 |
| C | 0 | 3 | 0 |
| D | 0 | 3 | 0 |
| Mode SS | |||
|---|---|---|---|
| Quadrant | BADHDUFLAG | Total packets | Discarded packets |
| A | 0 | 154 | 0 |
| B | 0 | 154 | 0 |
| C | 0 | 154 | 0 |
| D | 0 | 154 | 0 |
| Quadrant | Total seconds | Saturated seconds | Saturation percentage |
|---|---|---|---|
| A | 7669 | 165 | 2.151519% |
| B | 7669 | 4578 | 59.694875% |
| C | 7669 | 237 | 3.090364% |
| D | 7669 | 232 | 3.025166% |
Noise dominated data is calculated using 1-second bins in cleaned event files. If a bin has >2000 counts, and if more than 50% of those come from <1% of pixels, then it is considered to be noise-dominated and hence unusable.
| Quadrant | # 1 sec bins | Bins with >0 counts | Bins with >2000 counts | High rate bins dominated by noise | Noise dominated (total time) | Noise dominated (detector-on time) | Marked lightcurve |
|---|---|---|---|---|---|---|---|
| A | 7899 | 7670 | 5 | 5 | 0.06% | 0.07% | 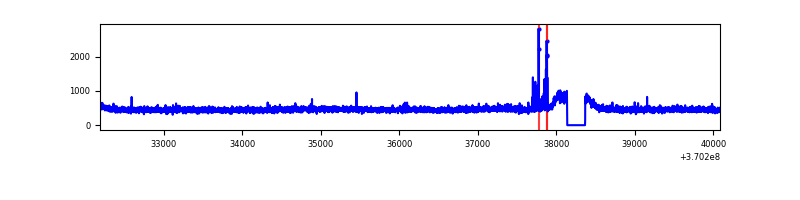 |
| B | 7899 | 7670 | 3303 | 3303 | 41.82% | 43.06% | 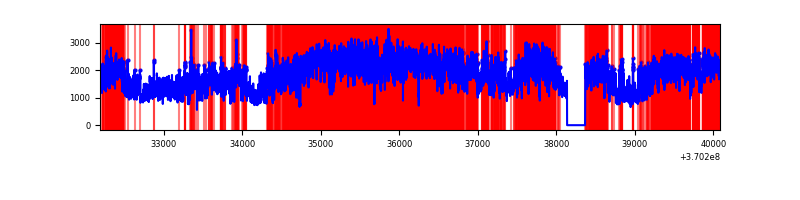 |
| C | 7899 | 7670 | 6 | 6 | 0.08% | 0.08% |  |
| D | 7899 | 7670 | 84 | 84 | 1.06% | 1.10% | 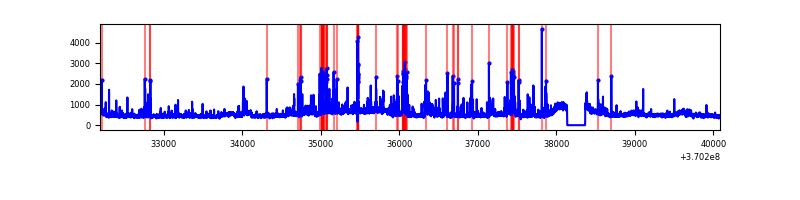 |
Top three noisy pixels from each quadrant. If the there are fewer than three noisy pixels in the level2.evt file, extra rows are filled as -1
| Pixel properties | Quadrant properties | ||||||
|---|---|---|---|---|---|---|---|
| Quadrant | DetID | PixID | Counts | Sigma | Mean | Median | Sigma |
| A | 0 | 6 | 37220 | 194.41 | 924 | 904 | 186.8 |
| A | 13 | 254 | 15059 | 75.77 | 924 | 904 | 186.8 |
| A | 0 | 226 | 10217 | 49.85 | 924 | 904 | 186.8 |
| B | 4 | 80 | 9210824 | 64411.68 | 743 | 722 | 143.0 |
| B | 6 | 159 | 1848008 | 12919.16 | 743 | 722 | 143.0 |
| B | 10 | 245 | 184743 | 1286.97 | 743 | 722 | 143.0 |
| C | 3 | 233 | 146803 | 694.63 | 886 | 889 | 210.1 |
| C | 14 | 238 | 141638 | 670.04 | 886 | 889 | 210.1 |
| C | 0 | 10 | 77272 | 363.63 | 886 | 889 | 210.1 |
| D | 8 | 195 | 412452 | 1917.26 | 894 | 869 | 214.7 |
| D | 6 | 239 | 205355 | 952.55 | 894 | 869 | 214.7 |
| D | 12 | 233 | 179066 | 830.09 | 894 | 869 | 214.7 |
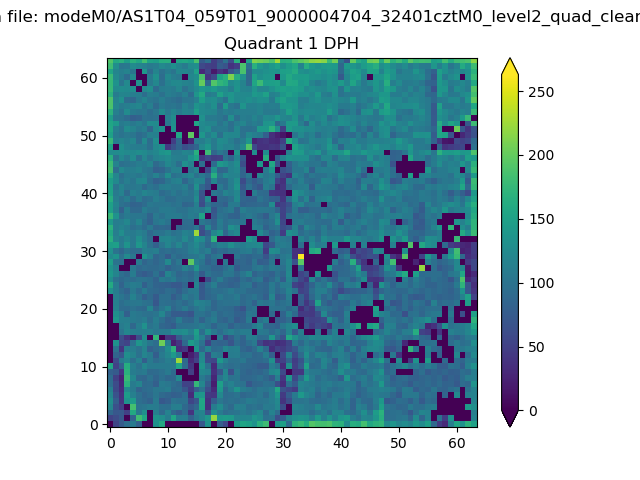
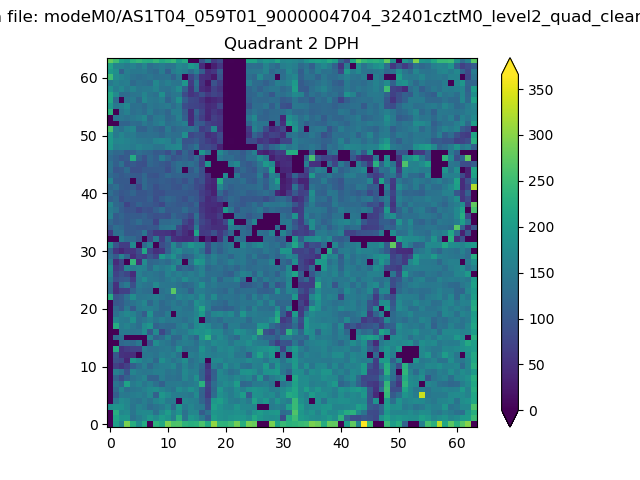
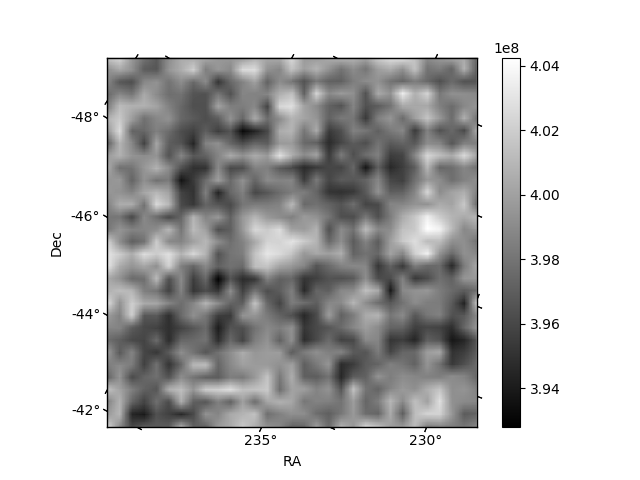
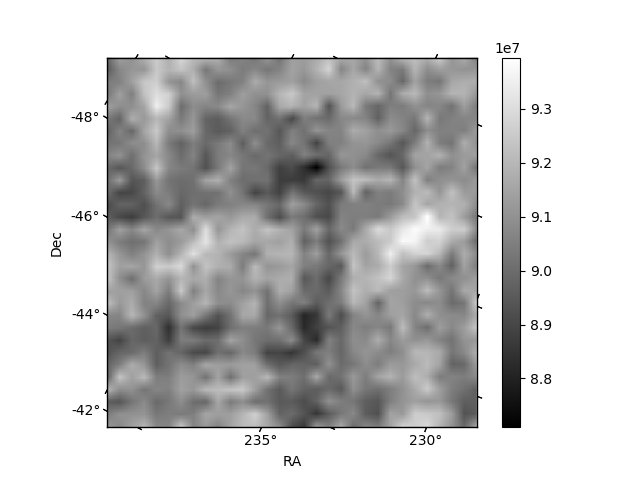
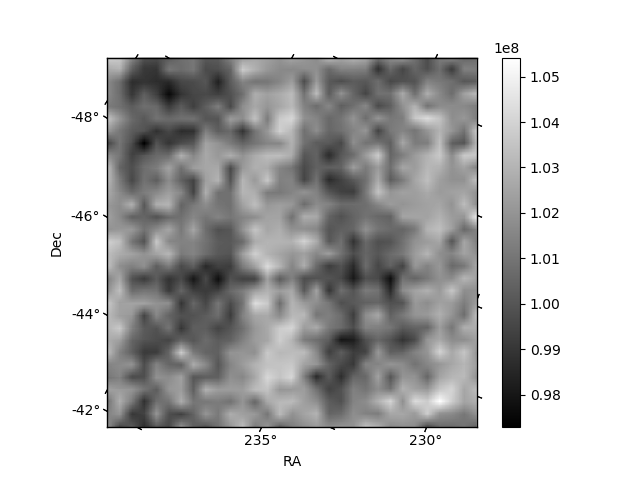
Histogram calculated using DETX and DETY for each event in the final _common_clean file
| Quadrant A | 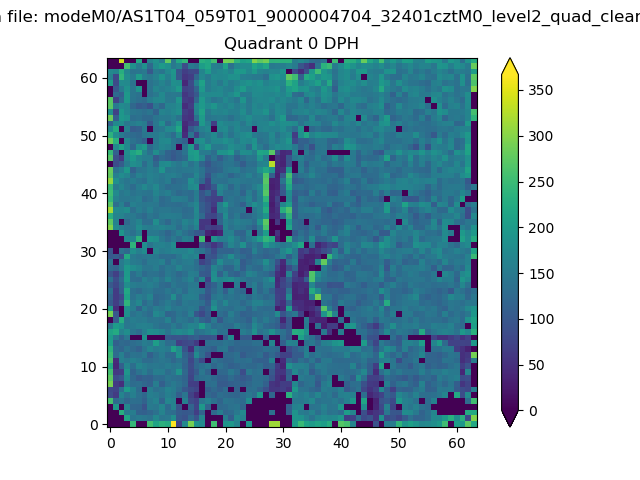 |
 |
Quadrant B |
|---|---|---|---|
| Quadrant D | 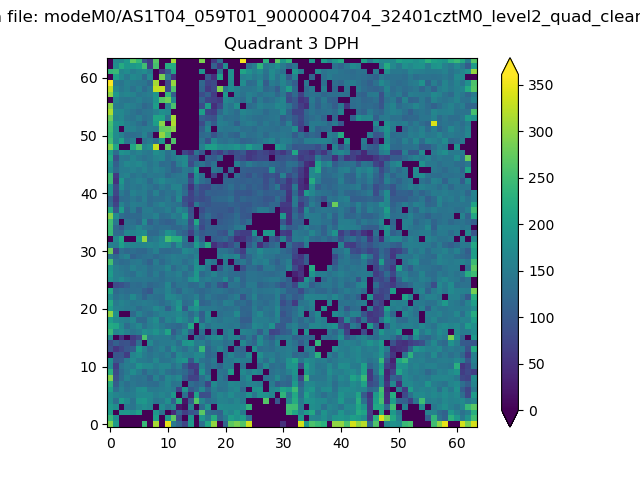 |
 |
Quadrant C |
| Plot type | Count rate plots | Images |
|---|---|---|
| Comparison with Poisson distribution Blue bars denote a histogram of data divided into 1 sec bins. Red curve is a Poisson curve with rate = median count rate of data. |
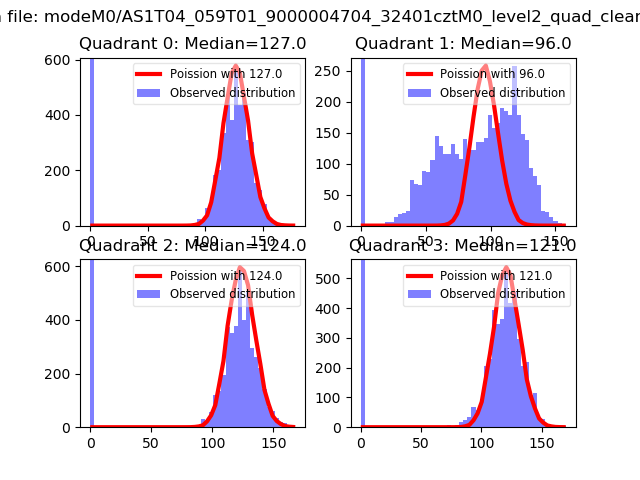 |
 |
| Quadrant-wise count rates Data is divided into 100 sec bins |
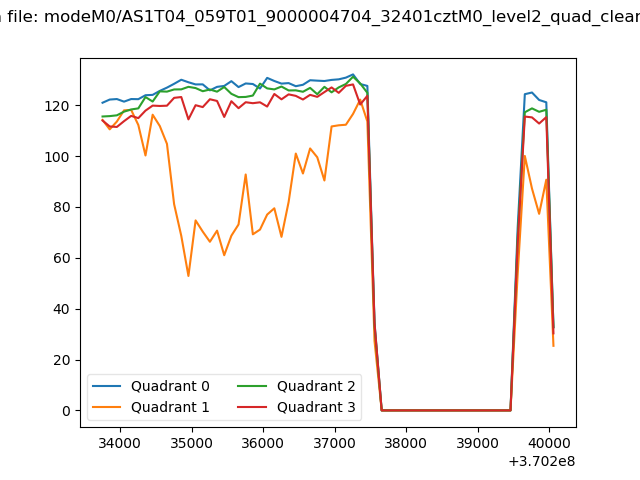 |
|
| Module-wise count rates for Quadrant A Data is divided into 100 sec bins |
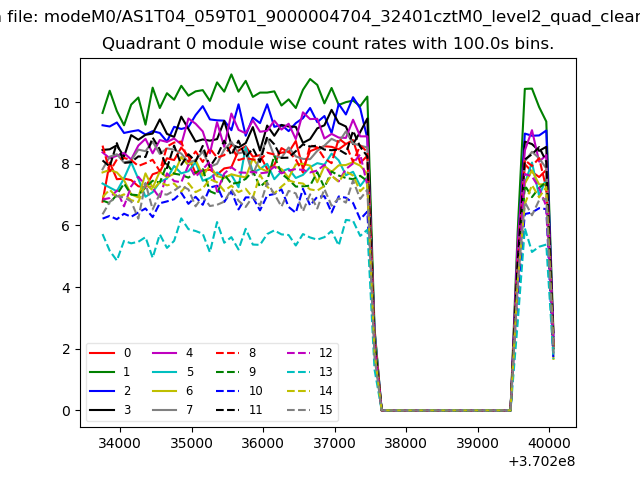 |
 |
| Module-wise count rates for Quadrant B Data is divided into 100 sec bins |
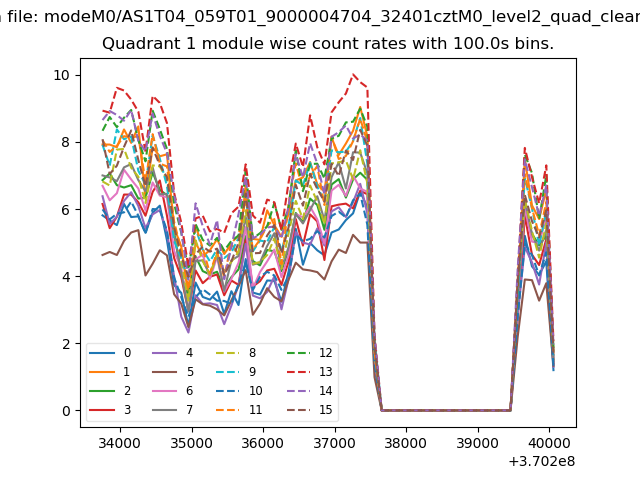 |
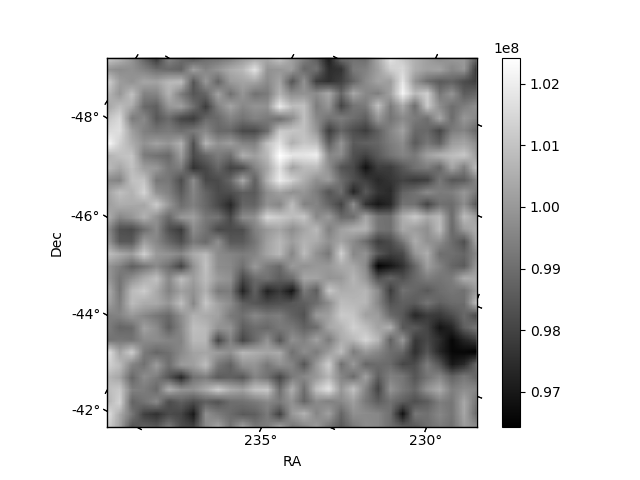 |
| Module-wise count rates for Quadrant C Data is divided into 100 sec bins |
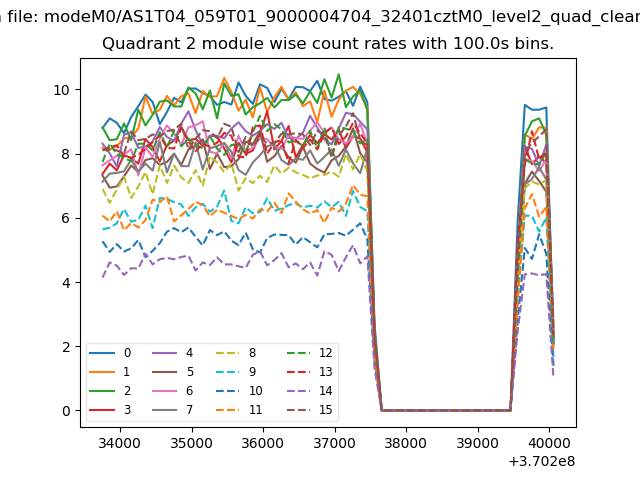 |
 |
| Module-wise count rates for Quadrant D Data is divided into 100 sec bins |
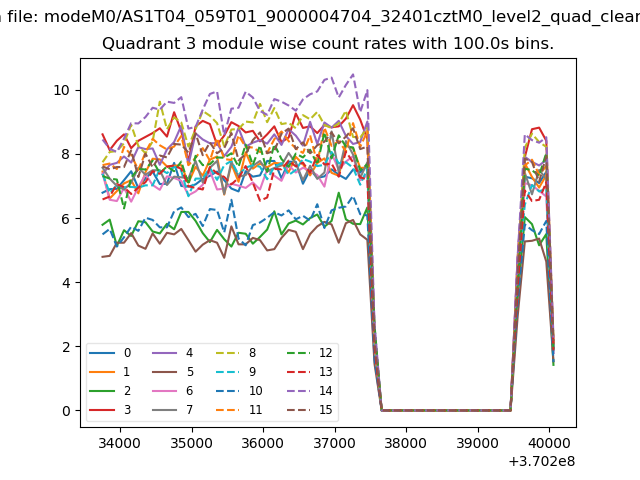 |
 |
| Parameter | Plot |
|---|---|
| CZT HV Monitor | 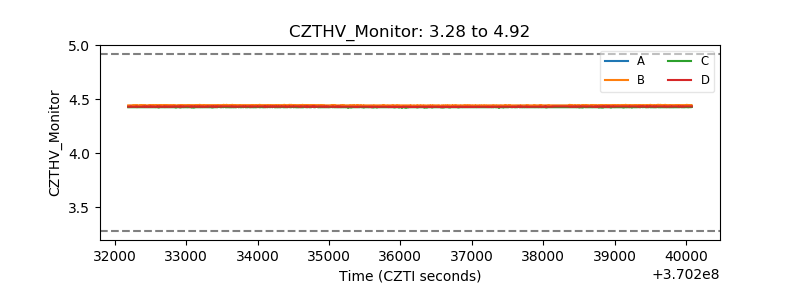 |
| D_VDD | 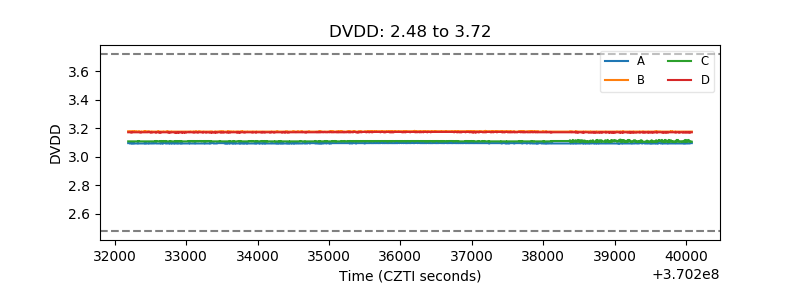 |
| Temperature 1 | 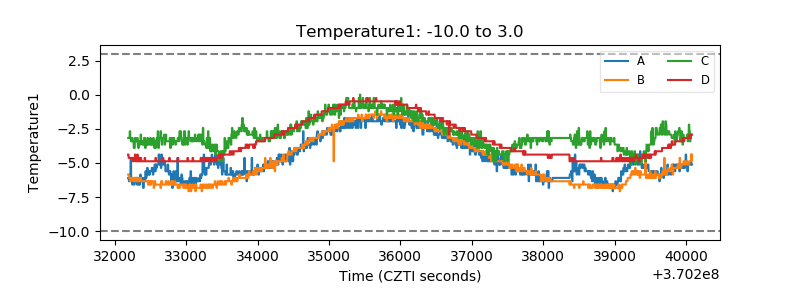 |
| Veto HV Monitor | 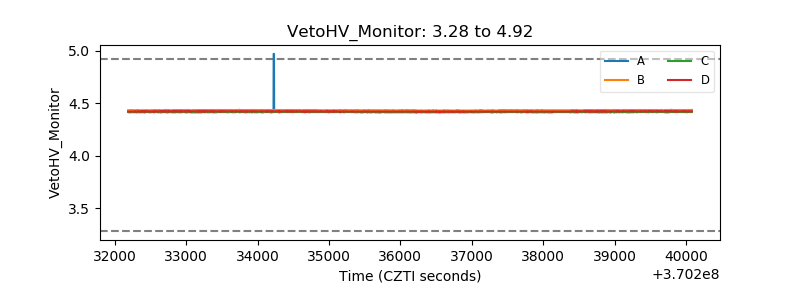 |
| Veto LLD |  |
| Alpha Counter | 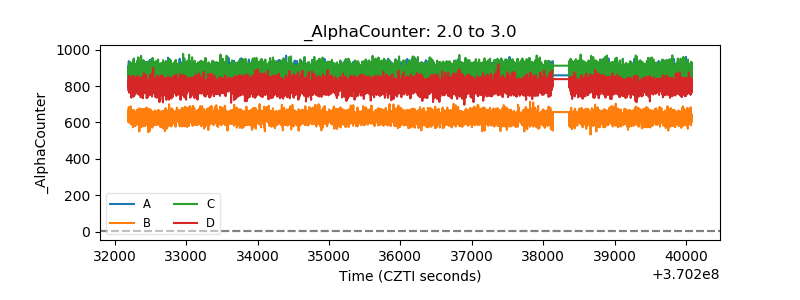 |
| _CPM_Rate | 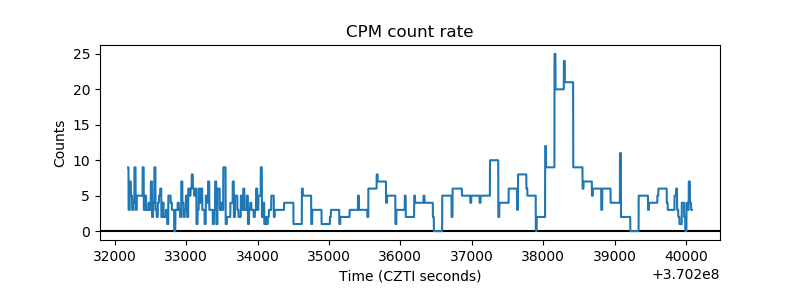 |
| CZT Counter | 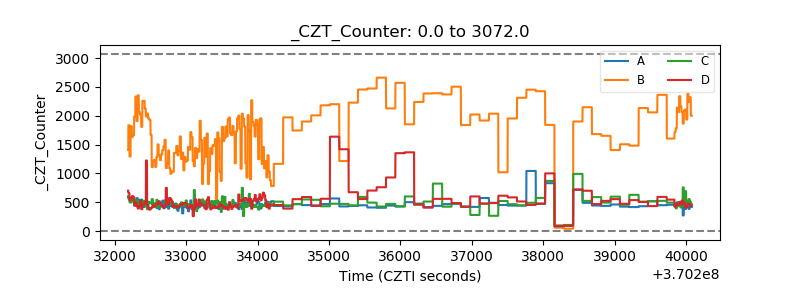 |
| +2.5 Volts monitor | 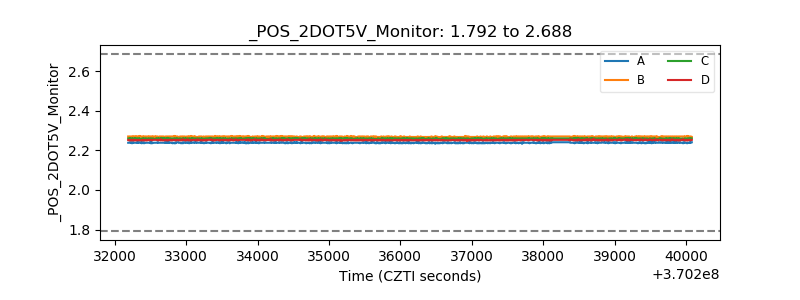 |
| +5 Volts monitor | 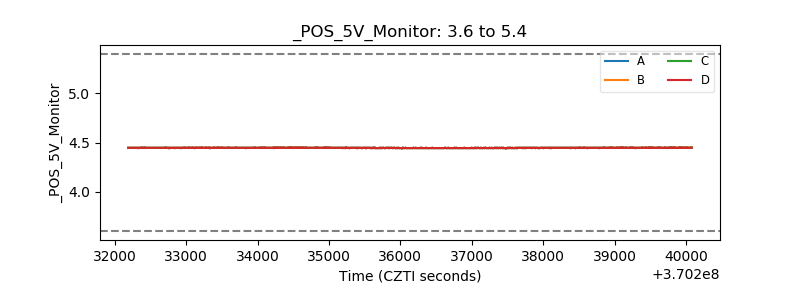 |
| _ROLL_ROT | 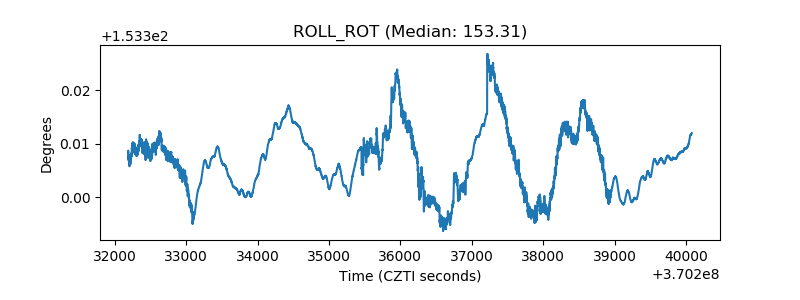 |
| _Roll_DEC | 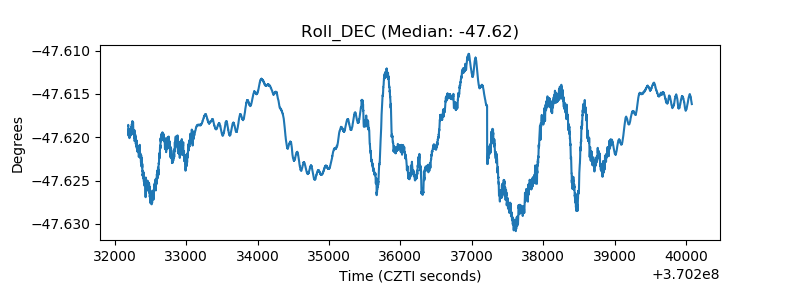 |
| _Roll_RA | 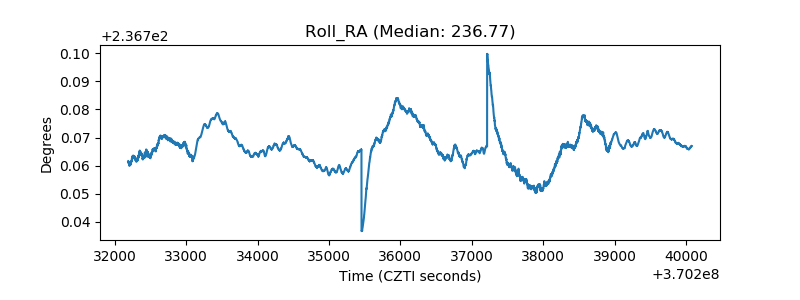 |
| Veto Counter | 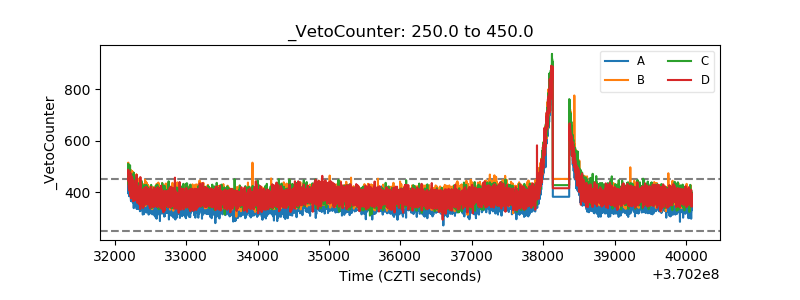 |