| Param | Original file | Final file |
|---|---|---|
| Filename | modeM0/AS1T04_059T01_9000004704_32403cztM0_level2.evt | modeM0/AS1T04_059T01_9000004704_32403cztM0_level2_quad_clean.evt |
| Size (bytes) | 885,988,800 | 109,405,440 |
| Size | 844.9 MB | 104.3 MB |
| Events in quadrant A | 3,698,273 | 741,605 |
| Events in quadrant B | 13,057,213 | 601,714 |
| Events in quadrant C | 4,625,449 | 710,690 |
| Events in quadrant D | 4,910,608 | 701,887 |
| Mode M0 | |||
|---|---|---|---|
| Quadrant | BADHDUFLAG | Total packets | Discarded packets |
| A | 0 | 16178 | 2 |
| B | 0 | 44312 | 1 |
| C | 0 | 18573 | 1 |
| D | 0 | 19653 | 1 |
| Mode M9 | |||
|---|---|---|---|
| Quadrant | BADHDUFLAG | Total packets | Discarded packets |
| A | 0 | 5 | 0 |
| B | 0 | 5 | 0 |
| C | 0 | 5 | 0 |
| D | 0 | 5 | 0 |
| Mode SS | |||
|---|---|---|---|
| Quadrant | BADHDUFLAG | Total packets | Discarded packets |
| A | 0 | 162 | 0 |
| B | 0 | 162 | 0 |
| C | 0 | 162 | 0 |
| D | 0 | 162 | 0 |
| Quadrant | Total seconds | Saturated seconds | Saturation percentage |
|---|---|---|---|
| A | 8002 | 73 | 0.912272% |
| B | 8002 | 3740 | 46.738315% |
| C | 8002 | 381 | 4.761310% |
| D | 8002 | 194 | 2.424394% |
Noise dominated data is calculated using 1-second bins in cleaned event files. If a bin has >2000 counts, and if more than 50% of those come from <1% of pixels, then it is considered to be noise-dominated and hence unusable.
| Quadrant | # 1 sec bins | Bins with >0 counts | Bins with >2000 counts | High rate bins dominated by noise | Noise dominated (total time) | Noise dominated (detector-on time) | Marked lightcurve |
|---|---|---|---|---|---|---|---|
| A | 8502 | 8003 | 0 | 0 | 0.00% | 0.00% | 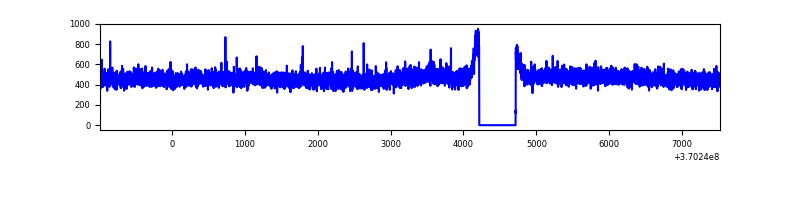 |
| B | 8502 | 8003 | 2801 | 2801 | 32.95% | 35.00% | 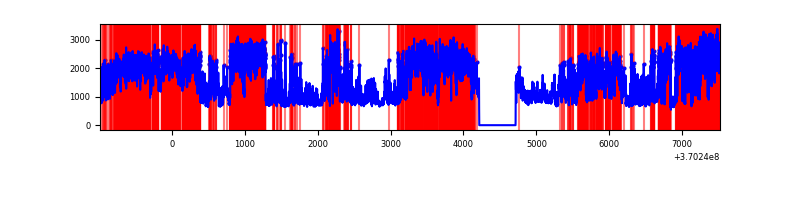 |
| C | 8502 | 8003 | 196 | 196 | 2.31% | 2.45% | 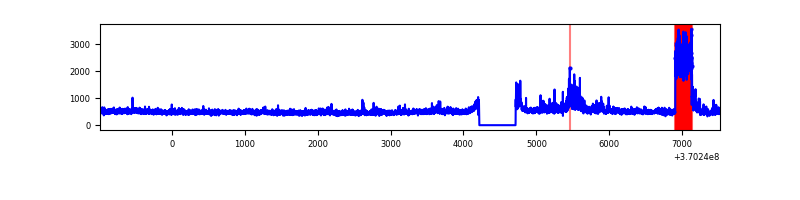 |
| D | 8502 | 8003 | 129 | 129 | 1.52% | 1.61% | 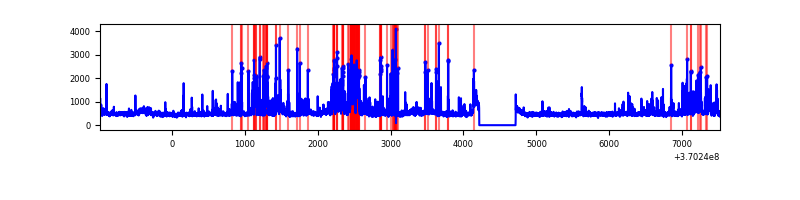 |
Top three noisy pixels from each quadrant. If the there are fewer than three noisy pixels in the level2.evt file, extra rows are filled as -1
| Pixel properties | Quadrant properties | ||||||
|---|---|---|---|---|---|---|---|
| Quadrant | DetID | PixID | Counts | Sigma | Mean | Median | Sigma |
| A | 13 | 254 | 15900 | 78.38 | 953 | 932 | 191.0 |
| A | 13 | 6 | 10169 | 48.37 | 953 | 932 | 191.0 |
| A | 3 | 137 | 9701 | 45.92 | 953 | 932 | 191.0 |
| B | 4 | 80 | 7677189 | 50049.03 | 792 | 769 | 153.4 |
| B | 6 | 159 | 1855393 | 12091.85 | 792 | 769 | 153.4 |
| B | 10 | 245 | 147964 | 959.69 | 792 | 769 | 153.4 |
| C | 3 | 233 | 809871 | 3802.51 | 902 | 906 | 212.7 |
| C | 14 | 238 | 154518 | 722.05 | 902 | 906 | 212.7 |
| C | 14 | 67 | 56170 | 259.77 | 902 | 906 | 212.7 |
| D | 12 | 233 | 550837 | 2495.44 | 923 | 898 | 220.4 |
| D | 1 | 47 | 256721 | 1160.84 | 923 | 898 | 220.4 |
| D | 8 | 195 | 239504 | 1082.72 | 923 | 898 | 220.4 |
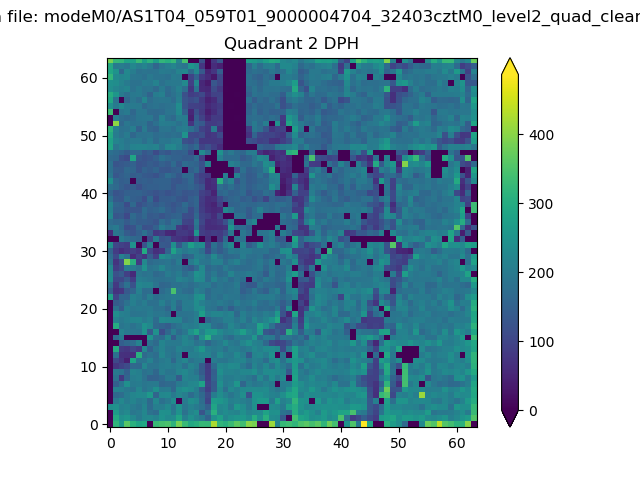
Histogram calculated using DETX and DETY for each event in the final _common_clean file
| Quadrant A | 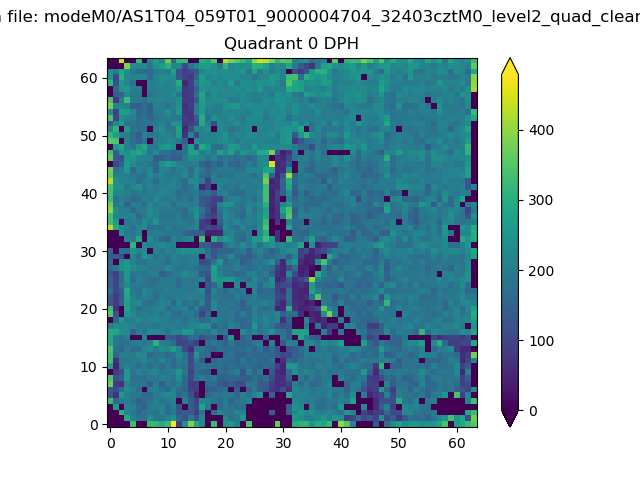 |
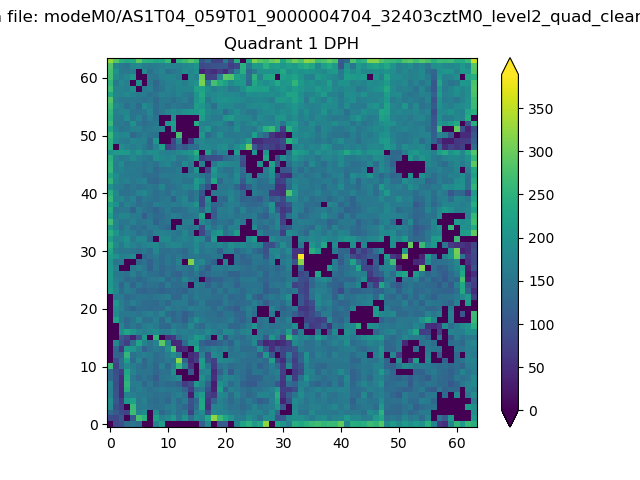 |
Quadrant B |
|---|---|---|---|
| Quadrant D | 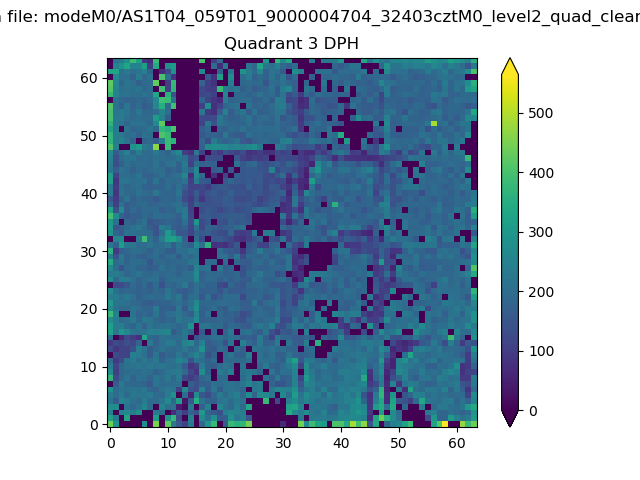 |
 |
Quadrant C |
| Plot type | Count rate plots | Images |
|---|---|---|
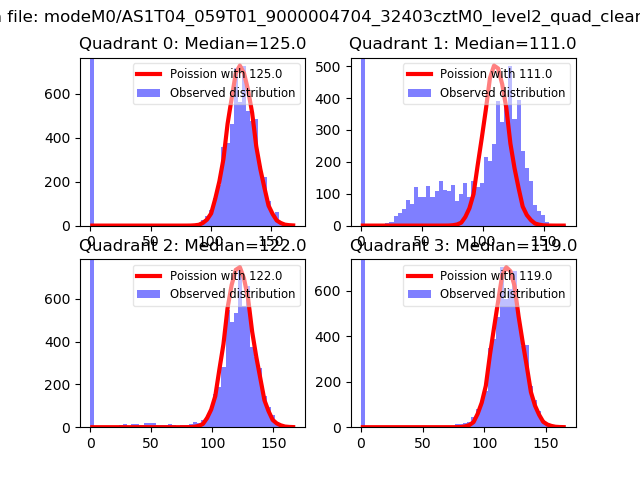
| Comparison with Poisson distribution Blue bars denote a histogram of data divided into 1 sec bins. Red curve is a Poisson curve with rate = median count rate of data. |
 |
 |
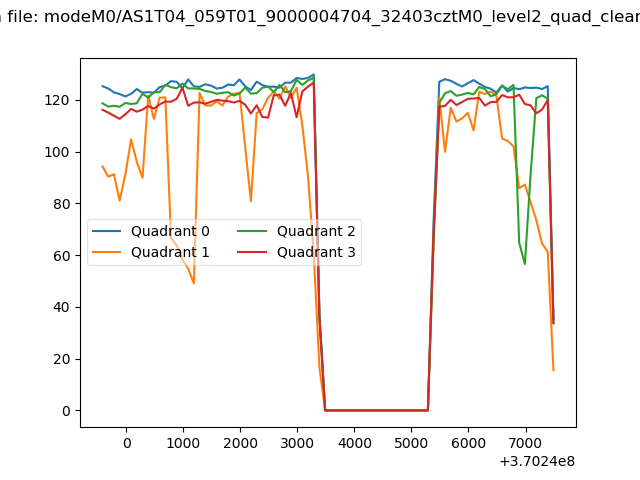
| Quadrant-wise count rates Data is divided into 100 sec bins |
 |
|
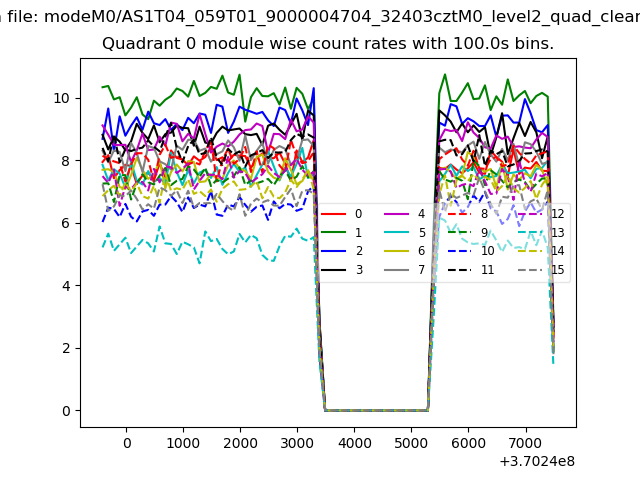
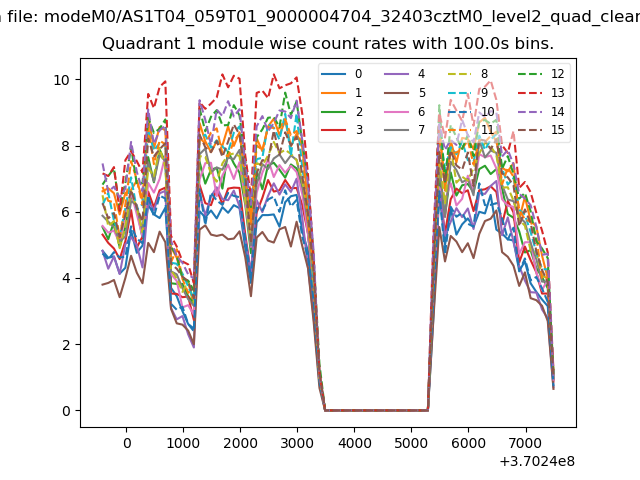
| Module-wise count rates for Quadrant A Data is divided into 100 sec bins |
 |
 |
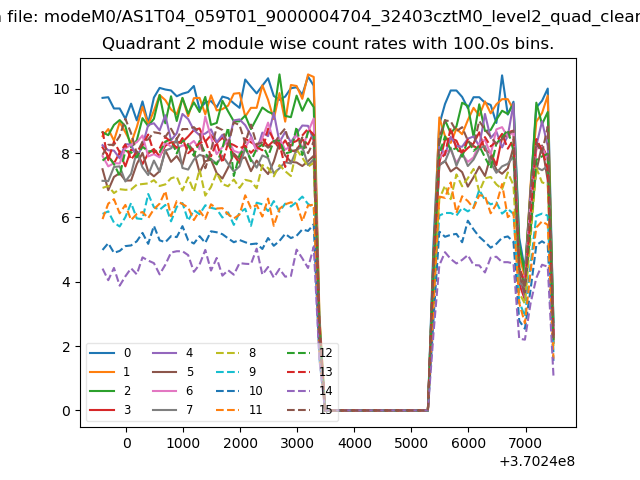
| Module-wise count rates for Quadrant B Data is divided into 100 sec bins |
 |
 |
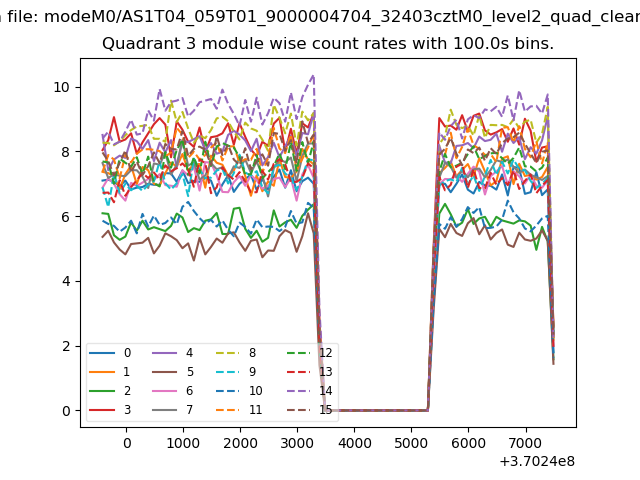
| Module-wise count rates for Quadrant C Data is divided into 100 sec bins |
 |
 |
| Module-wise count rates for Quadrant D Data is divided into 100 sec bins |
 |
 |
| Parameter | Plot |
|---|---|
| CZT HV Monitor | 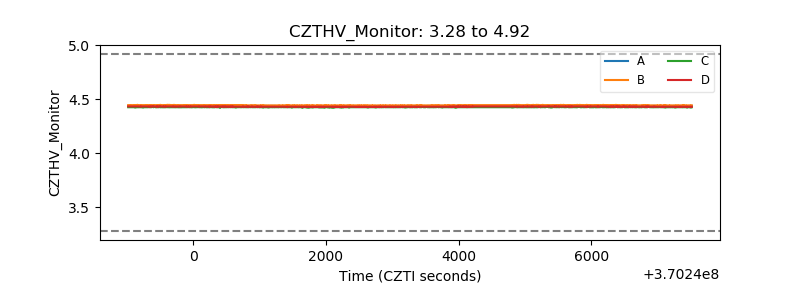 |
| D_VDD | 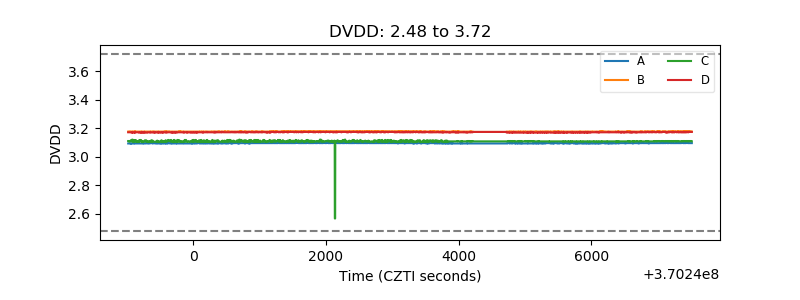 |
| Temperature 1 | 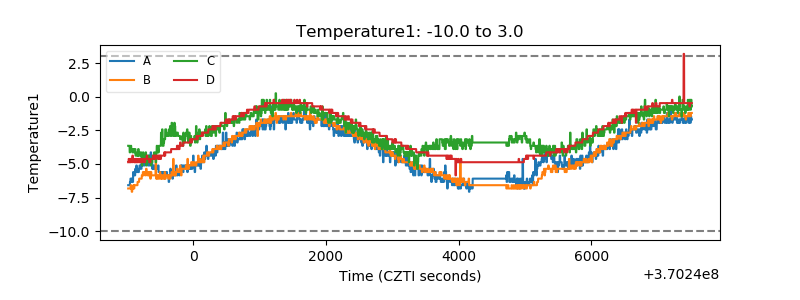 |
| Veto HV Monitor | 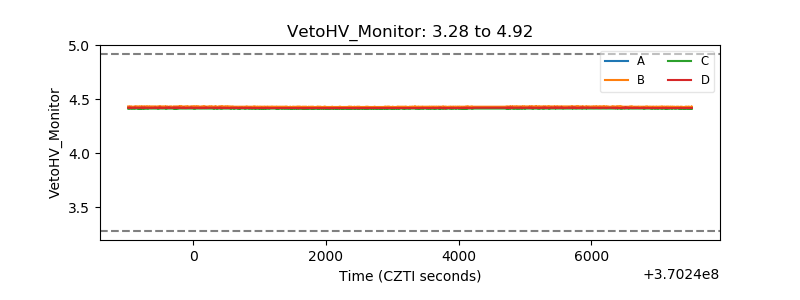 |
| Veto LLD | 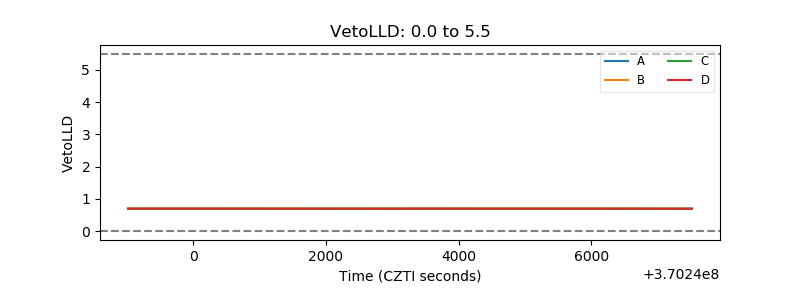 |
| Alpha Counter | 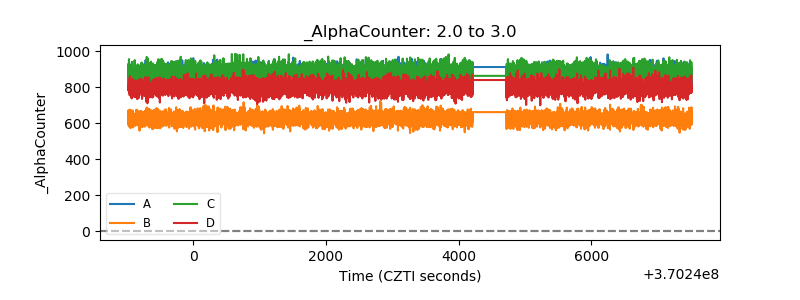 |
| _CPM_Rate | 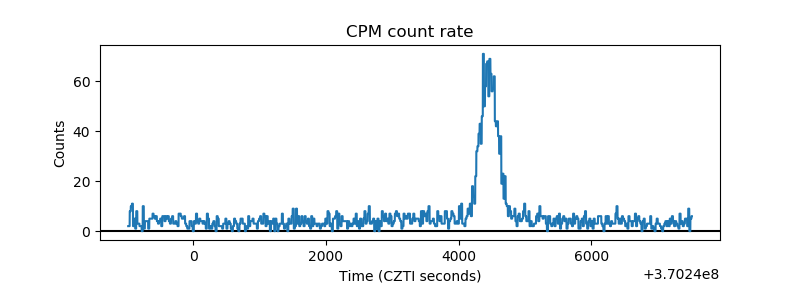 |
| CZT Counter | 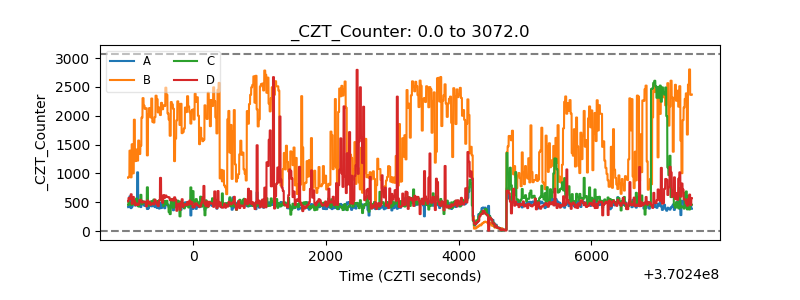 |
| +2.5 Volts monitor |  |
| +5 Volts monitor |  |
| _ROLL_ROT | 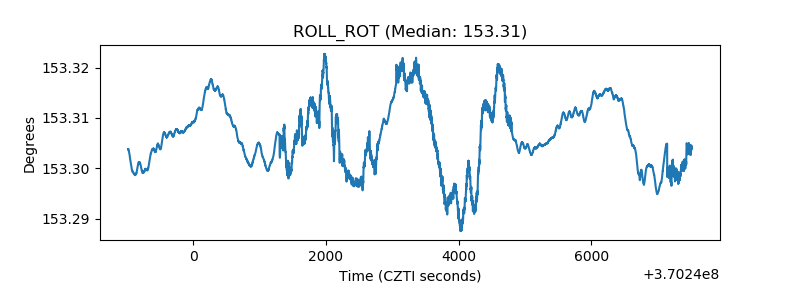 |
| _Roll_DEC | 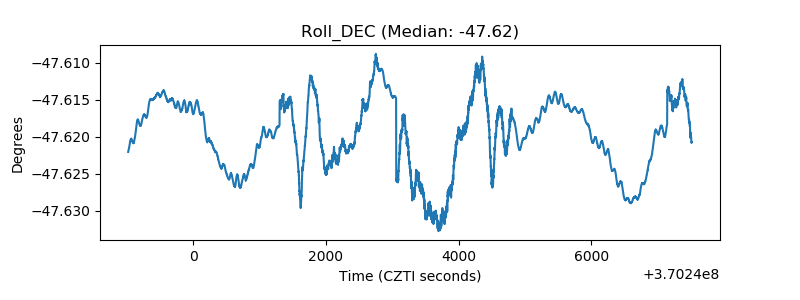 |
| _Roll_RA | 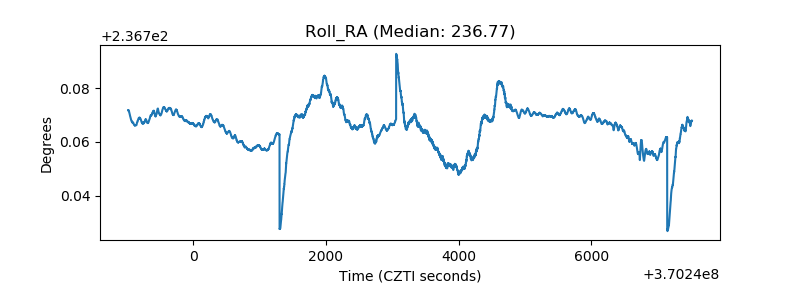 |
| Veto Counter | 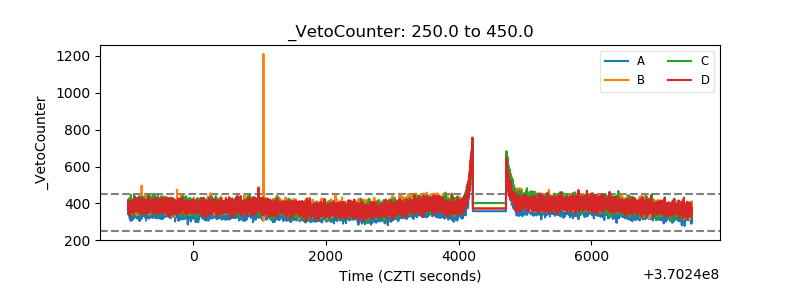 |