| Param | Original file | Final file |
|---|---|---|
| Filename | modeM0/AS1T04_059T01_9000004704_32404cztM0_level2.evt | modeM0/AS1T04_059T01_9000004704_32404cztM0_level2_quad_clean.evt |
| Size (bytes) | 1,053,267,840 | 142,827,840 |
| Size | 1004.5 MB | 136.2 MB |
| Events in quadrant A | 4,781,129 | 961,488 |
| Events in quadrant B | 14,601,598 | 821,140 |
| Events in quadrant C | 5,513,849 | 924,426 |
| Events in quadrant D | 6,315,991 | 913,153 |
| Mode M0 | |||
|---|---|---|---|
| Quadrant | BADHDUFLAG | Total packets | Discarded packets |
| A | 0 | 20809 | 3 |
| B | 0 | 50397 | 2 |
| C | 0 | 22663 | 2 |
| D | 0 | 25269 | 2 |
| Mode M9 | |||
|---|---|---|---|
| Quadrant | BADHDUFLAG | Total packets | Discarded packets |
| A | 0 | 14 | 0 |
| B | 0 | 14 | 0 |
| C | 0 | 14 | 0 |
| D | 0 | 14 | 0 |
| Mode SS | |||
|---|---|---|---|
| Quadrant | BADHDUFLAG | Total packets | Discarded packets |
| A | 0 | 210 | 0 |
| B | 0 | 210 | 0 |
| C | 0 | 210 | 0 |
| D | 0 | 210 | 0 |
| Quadrant | Total seconds | Saturated seconds | Saturation percentage |
|---|---|---|---|
| A | 10154 | 113 | 1.112862% |
| B | 10154 | 3385 | 33.336616% |
| C | 10154 | 419 | 4.126453% |
| D | 10154 | 244 | 2.402994% |
Noise dominated data is calculated using 1-second bins in cleaned event files. If a bin has >2000 counts, and if more than 50% of those come from <1% of pixels, then it is considered to be noise-dominated and hence unusable.
| Quadrant | # 1 sec bins | Bins with >0 counts | Bins with >2000 counts | High rate bins dominated by noise | Noise dominated (total time) | Noise dominated (detector-on time) | Marked lightcurve |
|---|---|---|---|---|---|---|---|
| A | 11679 | 10156 | 0 | 0 | 0.00% | 0.00% | 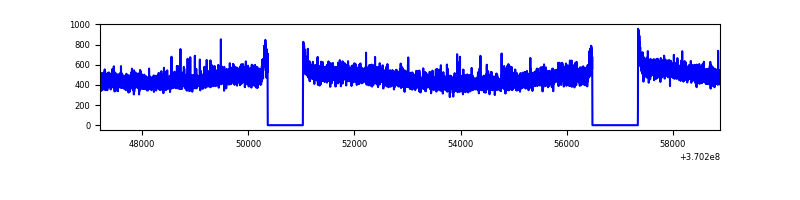 |
| B | 11679 | 10156 | 2633 | 2633 | 22.54% | 25.93% | 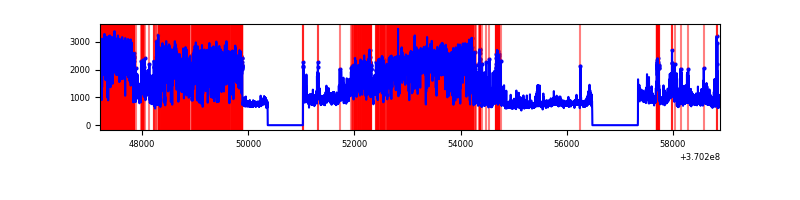 |
| C | 11679 | 10156 | 85 | 85 | 0.73% | 0.84% | 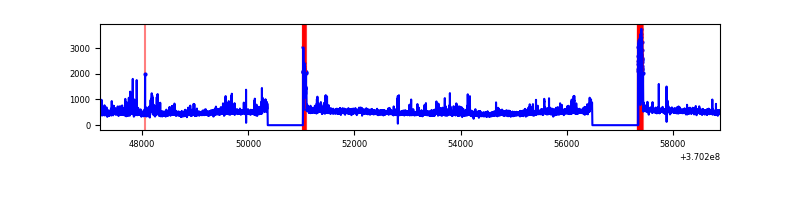 |
| D | 11679 | 10156 | 138 | 138 | 1.18% | 1.36% | 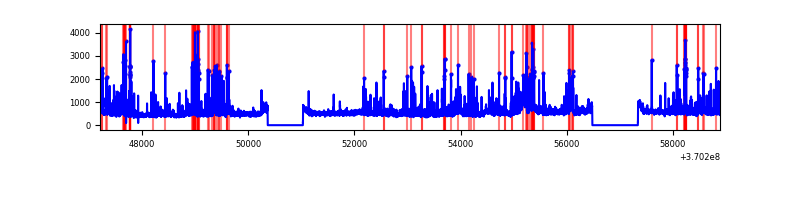 |
Top three noisy pixels from each quadrant. If the there are fewer than three noisy pixels in the level2.evt file, extra rows are filled as -1
| Pixel properties | Quadrant properties | ||||||
|---|---|---|---|---|---|---|---|
| Quadrant | DetID | PixID | Counts | Sigma | Mean | Median | Sigma |
| A | 13 | 254 | 19658 | 74.37 | 1234 | 1209 | 248.1 |
| A | 13 | 6 | 12674 | 46.22 | 1234 | 1209 | 248.1 |
| A | 3 | 137 | 12525 | 45.62 | 1234 | 1209 | 248.1 |
| B | 4 | 80 | 7386626 | 34824.97 | 1102 | 1073 | 212.1 |
| B | 6 | 159 | 2462463 | 11606.15 | 1102 | 1073 | 212.1 |
| B | 0 | 190 | 209258 | 981.65 | 1102 | 1073 | 212.1 |
| C | 3 | 233 | 321375 | 1170.13 | 1155 | 1162 | 273.7 |
| C | 0 | 10 | 295270 | 1074.74 | 1155 | 1162 | 273.7 |
| C | 14 | 238 | 230324 | 837.41 | 1155 | 1162 | 273.7 |
| D | 8 | 195 | 586823 | 2060.09 | 1190 | 1161 | 284.3 |
| D | 1 | 47 | 522542 | 1833.98 | 1190 | 1161 | 284.3 |
| D | 12 | 233 | 200231 | 700.24 | 1190 | 1161 | 284.3 |
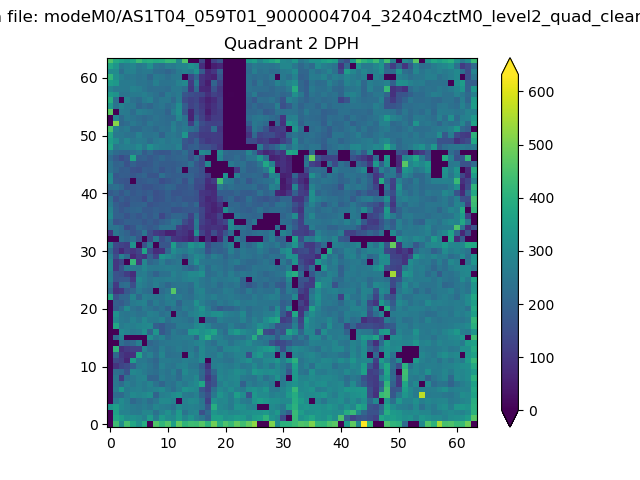
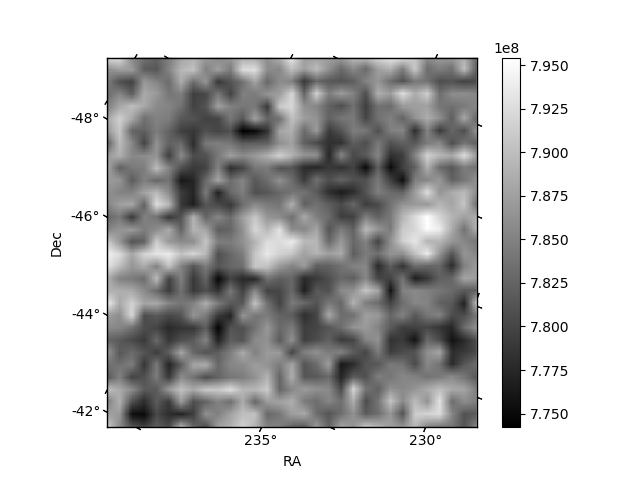
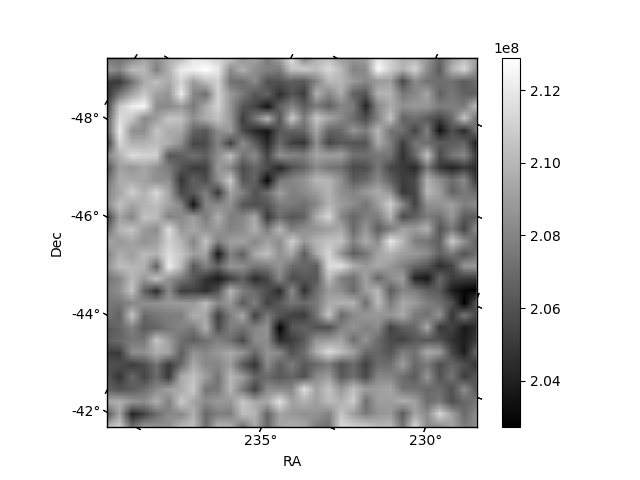
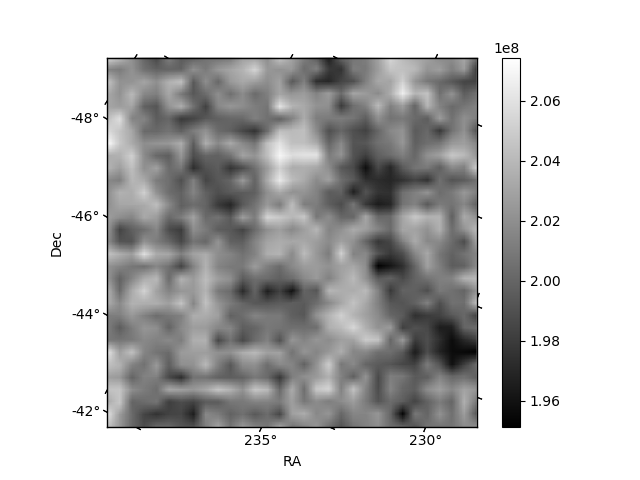
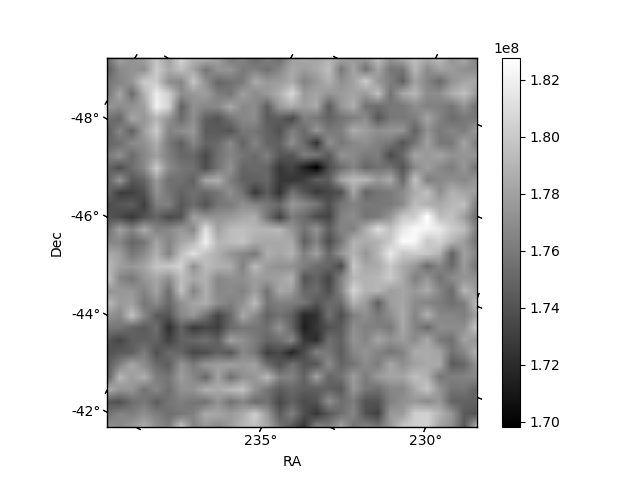
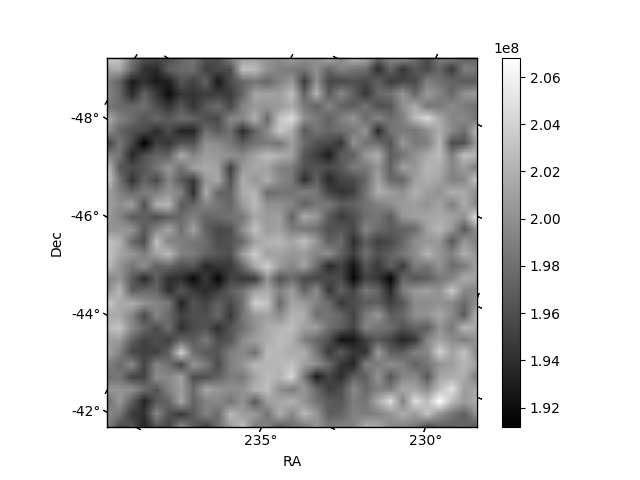
Histogram calculated using DETX and DETY for each event in the final _common_clean file
| Quadrant A | 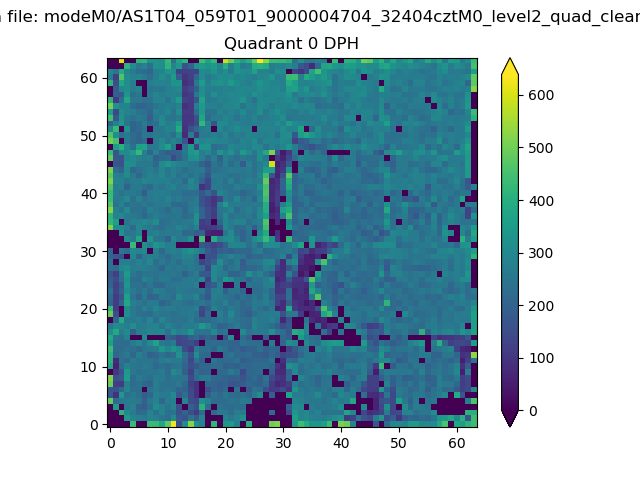 |
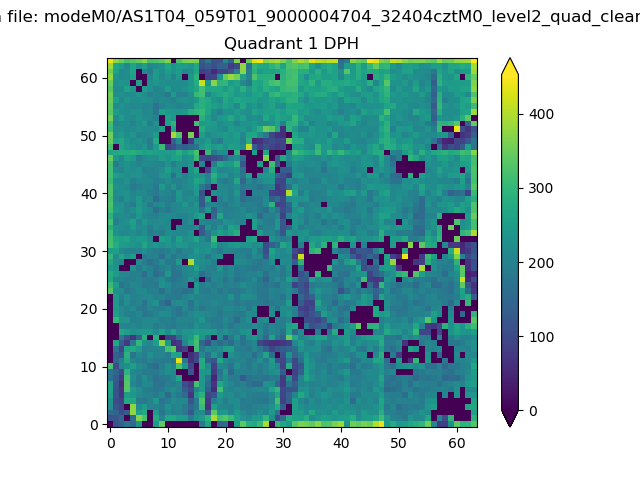 |
Quadrant B |
|---|---|---|---|
| Quadrant D | 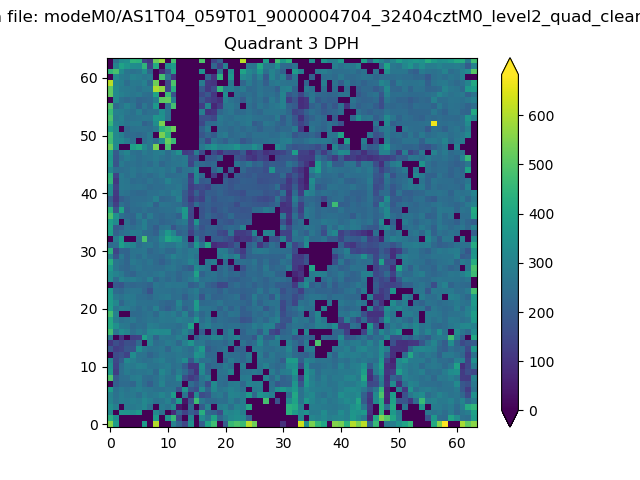 |
 |
Quadrant C |
| Plot type | Count rate plots | Images |
|---|---|---|
| Comparison with Poisson distribution Blue bars denote a histogram of data divided into 1 sec bins. Red curve is a Poisson curve with rate = median count rate of data. |
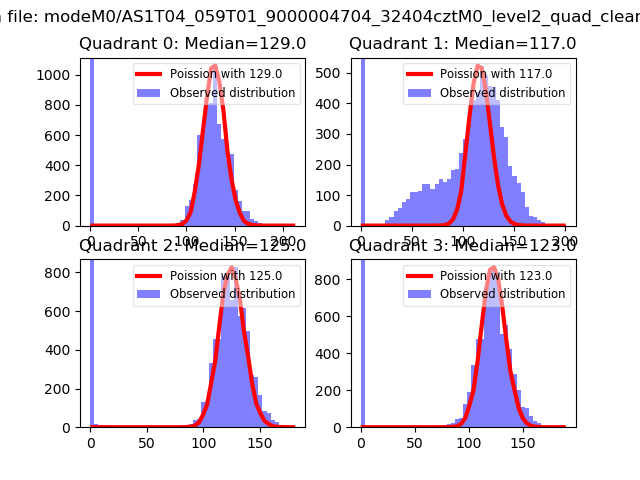 |
 |
| Quadrant-wise count rates Data is divided into 100 sec bins |
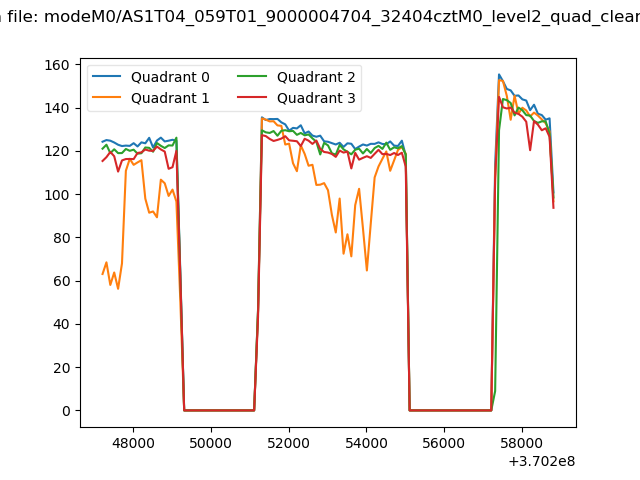 |
|
| Module-wise count rates for Quadrant A Data is divided into 100 sec bins |
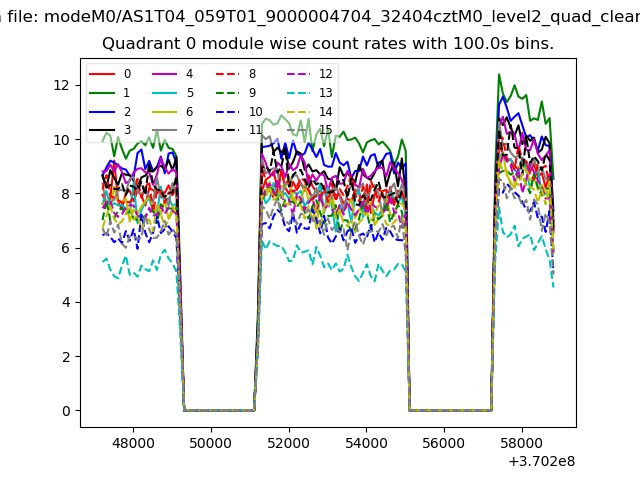 |
 |
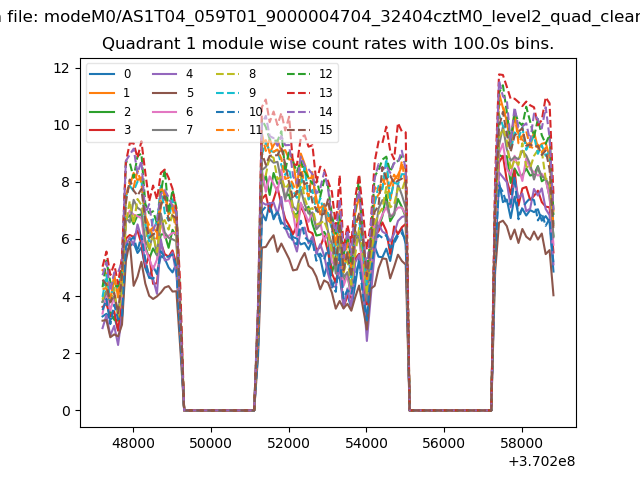
| Module-wise count rates for Quadrant B Data is divided into 100 sec bins |
 |
 |
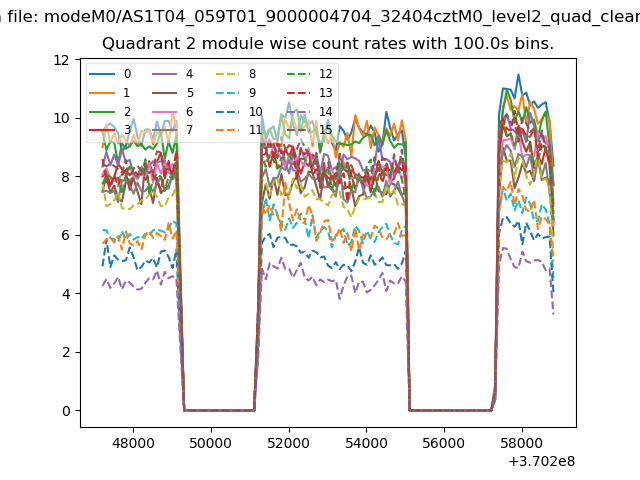
| Module-wise count rates for Quadrant C Data is divided into 100 sec bins |
 |
 |
| Module-wise count rates for Quadrant D Data is divided into 100 sec bins |
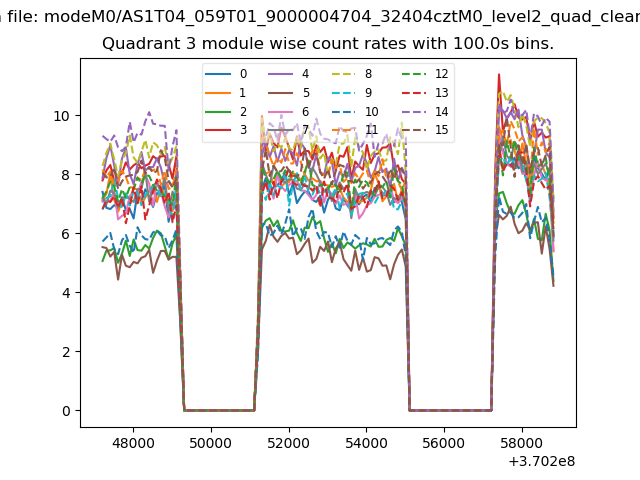 |
 |
| Parameter | Plot |
|---|---|
| CZT HV Monitor |  |
| D_VDD | 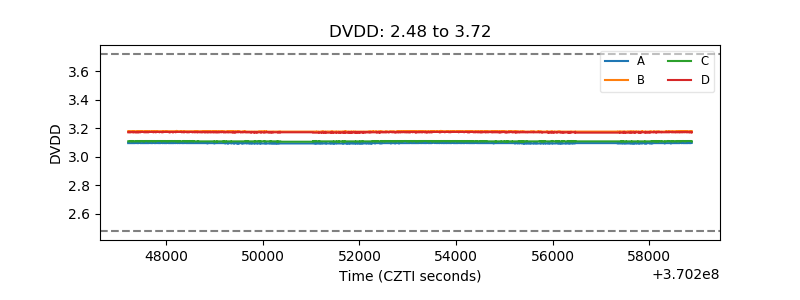 |
| Temperature 1 | 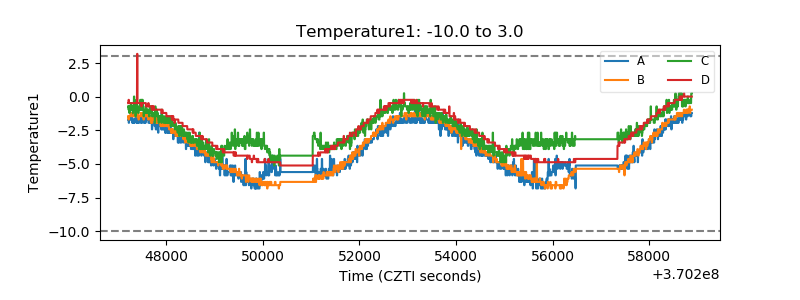 |
| Veto HV Monitor | 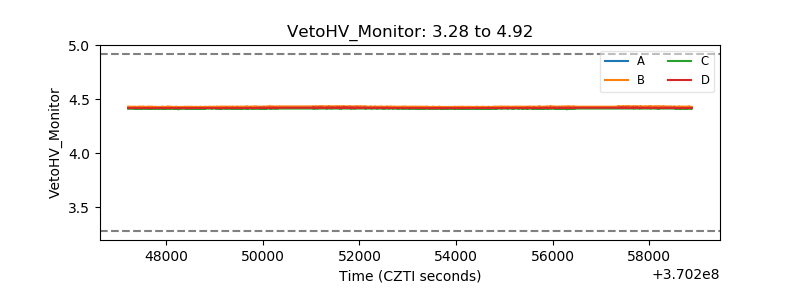 |
| Veto LLD | 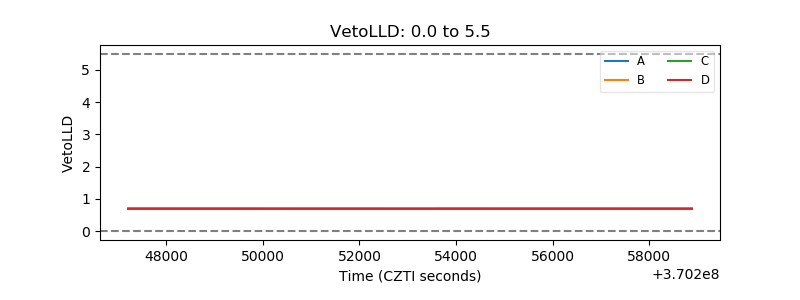 |
| Alpha Counter | 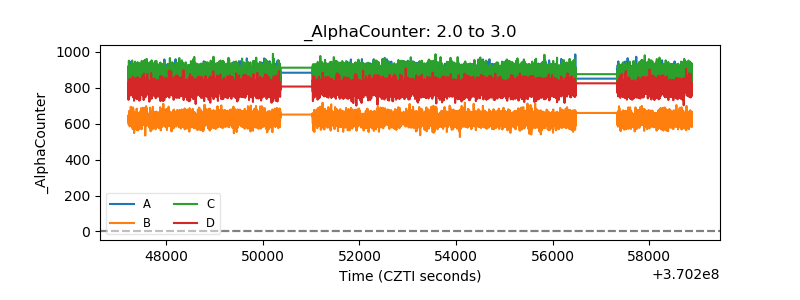 |
| _CPM_Rate | 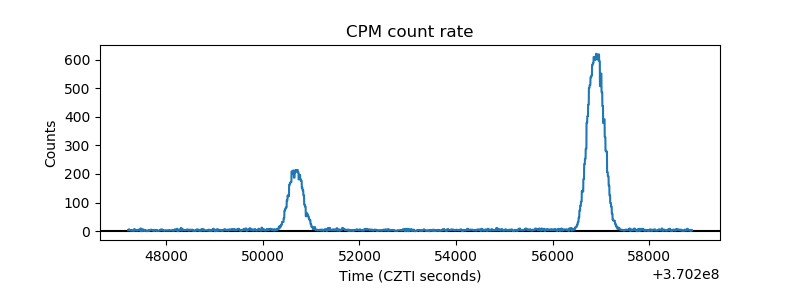 |
| CZT Counter | 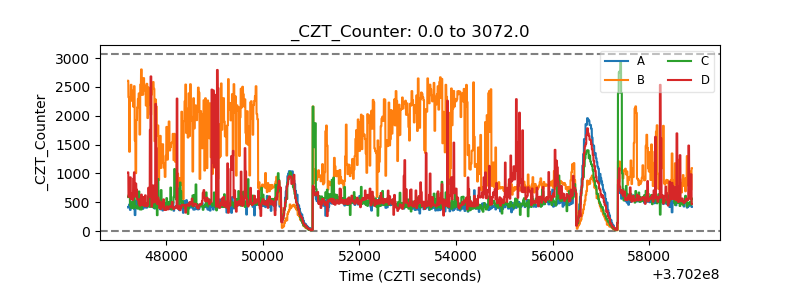 |
| +2.5 Volts monitor |  |
| +5 Volts monitor | 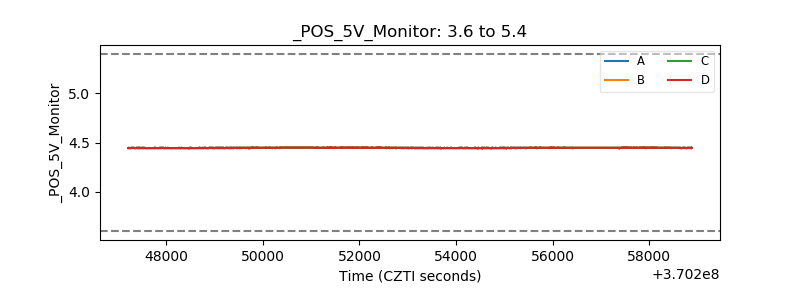 |
| _ROLL_ROT | 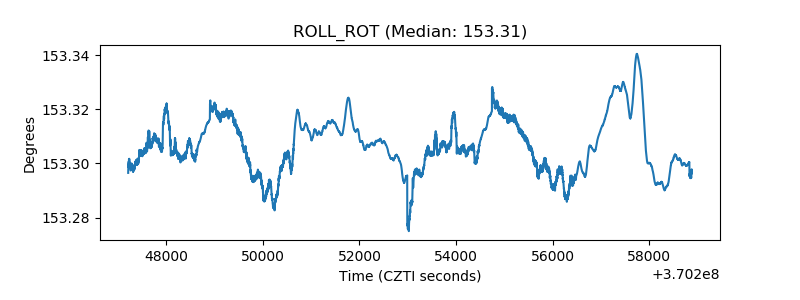 |
| _Roll_DEC | 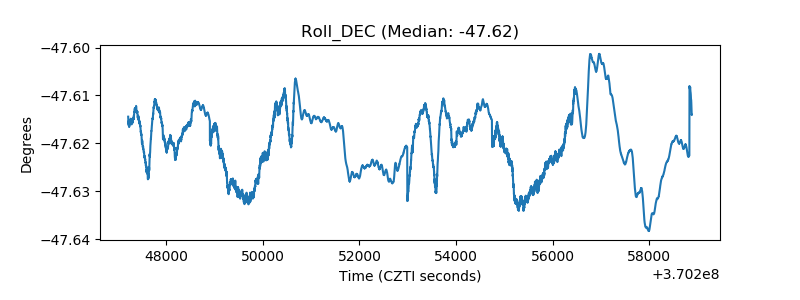 |
| _Roll_RA | 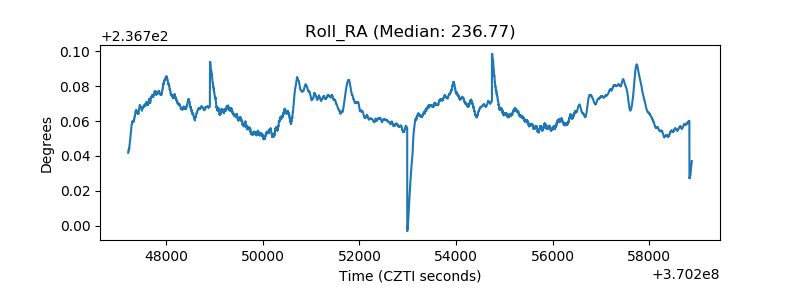 |
| Veto Counter | 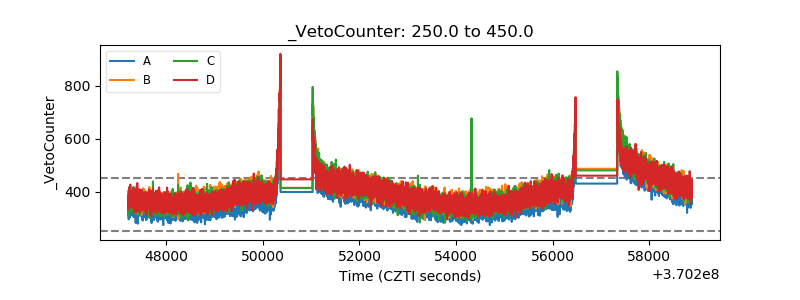 |