| Param | Original file | Final file |
|---|---|---|
| Filename | modeM0/AS1T04_059T01_9000004704_32405cztM0_level2.evt | modeM0/AS1T04_059T01_9000004704_32405cztM0_level2_quad_clean.evt |
| Size (bytes) | 598,754,880 | 85,354,560 |
| Size | 571.0 MB | 81.4 MB |
| Events in quadrant A | 2,922,562 | 587,907 |
| Events in quadrant B | 5,796,112 | 552,964 |
| Events in quadrant C | 5,161,725 | 478,064 |
| Events in quadrant D | 3,852,039 | 551,352 |
| Mode M0 | |||
|---|---|---|---|
| Quadrant | BADHDUFLAG | Total packets | Discarded packets |
| A | 0 | 12639 | 2 |
| B | 0 | 21182 | 1 |
| C | 0 | 19259 | 1 |
| D | 0 | 15363 | 1 |
| Mode M9 | |||
|---|---|---|---|
| Quadrant | BADHDUFLAG | Total packets | Discarded packets |
| A | 0 | 10 | 0 |
| B | 0 | 10 | 0 |
| C | 0 | 10 | 0 |
| D | 0 | 10 | 0 |
| Mode SS | |||
|---|---|---|---|
| Quadrant | BADHDUFLAG | Total packets | Discarded packets |
| A | 0 | 122 | 0 |
| B | 0 | 122 | 0 |
| C | 0 | 122 | 0 |
| D | 0 | 122 | 0 |
| Quadrant | Total seconds | Saturated seconds | Saturation percentage |
|---|---|---|---|
| A | 5918 | 61 | 1.030754% |
| B | 5918 | 375 | 6.336600% |
| C | 5918 | 1158 | 19.567421% |
| D | 5918 | 162 | 2.737411% |
Noise dominated data is calculated using 1-second bins in cleaned event files. If a bin has >2000 counts, and if more than 50% of those come from <1% of pixels, then it is considered to be noise-dominated and hence unusable.
| Quadrant | # 1 sec bins | Bins with >0 counts | Bins with >2000 counts | High rate bins dominated by noise | Noise dominated (total time) | Noise dominated (detector-on time) | Marked lightcurve |
|---|---|---|---|---|---|---|---|
| A | 6923 | 5919 | 8 | 8 | 0.12% | 0.14% | 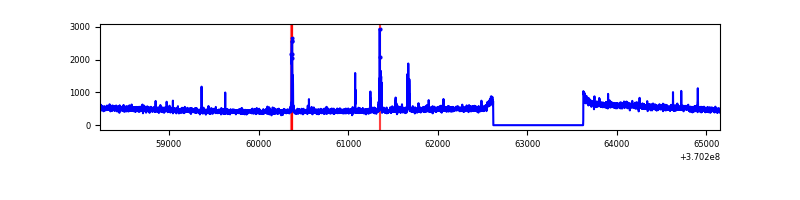 |
| B | 6923 | 5919 | 230 | 230 | 3.32% | 3.89% | 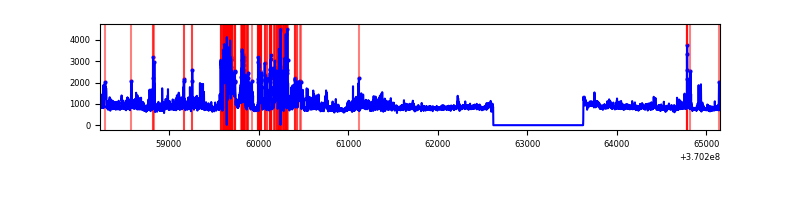 |
| C | 6923 | 5919 | 704 | 704 | 10.17% | 11.89% | 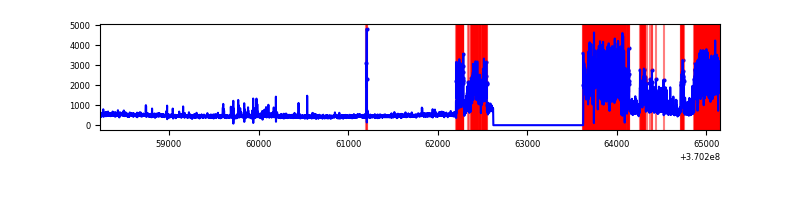 |
| D | 6923 | 5919 | 109 | 109 | 1.57% | 1.84% | 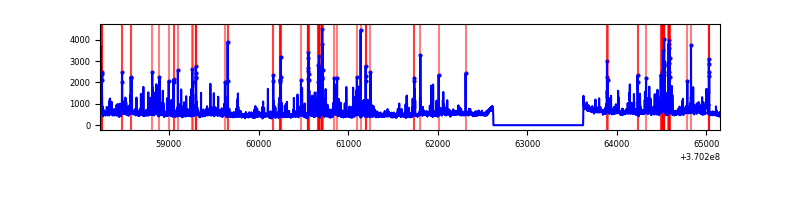 |
Top three noisy pixels from each quadrant. If the there are fewer than three noisy pixels in the level2.evt file, extra rows are filled as -1
| Pixel properties | Quadrant properties | ||||||
|---|---|---|---|---|---|---|---|
| Quadrant | DetID | PixID | Counts | Sigma | Mean | Median | Sigma |
| A | 15 | 174 | 70297 | 474.64 | 734 | 722 | 146.6 |
| A | 13 | 254 | 11478 | 73.38 | 734 | 722 | 146.6 |
| A | 7 | 16 | 7796 | 48.26 | 734 | 722 | 146.6 |
| B | 6 | 159 | 1574548 | 11773.59 | 701 | 683 | 133.7 |
| B | 5 | 172 | 746070 | 5576.0 | 701 | 683 | 133.7 |
| B | 4 | 80 | 613080 | 4581.15 | 701 | 683 | 133.7 |
| C | 3 | 233 | 2510062 | 17468.48 | 611 | 614 | 143.7 |
| C | 14 | 238 | 133723 | 926.58 | 611 | 614 | 143.7 |
| C | 14 | 254 | 53990 | 371.55 | 611 | 614 | 143.7 |
| D | 1 | 47 | 360700 | 2155.53 | 702 | 686 | 167.0 |
| D | 8 | 195 | 221315 | 1320.98 | 702 | 686 | 167.0 |
| D | 12 | 233 | 188604 | 1125.13 | 702 | 686 | 167.0 |
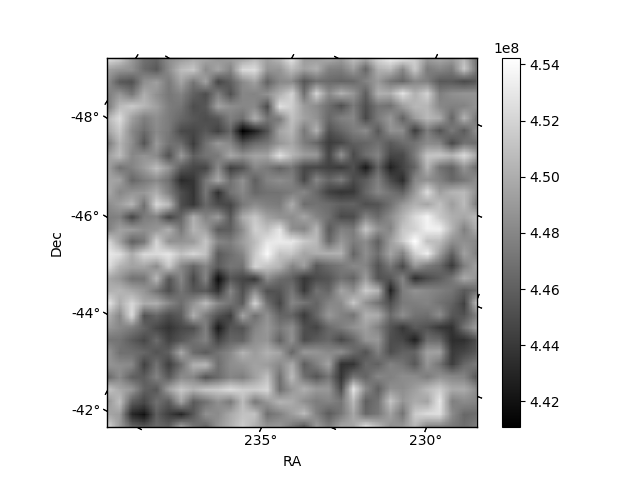
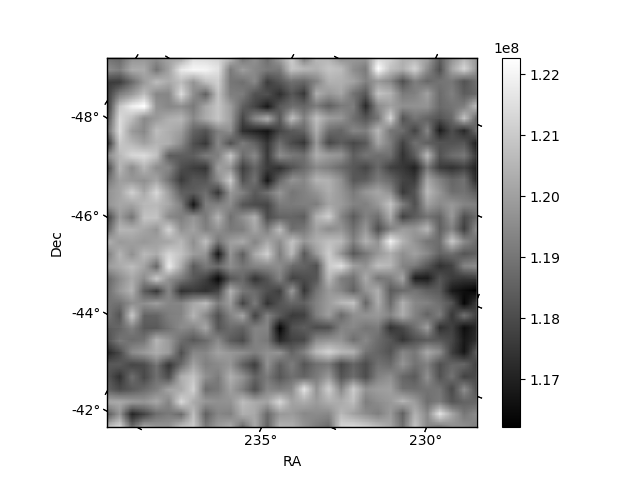
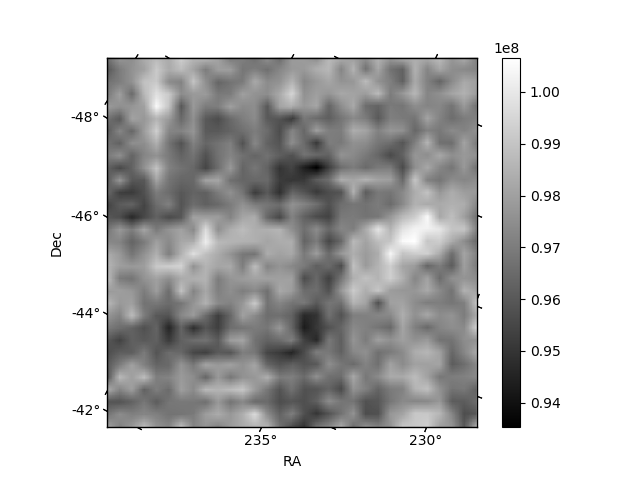
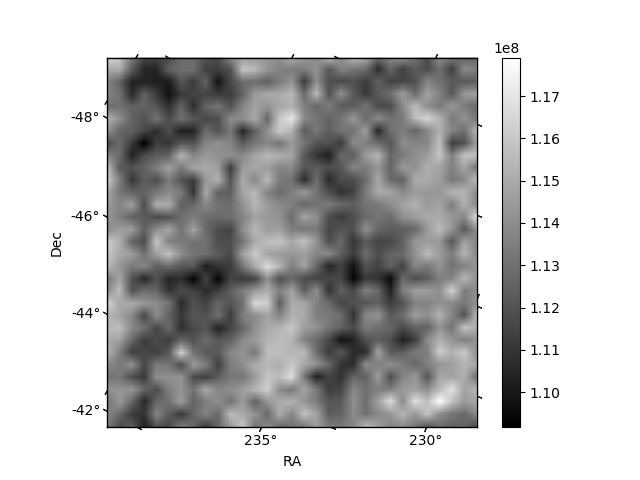
Histogram calculated using DETX and DETY for each event in the final _common_clean file
| Quadrant A | 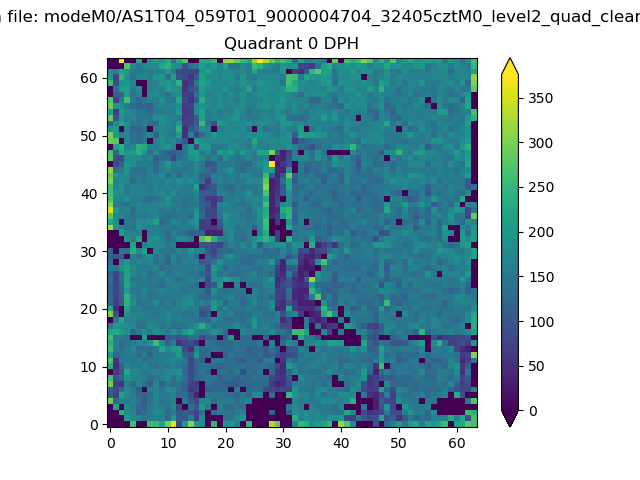 |
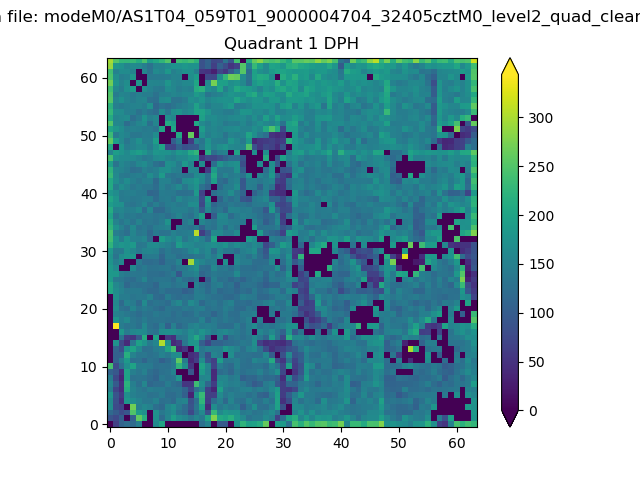 |
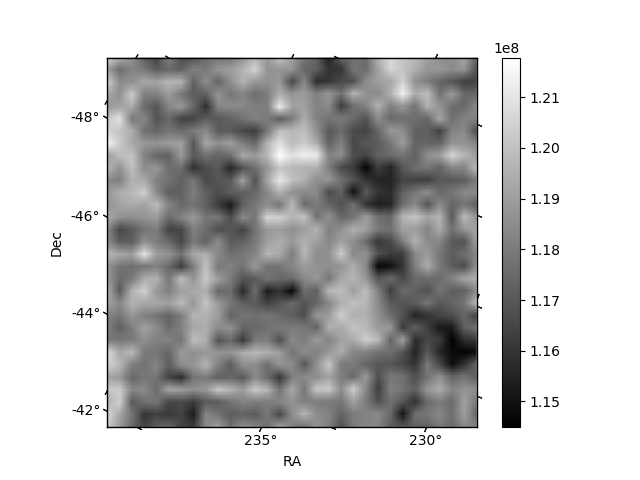
Quadrant B |
|---|---|---|---|
| Quadrant D | 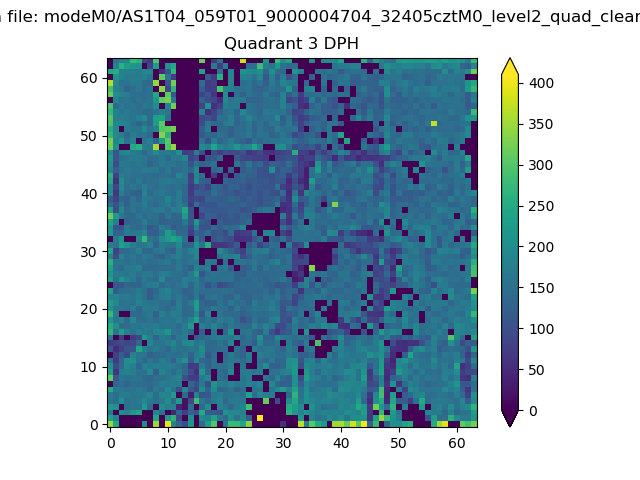 |
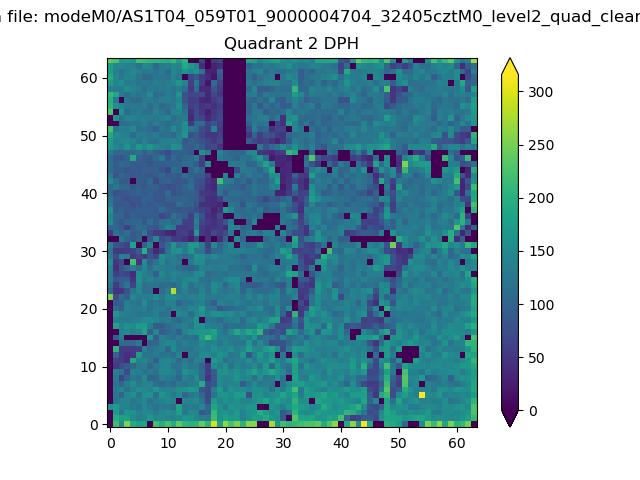 |
Quadrant C |
| Plot type | Count rate plots | Images |
|---|---|---|
| Comparison with Poisson distribution Blue bars denote a histogram of data divided into 1 sec bins. Red curve is a Poisson curve with rate = median count rate of data. |
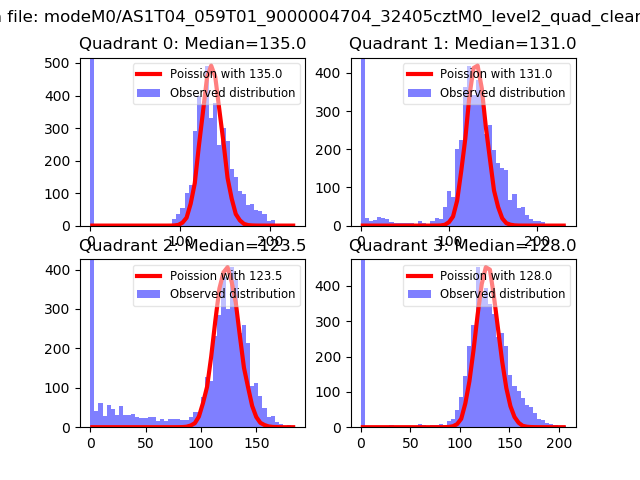 |
 |
| Quadrant-wise count rates Data is divided into 100 sec bins |
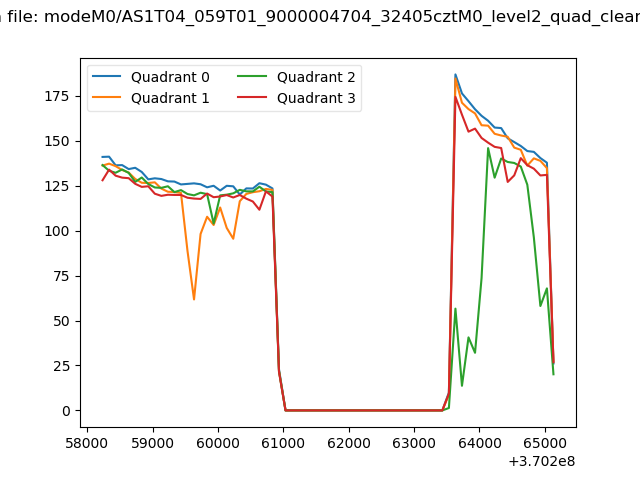 |
|
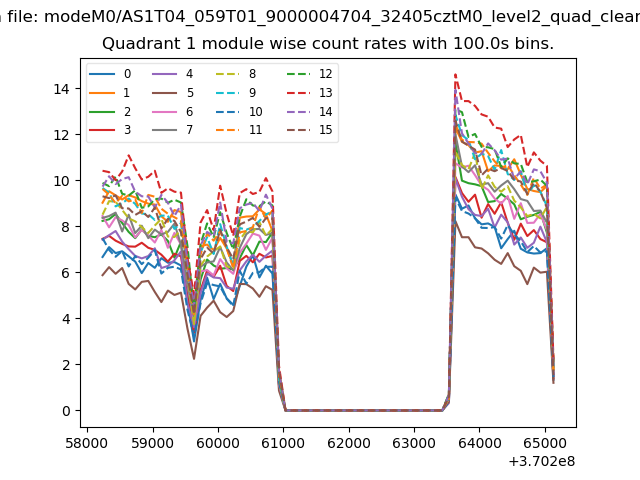
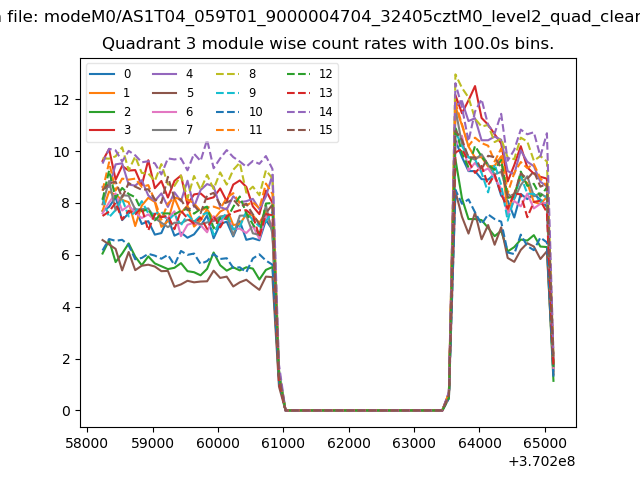
| Module-wise count rates for Quadrant A Data is divided into 100 sec bins |
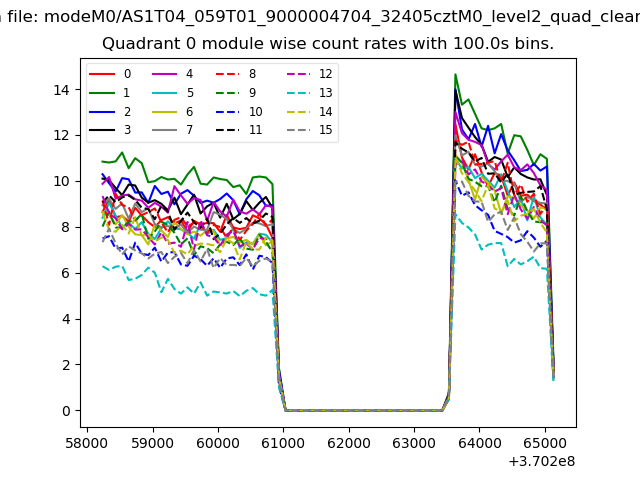 |
 |
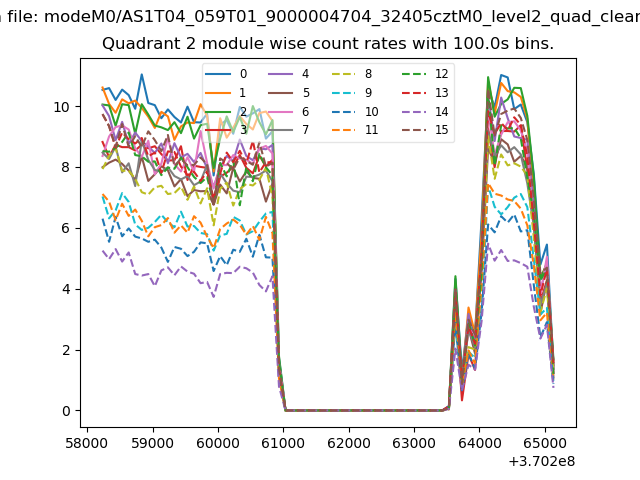
| Module-wise count rates for Quadrant B Data is divided into 100 sec bins |
 |
 |
| Module-wise count rates for Quadrant C Data is divided into 100 sec bins |
 |
 |
| Module-wise count rates for Quadrant D Data is divided into 100 sec bins |
 |
 |
| Parameter | Plot |
|---|---|
| CZT HV Monitor | 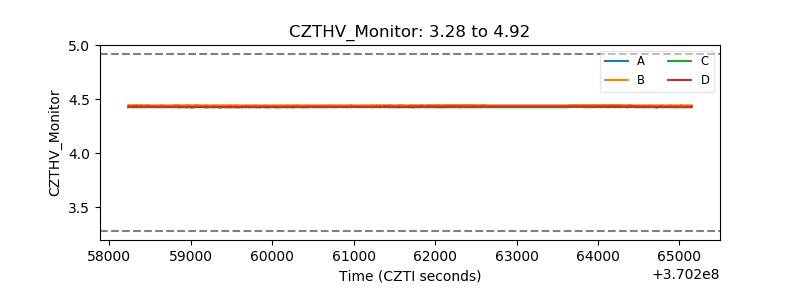 |
| D_VDD | 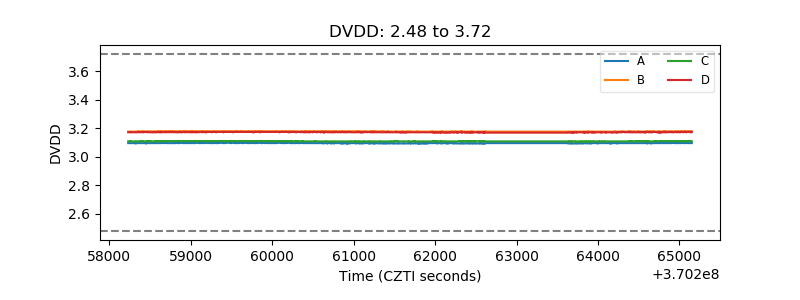 |
| Temperature 1 | 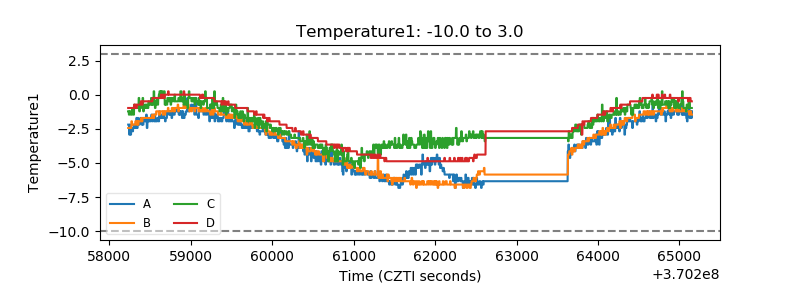 |
| Veto HV Monitor | 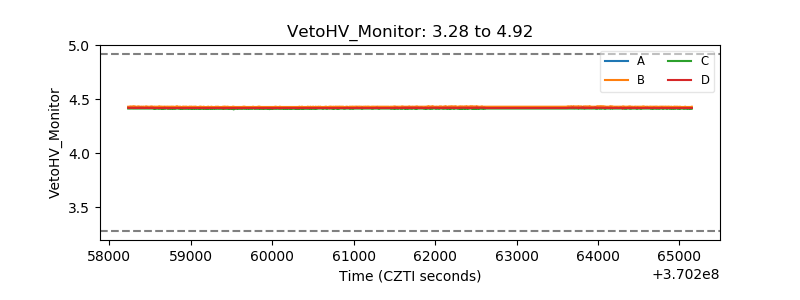 |
| Veto LLD | 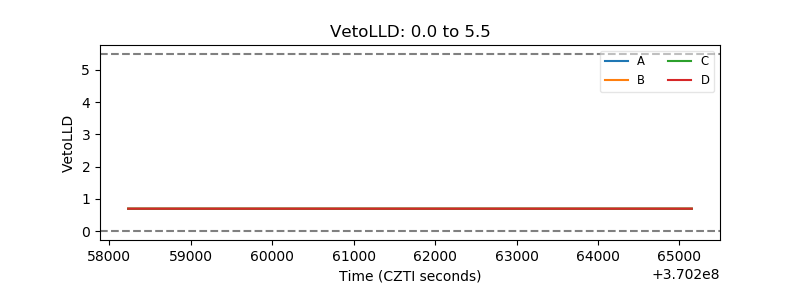 |
| Alpha Counter | 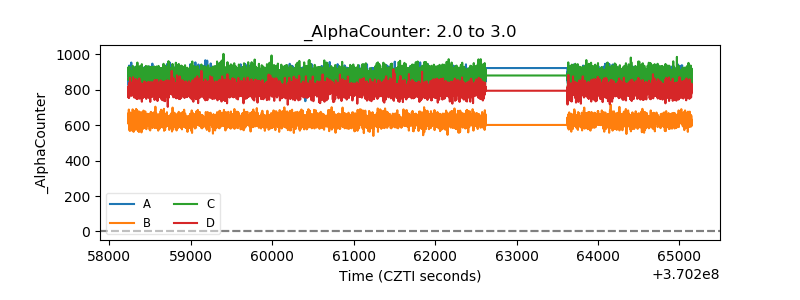 |
| _CPM_Rate | 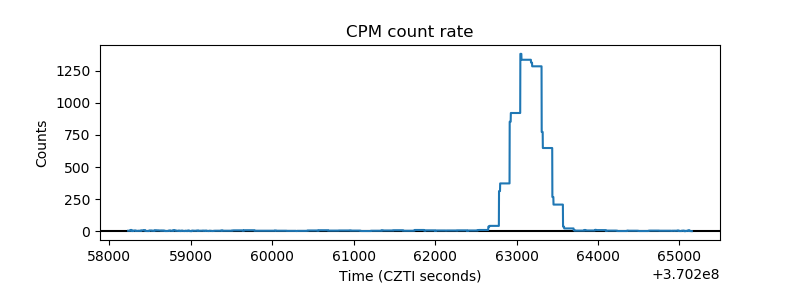 |
| CZT Counter | 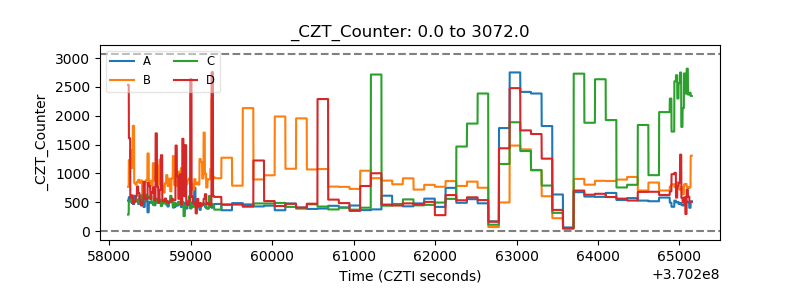 |
| +2.5 Volts monitor | 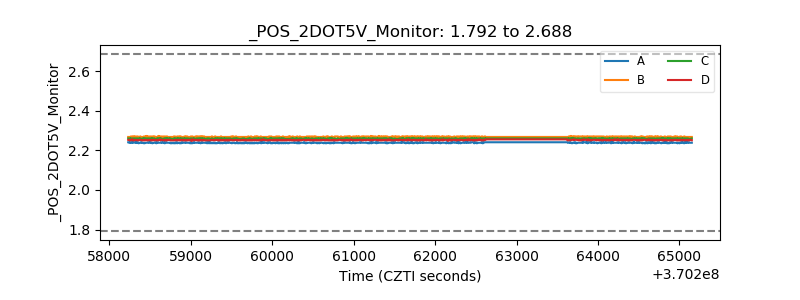 |
| +5 Volts monitor | 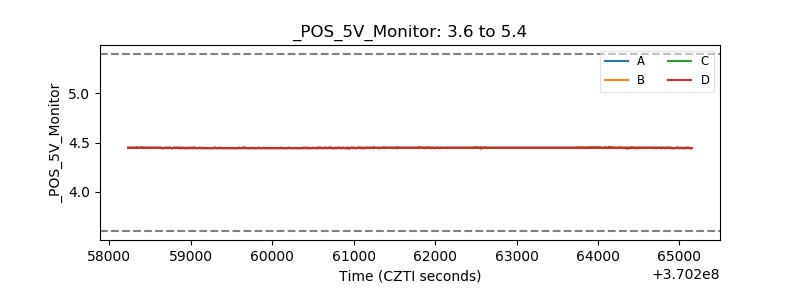 |
| _ROLL_ROT | 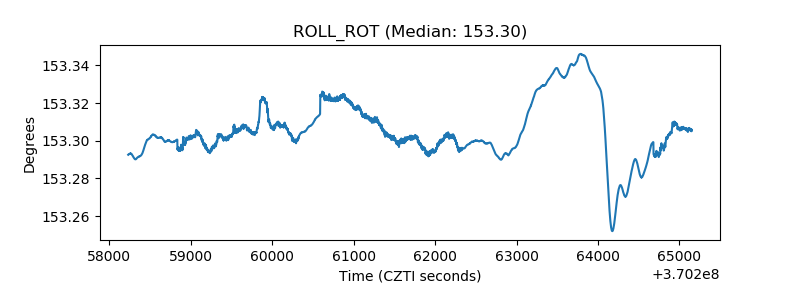 |
| _Roll_DEC | 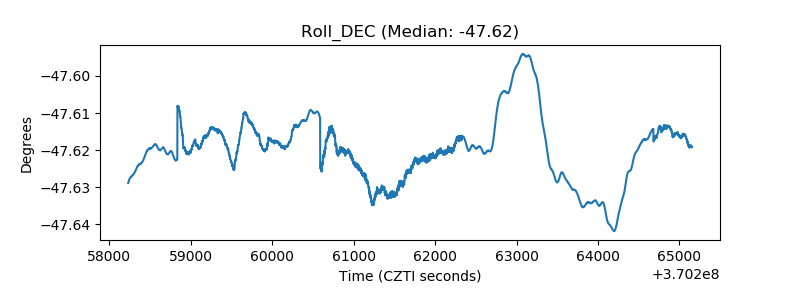 |
| _Roll_RA | 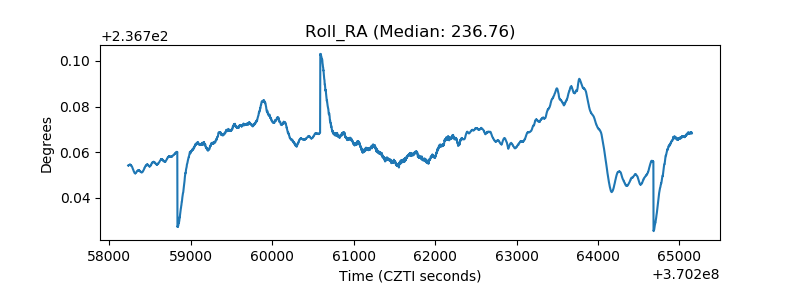 |
| Veto Counter | 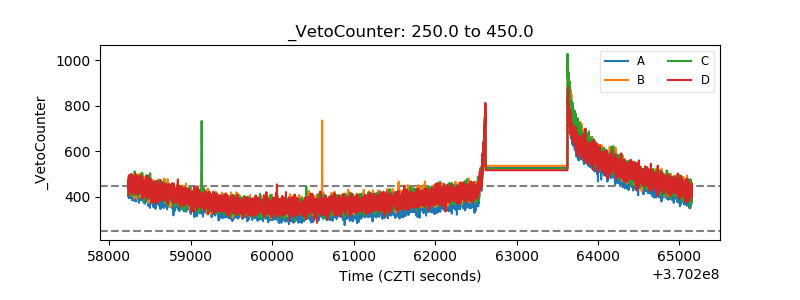 |