| Param | Original file | Final file |
|---|---|---|
| Filename | modeM0/AS1T04_059T01_9000004704_32408cztM0_level2.evt | modeM0/AS1T04_059T01_9000004704_32408cztM0_level2_quad_clean.evt |
| Size (bytes) | 872,236,800 | 74,171,520 |
| Size | 831.8 MB | 70.7 MB |
| Events in quadrant A | 2,879,731 | 568,631 |
| Events in quadrant B | 5,720,347 | 543,699 |
| Events in quadrant C | 13,549,900 | 219,221 |
| Events in quadrant D | 3,885,617 | 518,276 |
| Mode M0 | |||
|---|---|---|---|
| Quadrant | BADHDUFLAG | Total packets | Discarded packets |
| A | 0 | 12158 | 2 |
| B | 0 | 20865 | 1 |
| C | 0 | 44082 | 1 |
| D | 0 | 15165 | 1 |
| Mode M9 | |||
|---|---|---|---|
| Quadrant | BADHDUFLAG | Total packets | Discarded packets |
| A | 0 | 13 | 0 |
| B | 0 | 13 | 0 |
| C | 0 | 13 | 0 |
| D | 0 | 13 | 0 |
| Mode SS | |||
|---|---|---|---|
| Quadrant | BADHDUFLAG | Total packets | Discarded packets |
| A | 0 | 114 | 0 |
| B | 0 | 114 | 0 |
| C | 0 | 114 | 0 |
| D | 0 | 114 | 0 |
| Quadrant | Total seconds | Saturated seconds | Saturation percentage |
|---|---|---|---|
| A | 5646 | 42 | 0.743889% |
| B | 5646 | 321 | 5.685441% |
| C | 5646 | 4923 | 87.194474% |
| D | 5646 | 125 | 2.213957% |
Noise dominated data is calculated using 1-second bins in cleaned event files. If a bin has >2000 counts, and if more than 50% of those come from <1% of pixels, then it is considered to be noise-dominated and hence unusable.
| Quadrant | # 1 sec bins | Bins with >0 counts | Bins with >2000 counts | High rate bins dominated by noise | Noise dominated (total time) | Noise dominated (detector-on time) | Marked lightcurve |
|---|---|---|---|---|---|---|---|
| A | 6906 | 5647 | 4 | 4 | 0.06% | 0.07% | 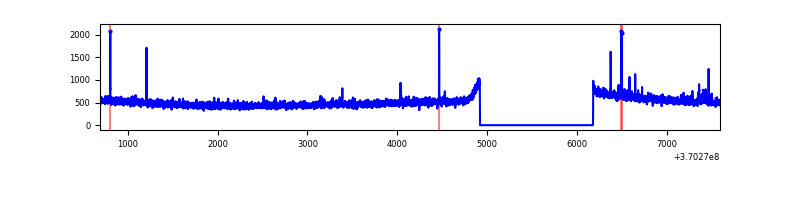 |
| B | 6906 | 5647 | 176 | 176 | 2.55% | 3.12% | 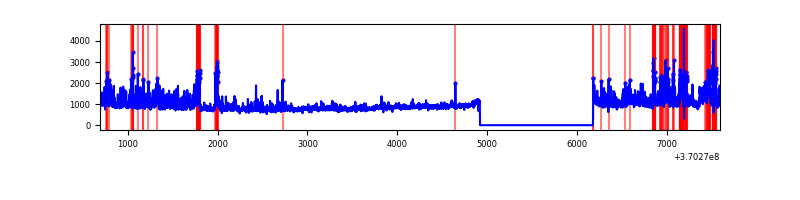 |
| C | 6906 | 5647 | 4270 | 4270 | 61.83% | 75.62% | 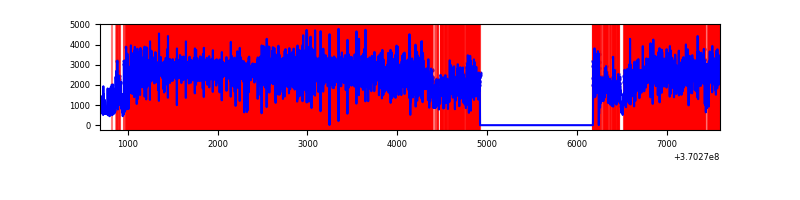 |
| D | 6906 | 5647 | 101 | 101 | 1.46% | 1.79% | 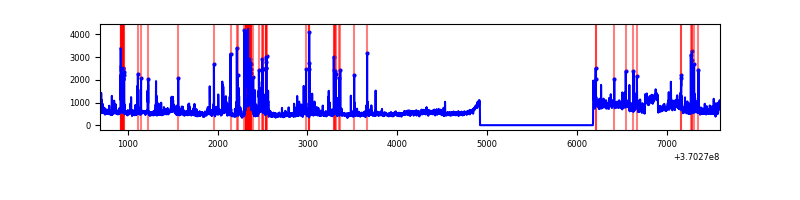 |
Top three noisy pixels from each quadrant. If the there are fewer than three noisy pixels in the level2.evt file, extra rows are filled as -1
| Pixel properties | Quadrant properties | ||||||
|---|---|---|---|---|---|---|---|
| Quadrant | DetID | PixID | Counts | Sigma | Mean | Median | Sigma |
| A | 12 | 96 | 25806 | 170.7 | 733 | 719 | 147.0 |
| A | 13 | 254 | 11410 | 72.74 | 733 | 719 | 147.0 |
| A | 15 | 174 | 9024 | 56.51 | 733 | 719 | 147.0 |
| B | 6 | 159 | 1668373 | 12463.85 | 710 | 693 | 133.8 |
| B | 4 | 80 | 800440 | 5977.12 | 710 | 693 | 133.8 |
| B | 5 | 172 | 361917 | 2699.7 | 710 | 693 | 133.8 |
| C | 3 | 233 | 12150976 | 168492.66 | 310 | 312 | 72.1 |
| C | 0 | 10 | 61275 | 845.37 | 310 | 312 | 72.1 |
| C | 14 | 238 | 56633 | 781.0 | 310 | 312 | 72.1 |
| D | 8 | 195 | 489012 | 2988.51 | 691 | 673 | 163.4 |
| D | 1 | 47 | 378049 | 2309.45 | 691 | 673 | 163.4 |
| D | 12 | 218 | 118388 | 720.39 | 691 | 673 | 163.4 |
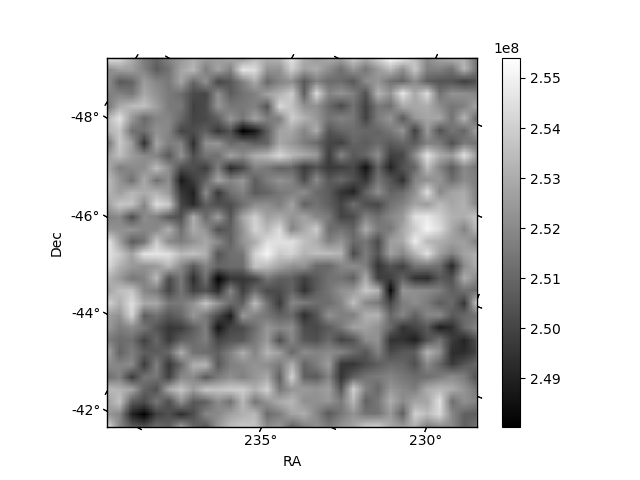
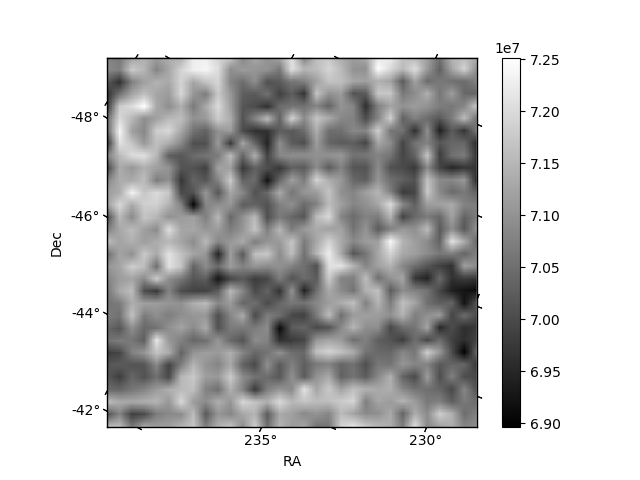
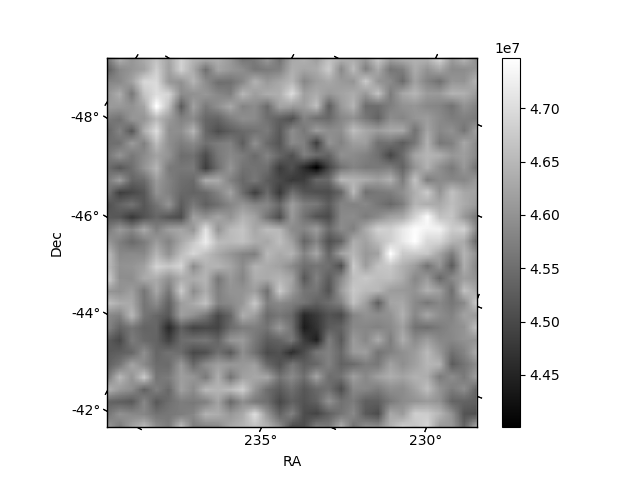
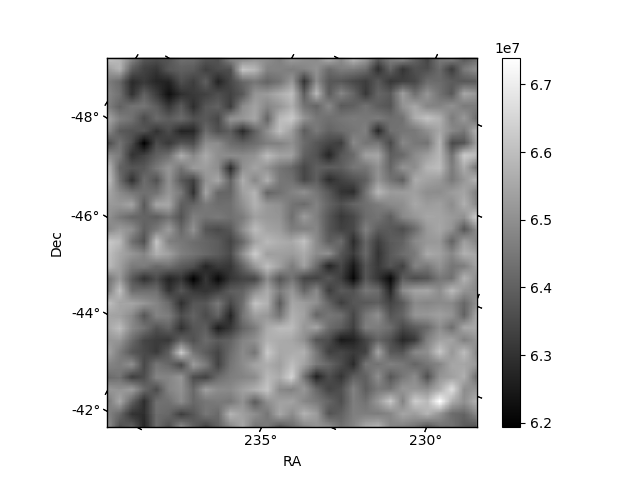
Histogram calculated using DETX and DETY for each event in the final _common_clean file
| Quadrant A | 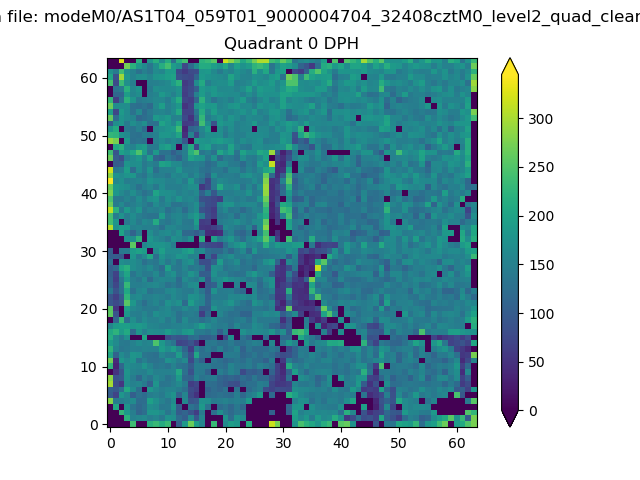 |
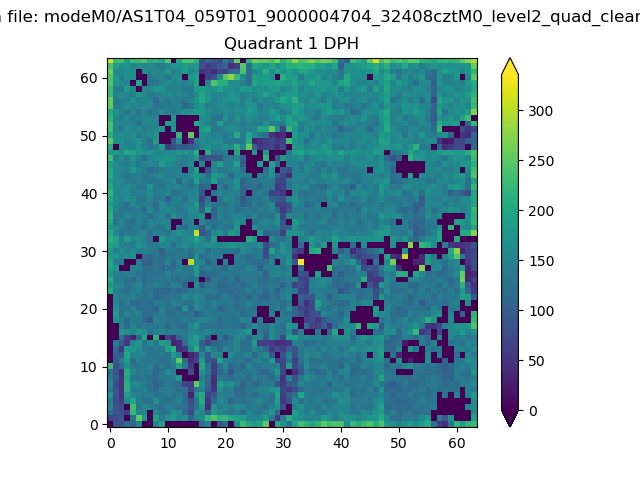 |
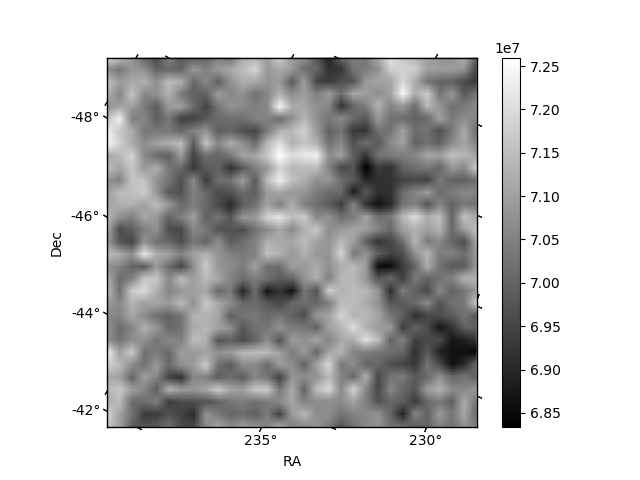
Quadrant B |
|---|---|---|---|
| Quadrant D | 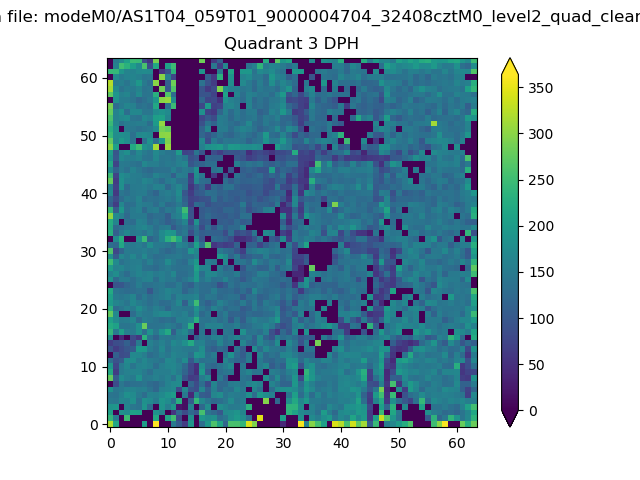 |
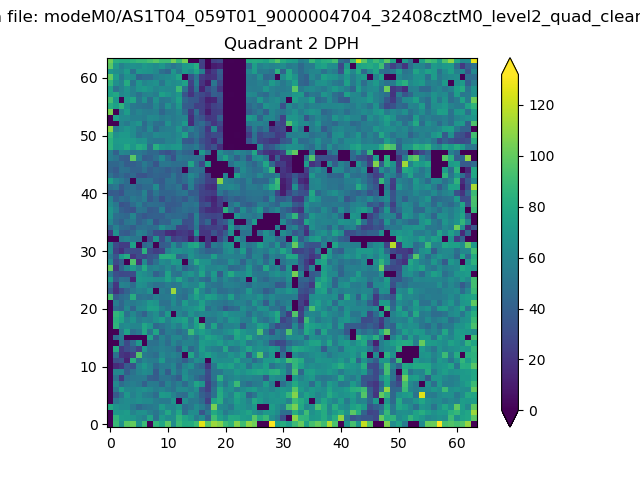 |
Quadrant C |
| Plot type | Count rate plots | Images |
|---|---|---|
| Comparison with Poisson distribution Blue bars denote a histogram of data divided into 1 sec bins. Red curve is a Poisson curve with rate = median count rate of data. |
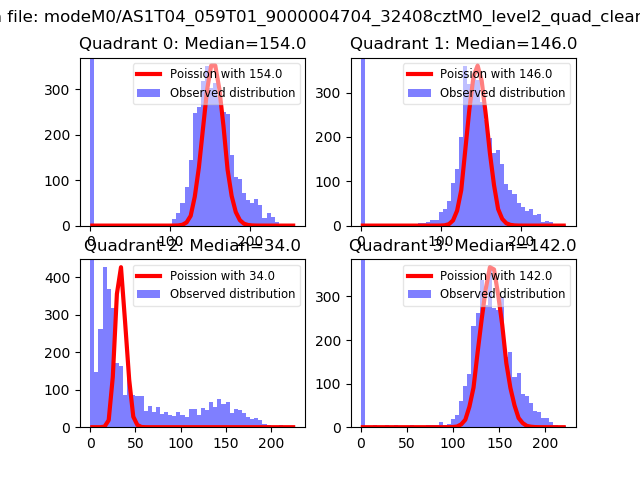 |
 |
| Quadrant-wise count rates Data is divided into 100 sec bins |
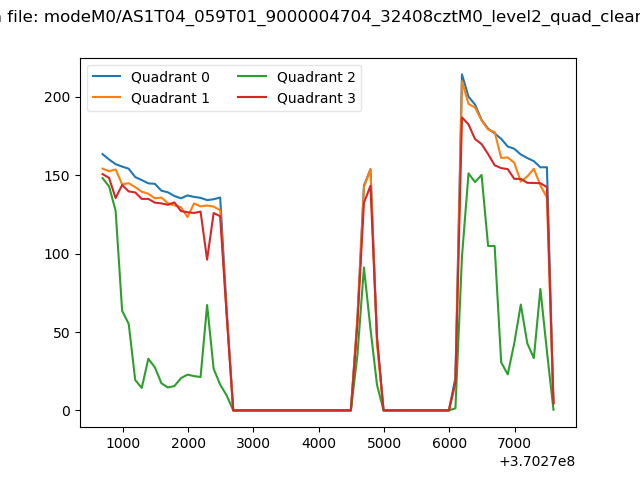 |
|
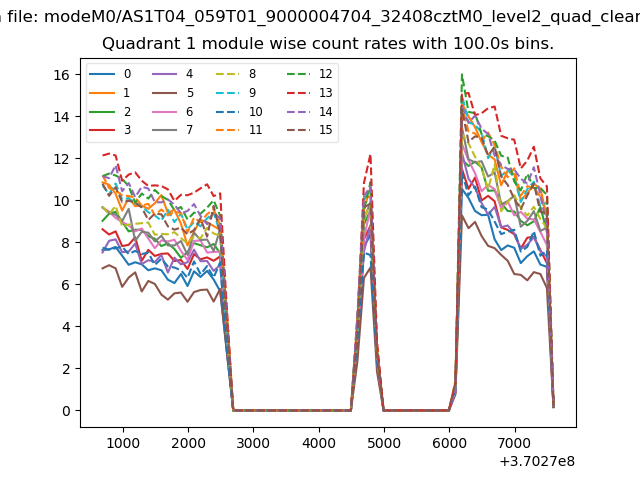
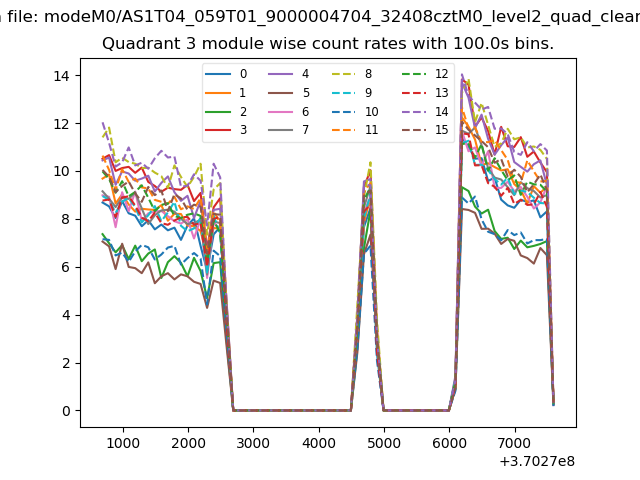
| Module-wise count rates for Quadrant A Data is divided into 100 sec bins |
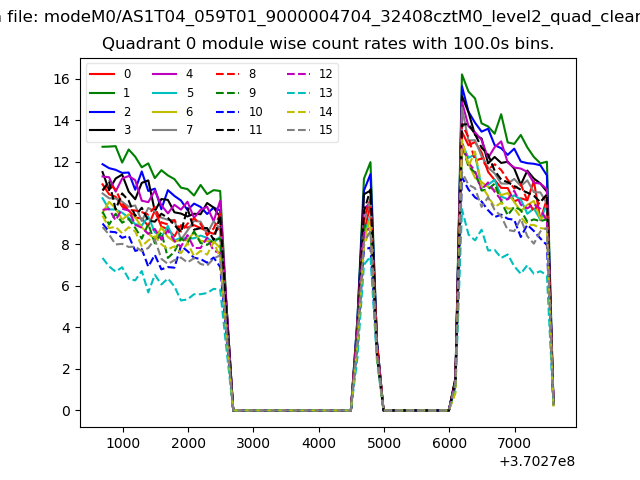 |
 |
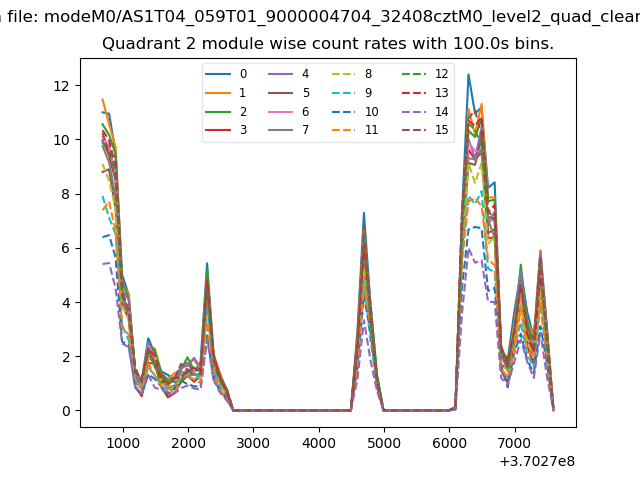
| Module-wise count rates for Quadrant B Data is divided into 100 sec bins |
 |
 |
| Module-wise count rates for Quadrant C Data is divided into 100 sec bins |
 |
 |
| Module-wise count rates for Quadrant D Data is divided into 100 sec bins |
 |
 |
| Parameter | Plot |
|---|---|
| CZT HV Monitor | 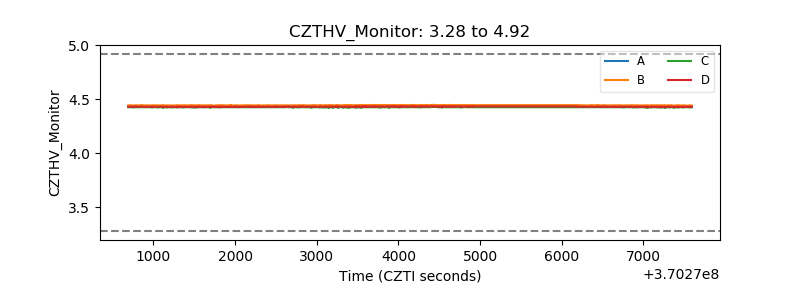 |
| D_VDD | 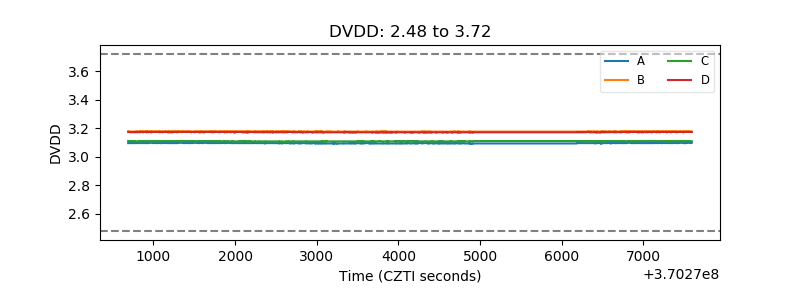 |
| Temperature 1 | 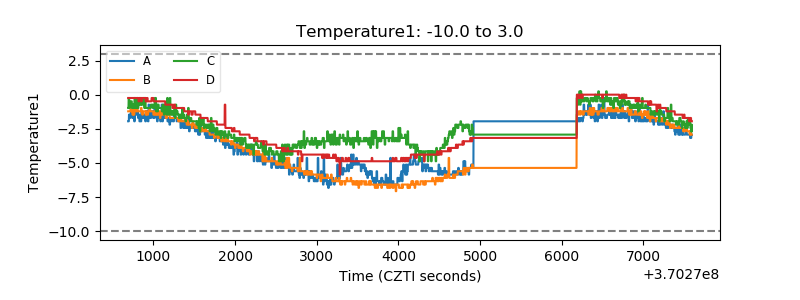 |
| Veto HV Monitor | 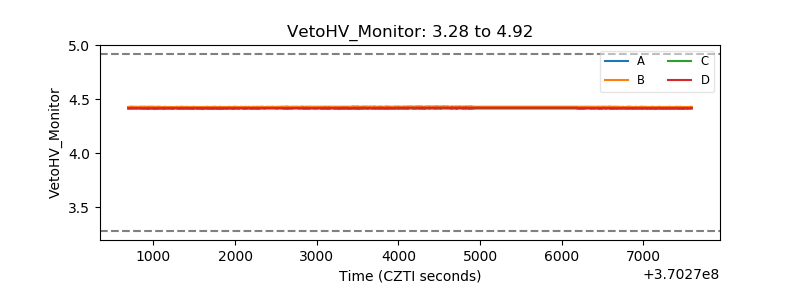 |
| Veto LLD | 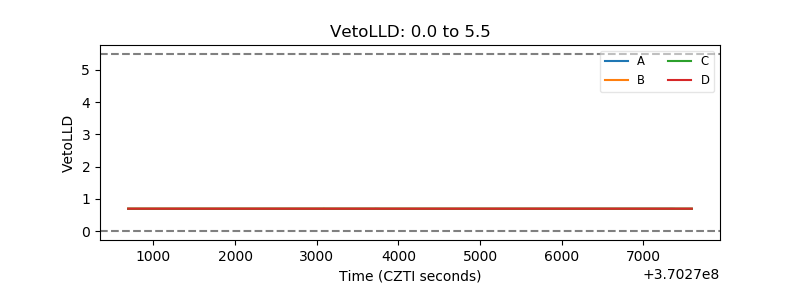 |
| Alpha Counter | 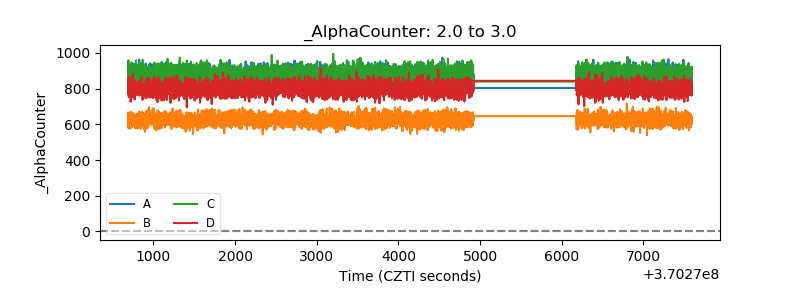 |
| _CPM_Rate | 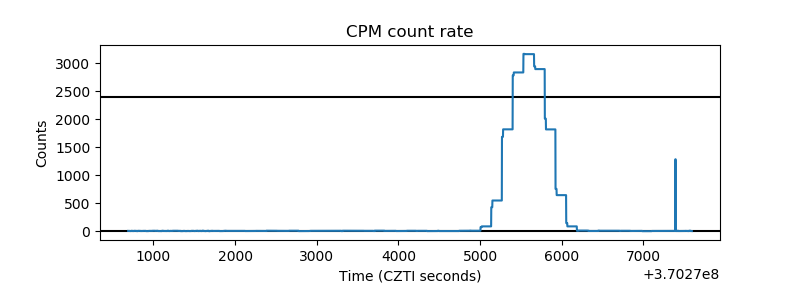 |
| CZT Counter | 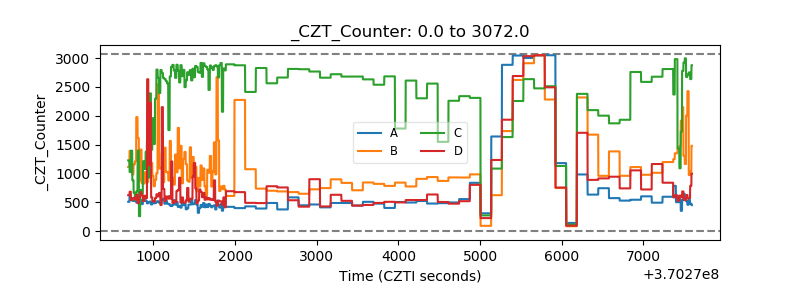 |
| +2.5 Volts monitor |  |
| +5 Volts monitor |  |
| _ROLL_ROT | 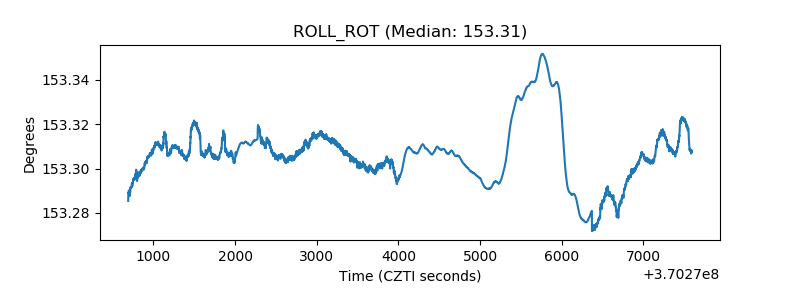 |
| _Roll_DEC | 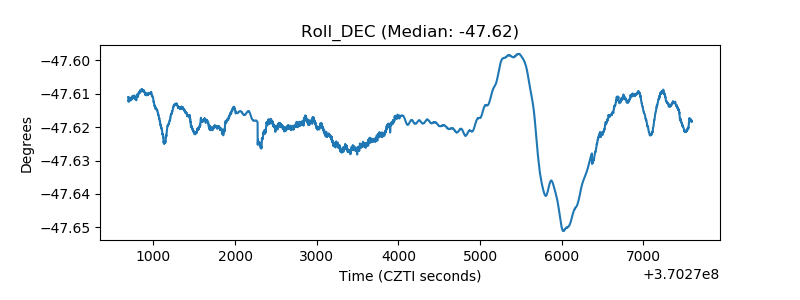 |
| _Roll_RA | 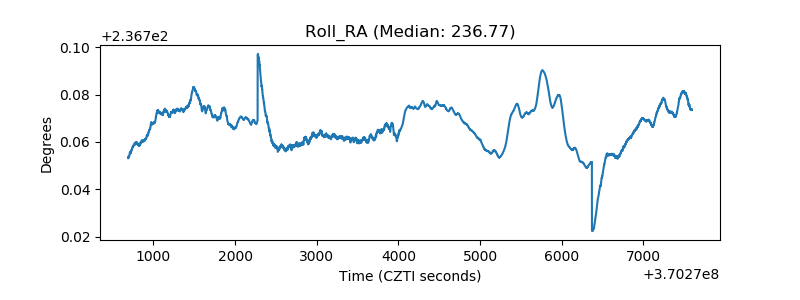 |
| Veto Counter | 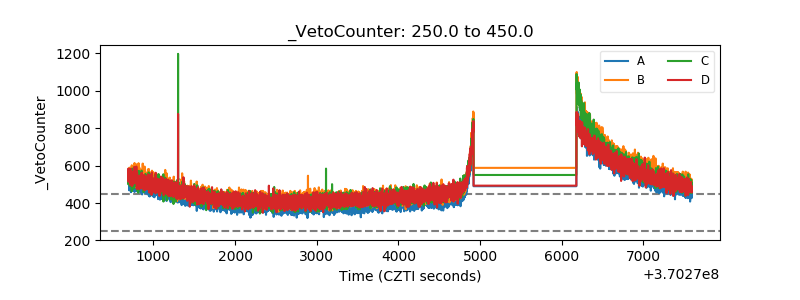 |