| Param | Original file | Final file |
|---|---|---|
| Filename | modeM0/AS1T04_059T01_9000004704_32410cztM0_level2.evt | modeM0/AS1T04_059T01_9000004704_32410cztM0_level2_quad_clean.evt |
| Size (bytes) | 728,167,680 | 78,442,560 |
| Size | 694.4 MB | 74.8 MB |
| Events in quadrant A | 2,940,869 | 597,245 |
| Events in quadrant B | 6,360,067 | 533,766 |
| Events in quadrant C | 7,234,183 | 335,080 |
| Events in quadrant D | 5,128,571 | 504,612 |
| Mode M0 | |||
|---|---|---|---|
| Quadrant | BADHDUFLAG | Total packets | Discarded packets |
| A | 0 | 12232 | 35 |
| B | 0 | 23106 | 110 |
| C | 0 | 25414 | 159 |
| D | 0 | 19342 | 72 |
| Mode M9 | |||
|---|---|---|---|
| Quadrant | BADHDUFLAG | Total packets | Discarded packets |
| A | 0 | 14 | 0 |
| B | 0 | 14 | 0 |
| C | 0 | 14 | 0 |
| D | 0 | 14 | 0 |
| Mode SS | |||
|---|---|---|---|
| Quadrant | BADHDUFLAG | Total packets | Discarded packets |
| A | 0 | 116 | 0 |
| B | 0 | 116 | 0 |
| C | 0 | 116 | 0 |
| D | 0 | 116 | 0 |
| Quadrant | Total seconds | Saturated seconds | Saturation percentage |
|---|---|---|---|
| A | 5781 | 30 | 0.518941% |
| B | 5765 | 806 | 13.980919% |
| C | 5763 | 1899 | 32.951588% |
| D | 5770 | 531 | 9.202773% |
Noise dominated data is calculated using 1-second bins in cleaned event files. If a bin has >2000 counts, and if more than 50% of those come from <1% of pixels, then it is considered to be noise-dominated and hence unusable.
| Quadrant | # 1 sec bins | Bins with >0 counts | Bins with >2000 counts | High rate bins dominated by noise | Noise dominated (total time) | Noise dominated (detector-on time) | Marked lightcurve |
|---|---|---|---|---|---|---|---|
| A | 7152 | 5795 | 0 | 0 | 0.00% | 0.00% |  |
| B | 7152 | 5780 | 576 | 576 | 8.05% | 9.97% | 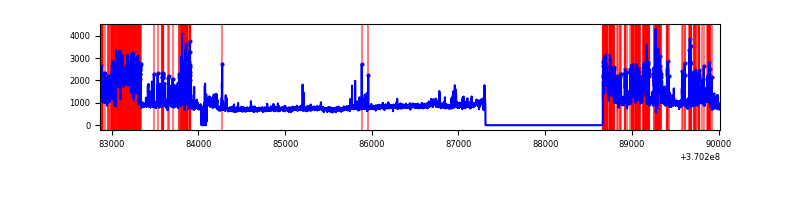 |
| C | 7152 | 5774 | 1573 | 1573 | 21.99% | 27.24% | 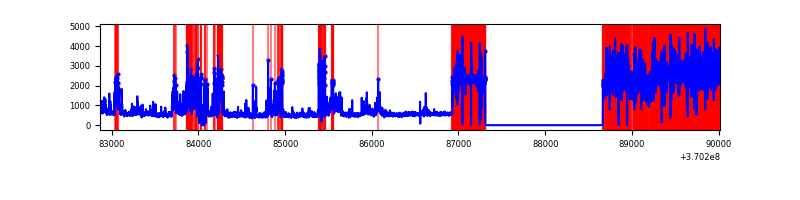 |
| D | 7152 | 5784 | 461 | 461 | 6.45% | 7.97% | 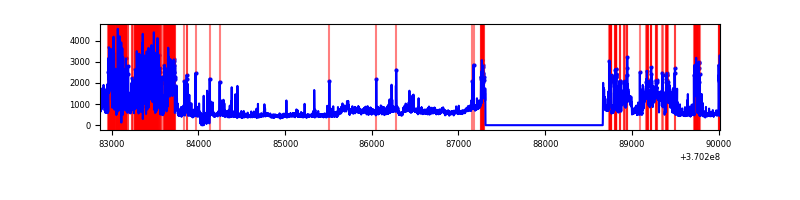 |
Top three noisy pixels from each quadrant. If the there are fewer than three noisy pixels in the level2.evt file, extra rows are filled as -1
| Pixel properties | Quadrant properties | ||||||
|---|---|---|---|---|---|---|---|
| Quadrant | DetID | PixID | Counts | Sigma | Mean | Median | Sigma |
| A | 13 | 254 | 12173 | 75.22 | 758 | 748 | 151.9 |
| A | 3 | 137 | 7121 | 41.96 | 758 | 748 | 151.9 |
| A | 0 | 226 | 6777 | 39.69 | 758 | 748 | 151.9 |
| B | 6 | 159 | 1663672 | 12479.95 | 709 | 694 | 133.3 |
| B | 5 | 172 | 1193708 | 8953.07 | 709 | 694 | 133.3 |
| B | 4 | 80 | 529211 | 3966.3 | 709 | 694 | 133.3 |
| C | 3 | 233 | 4944896 | 40583.48 | 523 | 527 | 121.8 |
| C | 14 | 238 | 103948 | 848.88 | 523 | 527 | 121.8 |
| C | 0 | 10 | 53560 | 435.3 | 523 | 527 | 121.8 |
| D | 1 | 47 | 979306 | 6031.02 | 684 | 666 | 162.3 |
| D | 12 | 218 | 664017 | 4088.0 | 684 | 666 | 162.3 |
| D | 8 | 195 | 469961 | 2892.1 | 684 | 666 | 162.3 |
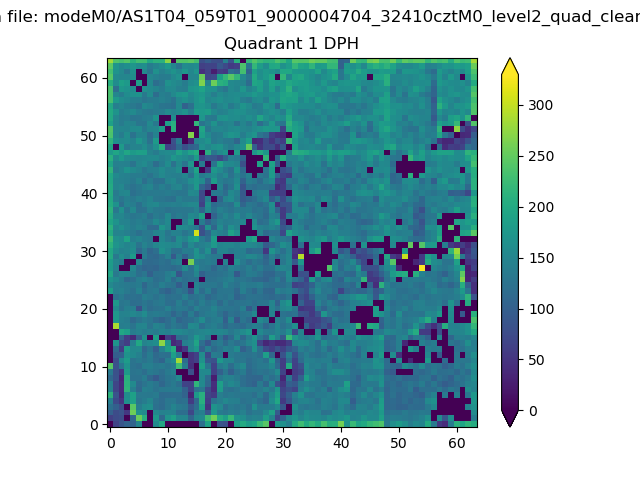
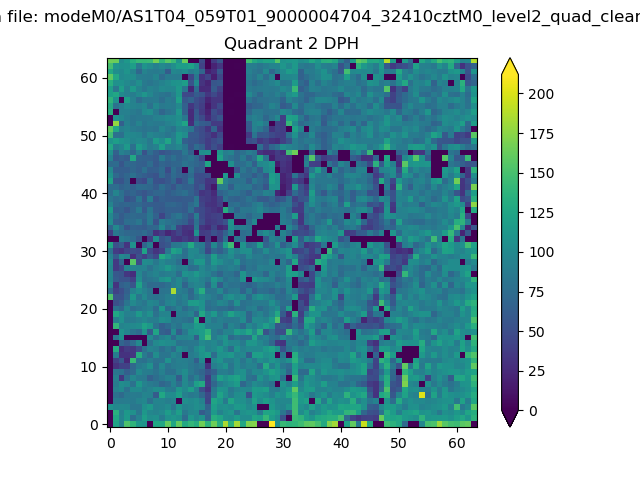
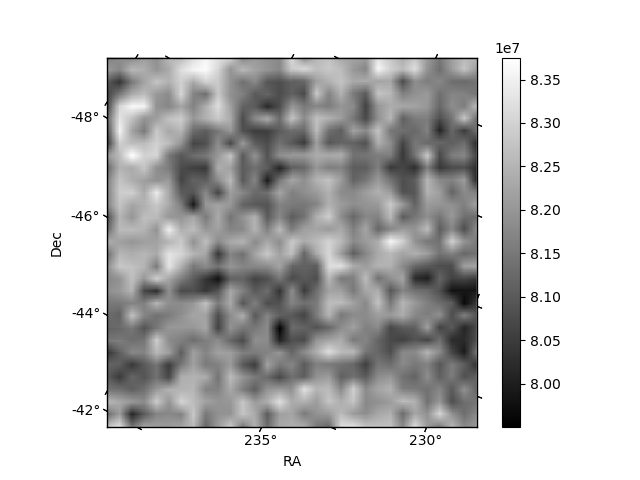
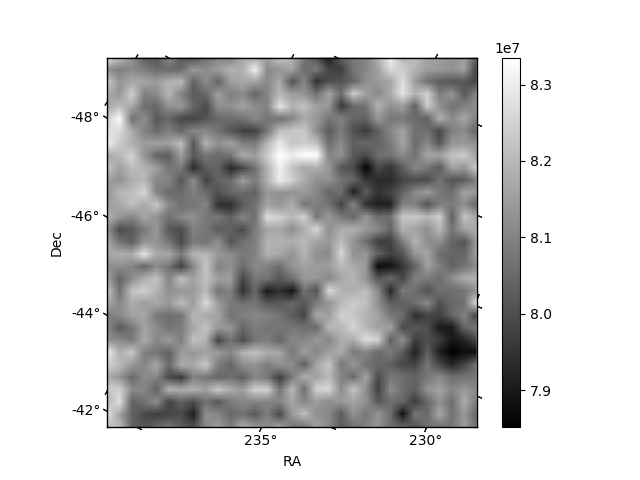
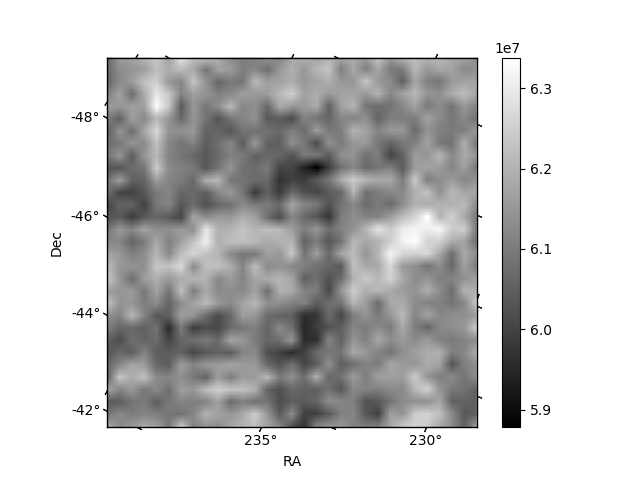
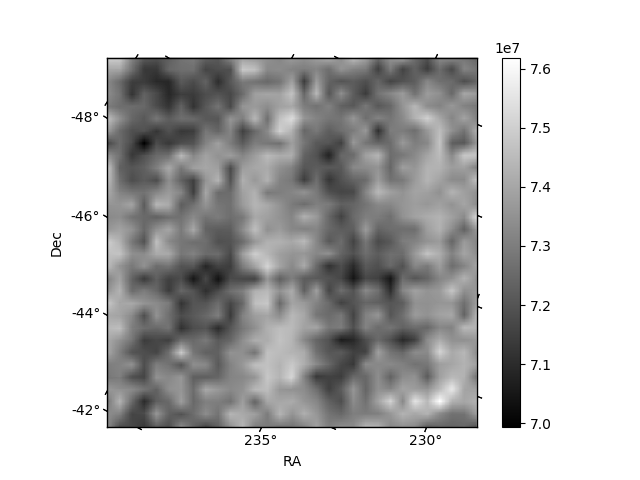
Histogram calculated using DETX and DETY for each event in the final _common_clean file
| Quadrant A | 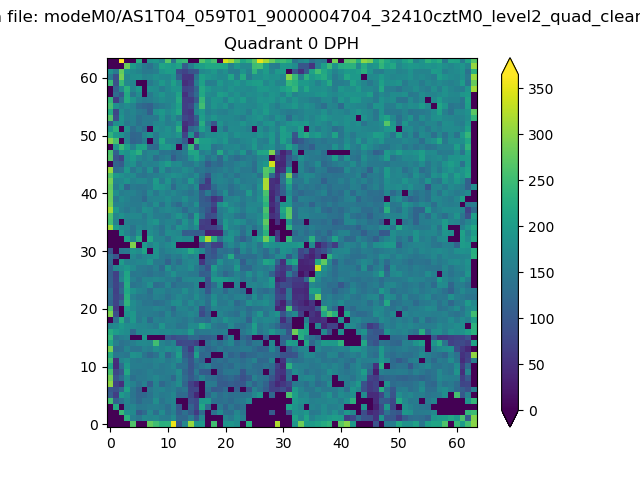 |
 |
Quadrant B |
|---|---|---|---|
| Quadrant D |  |
 |
Quadrant C |
| Plot type | Count rate plots | Images |
|---|---|---|
| Comparison with Poisson distribution Blue bars denote a histogram of data divided into 1 sec bins. Red curve is a Poisson curve with rate = median count rate of data. |
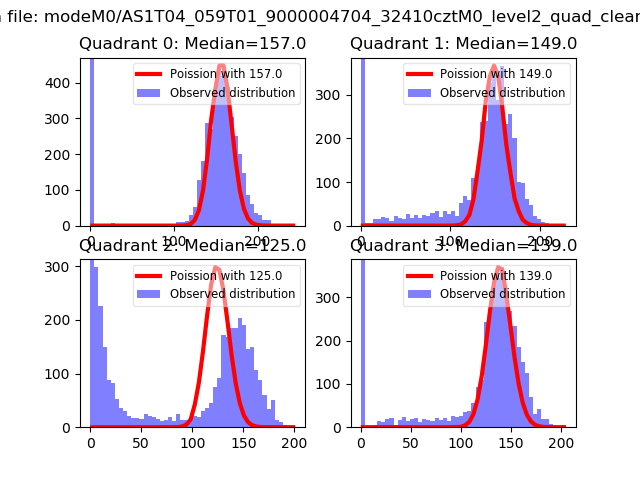 |
 |
| Quadrant-wise count rates Data is divided into 100 sec bins |
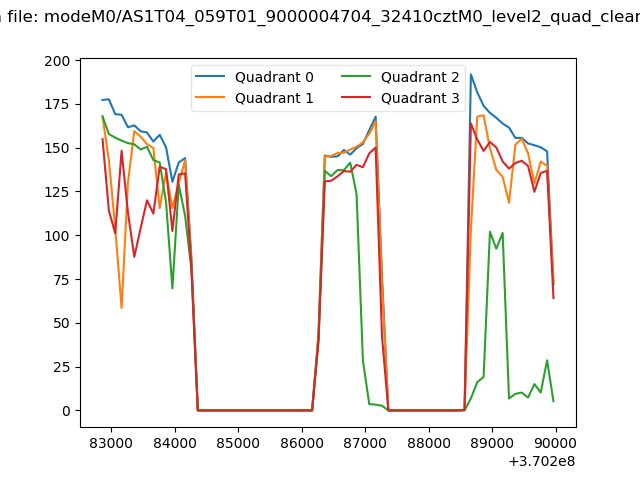 |
|
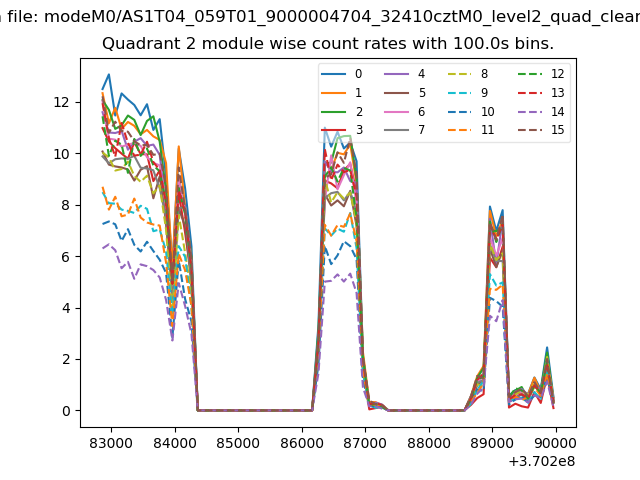
| Module-wise count rates for Quadrant A Data is divided into 100 sec bins |
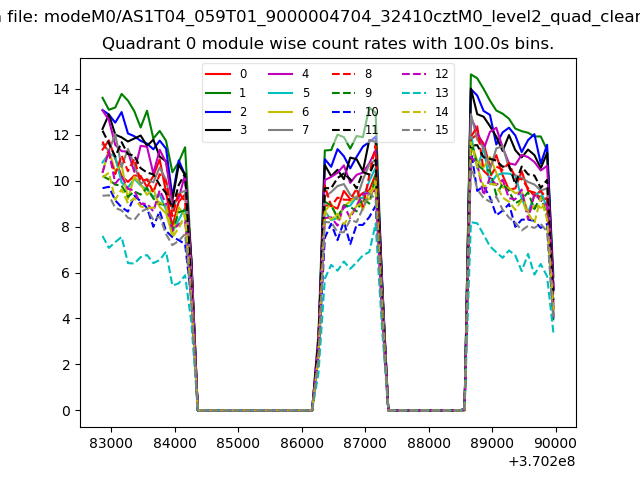 |
 |
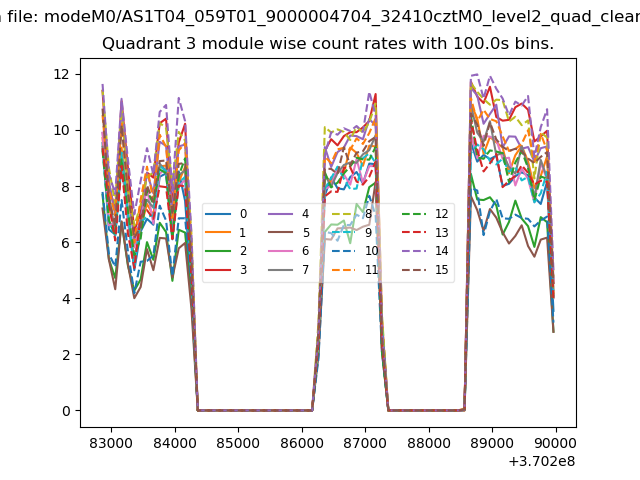
| Module-wise count rates for Quadrant B Data is divided into 100 sec bins |
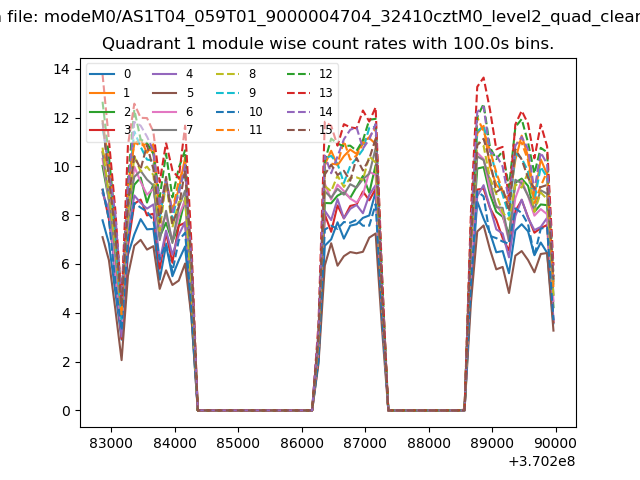 |
 |
| Module-wise count rates for Quadrant C Data is divided into 100 sec bins |
 |
 |
| Module-wise count rates for Quadrant D Data is divided into 100 sec bins |
 |
 |
| Parameter | Plot |
|---|---|
| CZT HV Monitor | 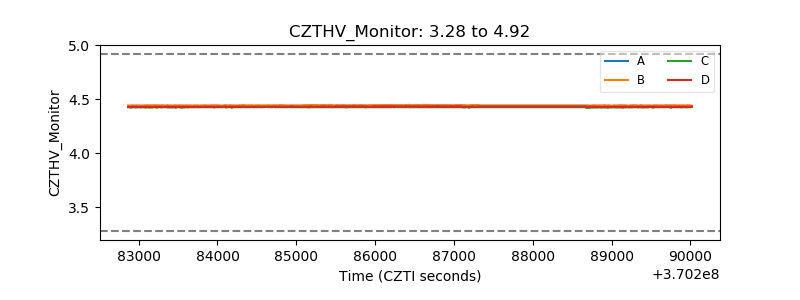 |
| D_VDD | 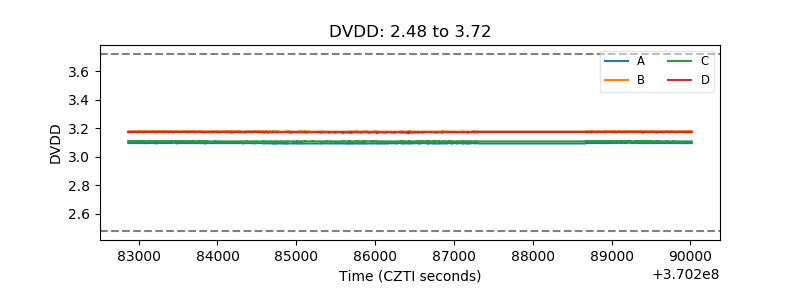 |
| Temperature 1 | 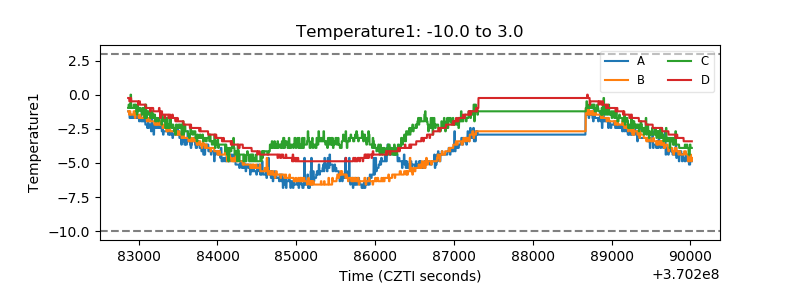 |
| Veto HV Monitor | 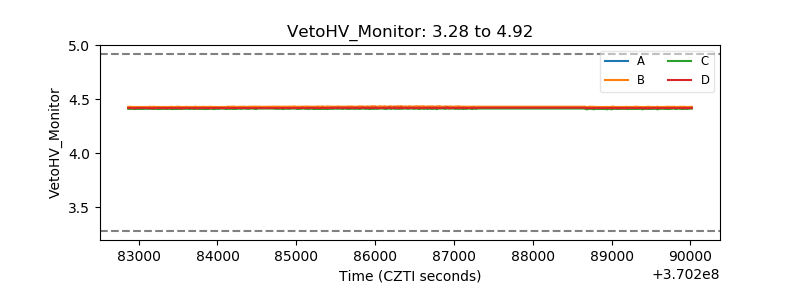 |
| Veto LLD | 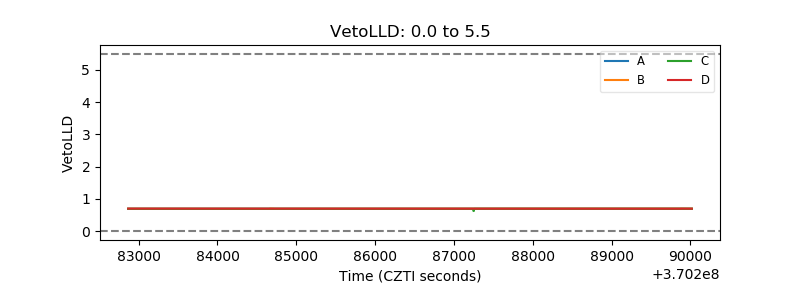 |
| Alpha Counter | 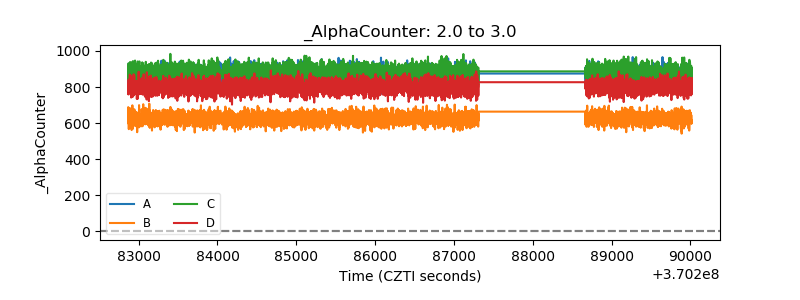 |
| _CPM_Rate | 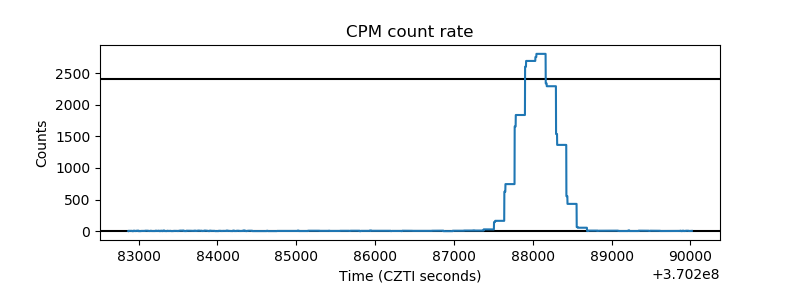 |
| CZT Counter | 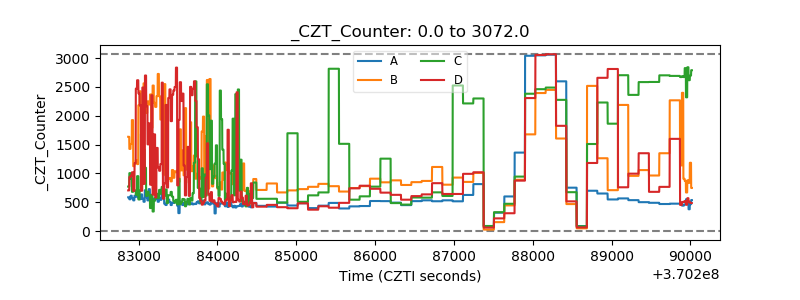 |
| +2.5 Volts monitor |  |
| +5 Volts monitor | 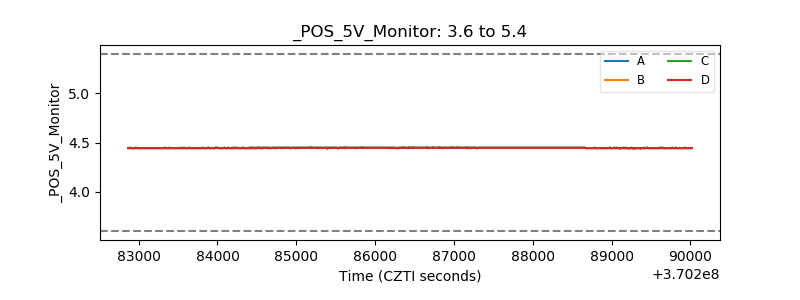 |
| _ROLL_ROT | 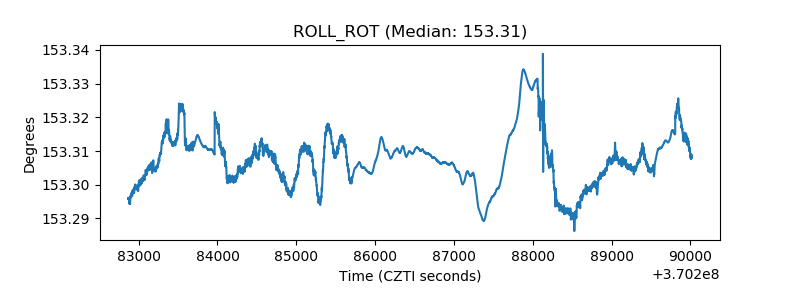 |
| _Roll_DEC | 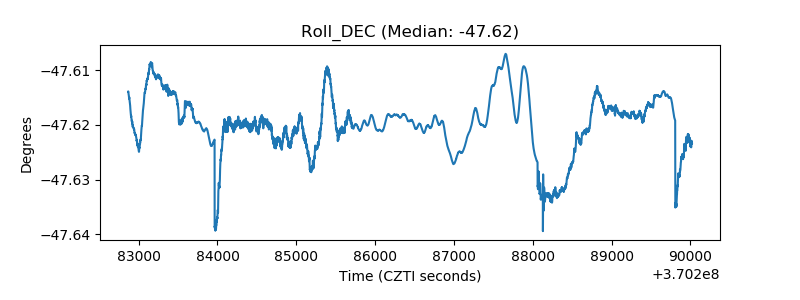 |
| _Roll_RA | 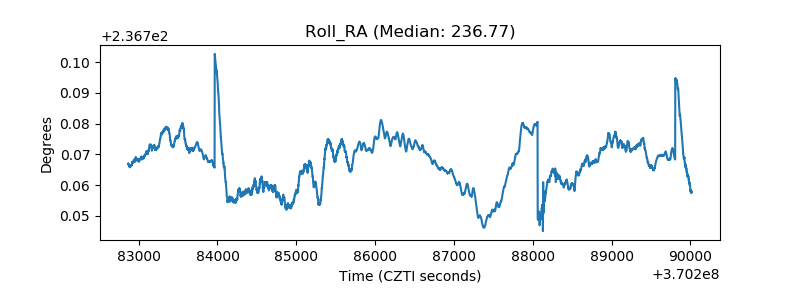 |
| Veto Counter | 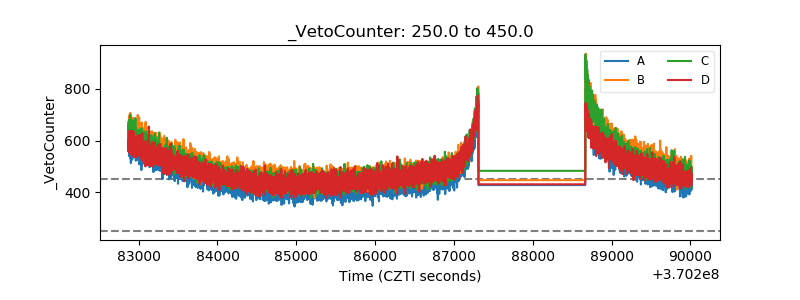 |