| Param | Original file | Final file |
|---|---|---|
| Filename | modeM0/AS1T04_059T01_9000004704_32411cztM0_level2.evt | modeM0/AS1T04_059T01_9000004704_32411cztM0_level2_quad_clean.evt |
| Size (bytes) | 1,020,804,480 | 74,632,320 |
| Size | 973.5 MB | 71.2 MB |
| Events in quadrant A | 3,140,002 | 610,842 |
| Events in quadrant B | 6,996,620 | 571,079 |
| Events in quadrant C | 15,572,435 | 95,464 |
| Events in quadrant D | 4,790,073 | 548,466 |
| Mode M0 | |||
|---|---|---|---|
| Quadrant | BADHDUFLAG | Total packets | Discarded packets |
| A | 0 | 13092 | 3 |
| B | 0 | 25038 | 2 |
| C | 0 | 50572 | 2 |
| D | 0 | 18338 | 2 |
| Mode M9 | |||
|---|---|---|---|
| Quadrant | BADHDUFLAG | Total packets | Discarded packets |
| A | 0 | 13 | 0 |
| B | 0 | 13 | 0 |
| C | 0 | 13 | 0 |
| D | 0 | 13 | 0 |
| Mode SS | |||
|---|---|---|---|
| Quadrant | BADHDUFLAG | Total packets | Discarded packets |
| A | 0 | 126 | 0 |
| B | 0 | 126 | 0 |
| C | 0 | 126 | 0 |
| D | 0 | 126 | 0 |
| Quadrant | Total seconds | Saturated seconds | Saturation percentage |
|---|---|---|---|
| A | 6186 | 34 | 0.549628% |
| B | 6186 | 717 | 11.590689% |
| C | 6186 | 5872 | 94.924022% |
| D | 6186 | 208 | 3.362431% |
Noise dominated data is calculated using 1-second bins in cleaned event files. If a bin has >2000 counts, and if more than 50% of those come from <1% of pixels, then it is considered to be noise-dominated and hence unusable.
| Quadrant | # 1 sec bins | Bins with >0 counts | Bins with >2000 counts | High rate bins dominated by noise | Noise dominated (total time) | Noise dominated (detector-on time) | Marked lightcurve |
|---|---|---|---|---|---|---|---|
| A | 7466 | 6188 | 6 | 6 | 0.08% | 0.10% | 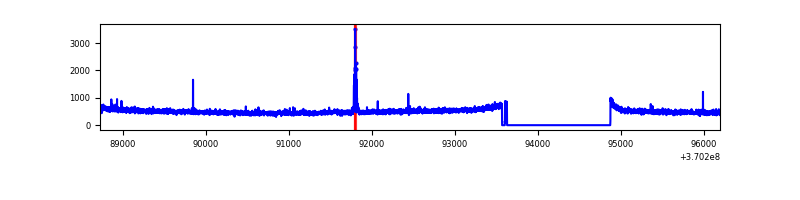 |
| B | 7466 | 6188 | 418 | 418 | 5.60% | 6.76% | 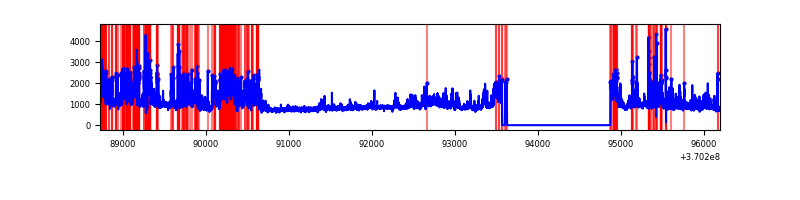 |
| C | 7466 | 6186 | 5195 | 5195 | 69.58% | 83.98% | 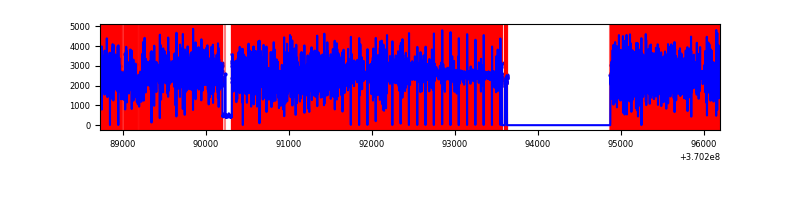 |
| D | 7466 | 6188 | 205 | 205 | 2.75% | 3.31% | 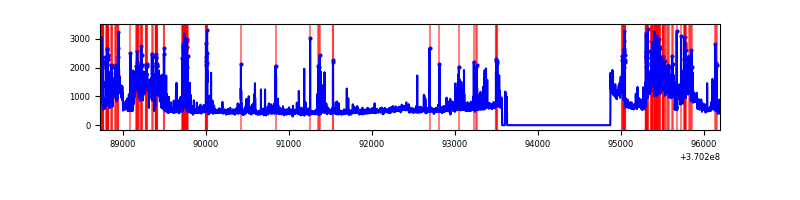 |
Top three noisy pixels from each quadrant. If the there are fewer than three noisy pixels in the level2.evt file, extra rows are filled as -1
| Pixel properties | Quadrant properties | ||||||
|---|---|---|---|---|---|---|---|
| Quadrant | DetID | PixID | Counts | Sigma | Mean | Median | Sigma |
| A | 15 | 174 | 53099 | 329.49 | 797 | 784 | 158.8 |
| A | 13 | 254 | 12500 | 73.79 | 797 | 784 | 158.8 |
| A | 13 | 6 | 10535 | 61.41 | 797 | 784 | 158.8 |
| B | 6 | 159 | 1827433 | 12894.46 | 761 | 745 | 141.7 |
| B | 4 | 80 | 1437338 | 10140.81 | 761 | 745 | 141.7 |
| B | 5 | 172 | 609698 | 4298.56 | 761 | 745 | 141.7 |
| C | 3 | 233 | 14660677 | 303298.47 | 204 | 206 | 48.3 |
| C | 0 | 10 | 42167 | 868.1 | 204 | 206 | 48.3 |
| C | 14 | 238 | 31172 | 640.63 | 204 | 206 | 48.3 |
| D | 8 | 195 | 779976 | 4410.19 | 745 | 726 | 176.7 |
| D | 12 | 218 | 589681 | 3333.21 | 745 | 726 | 176.7 |
| D | 12 | 233 | 180290 | 1016.25 | 745 | 726 | 176.7 |
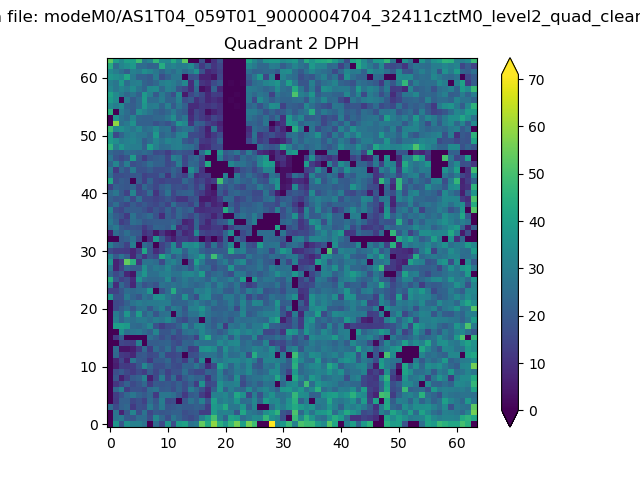
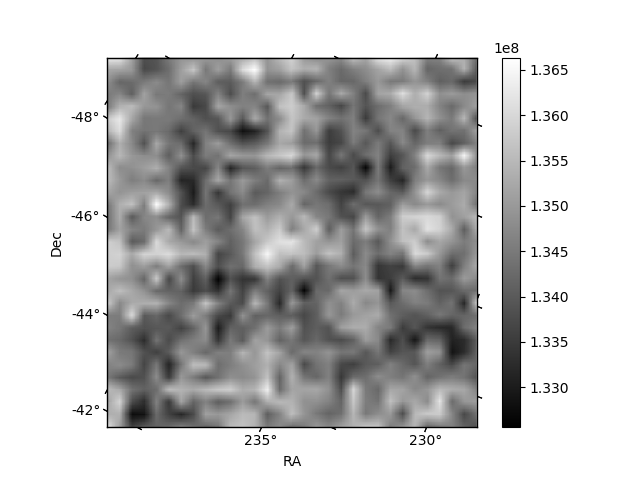
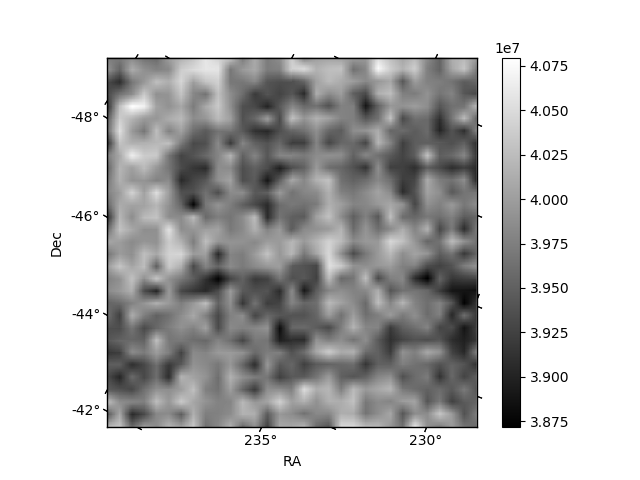
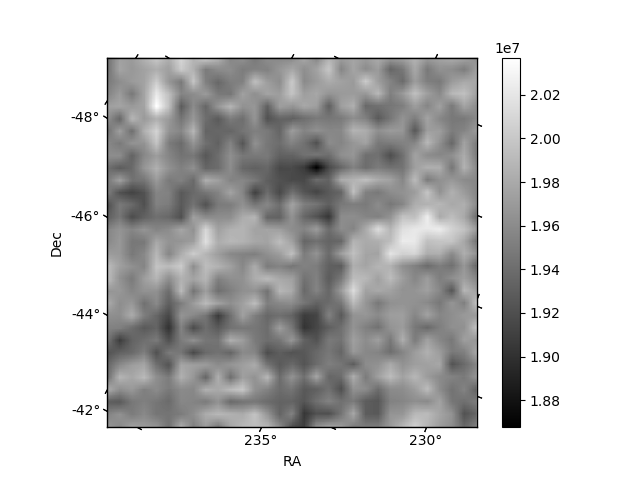
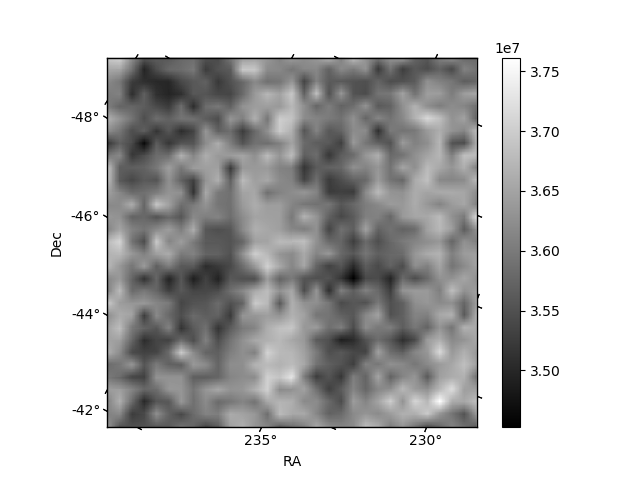
Histogram calculated using DETX and DETY for each event in the final _common_clean file
| Quadrant A | 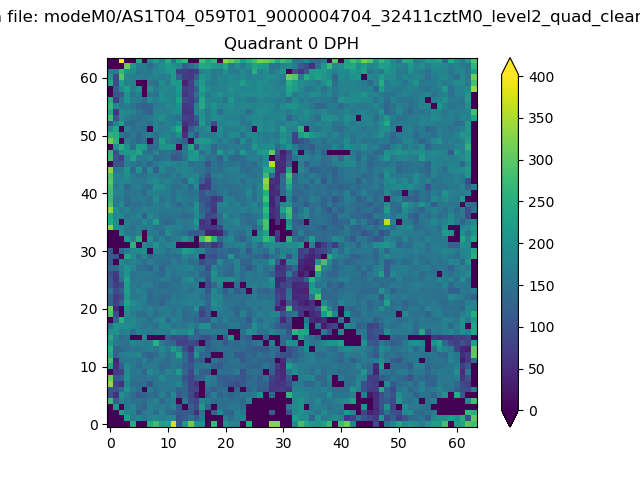 |
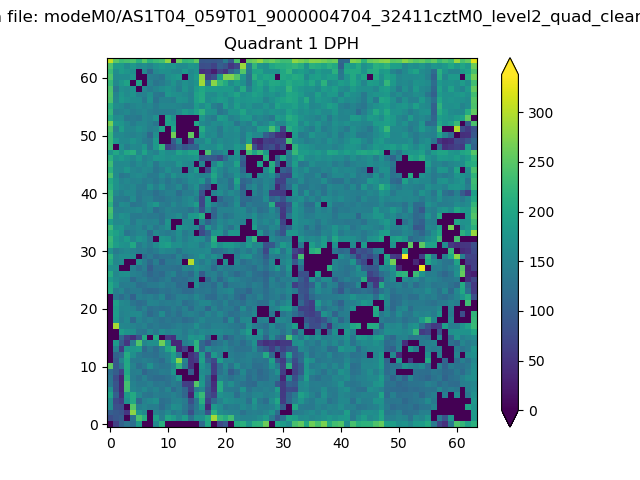 |
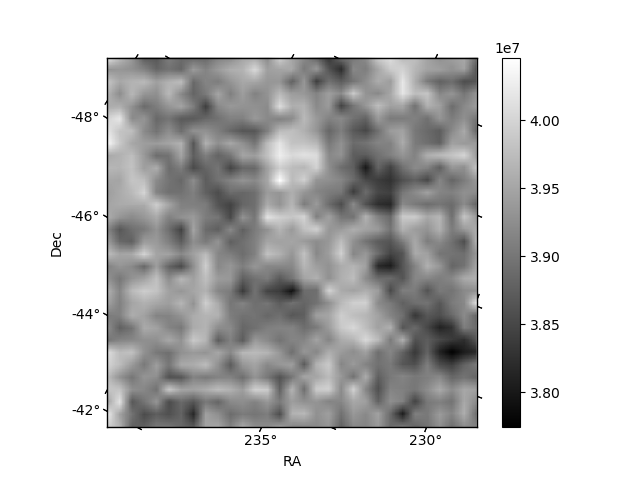
Quadrant B |
|---|---|---|---|
| Quadrant D | 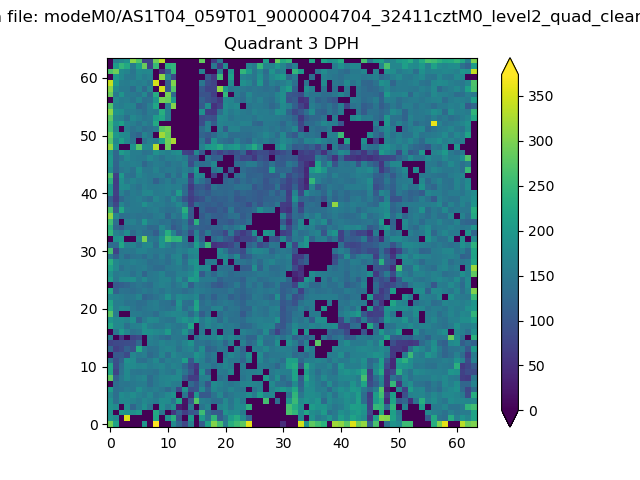 |
 |
Quadrant C |
| Plot type | Count rate plots | Images |
|---|---|---|
| Comparison with Poisson distribution Blue bars denote a histogram of data divided into 1 sec bins. Red curve is a Poisson curve with rate = median count rate of data. |
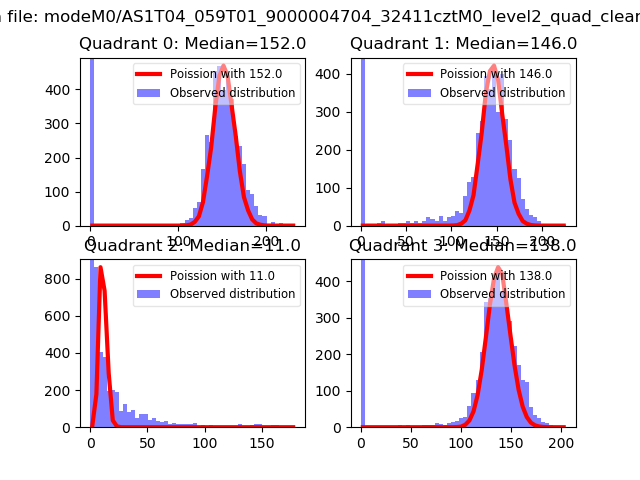 |
 |
| Quadrant-wise count rates Data is divided into 100 sec bins |
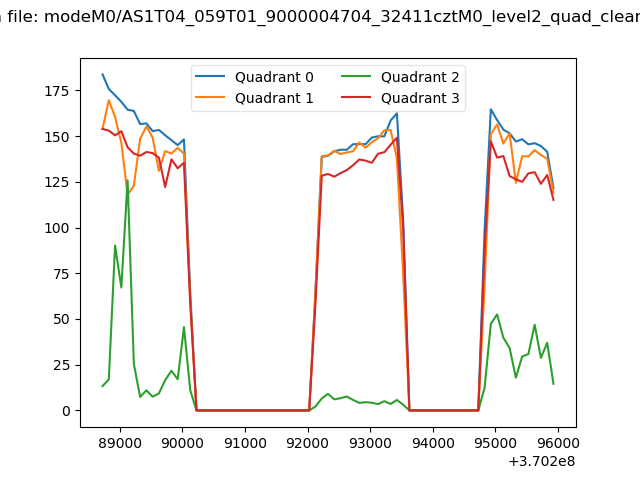 |
|
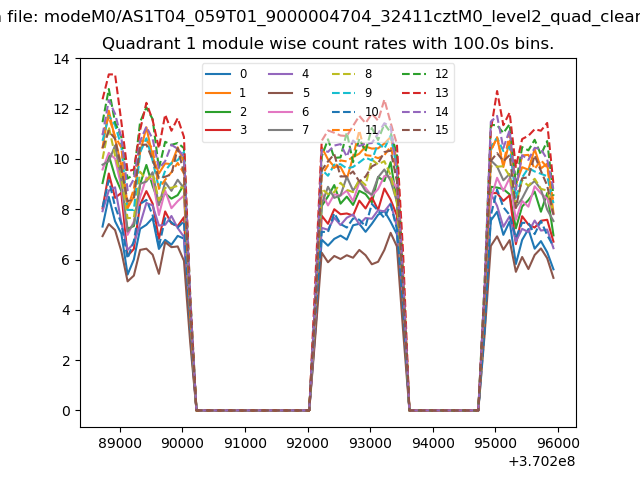
| Module-wise count rates for Quadrant A Data is divided into 100 sec bins |
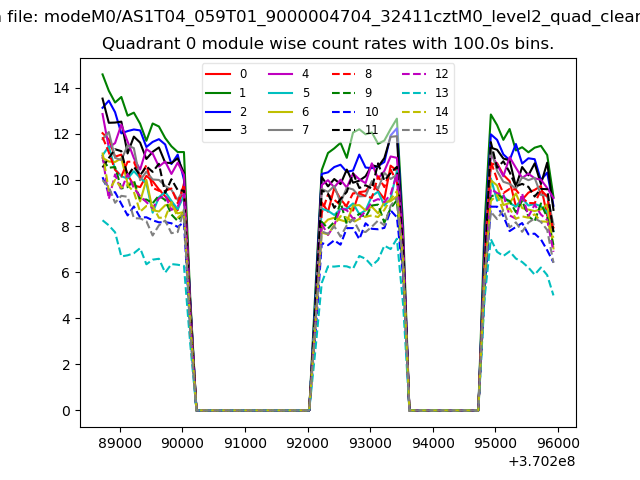 |
 |
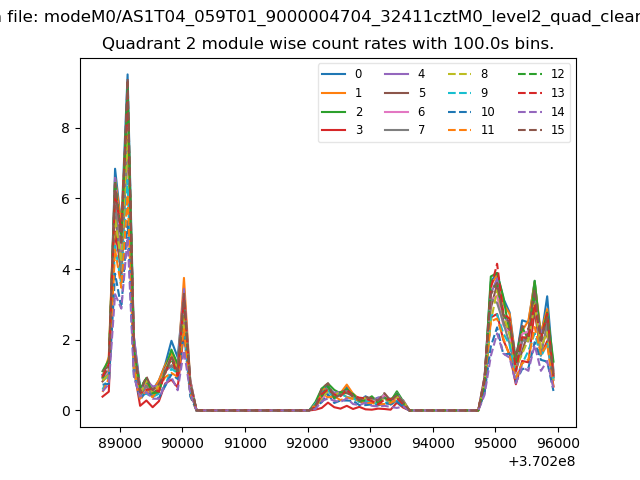
| Module-wise count rates for Quadrant B Data is divided into 100 sec bins |
 |
 |
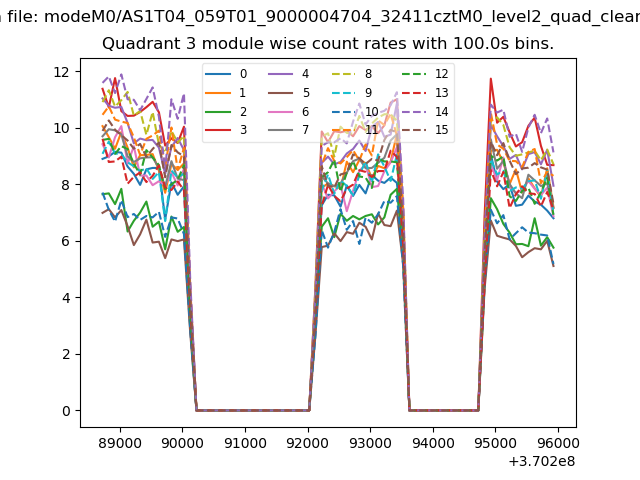
| Module-wise count rates for Quadrant C Data is divided into 100 sec bins |
 |
 |
| Module-wise count rates for Quadrant D Data is divided into 100 sec bins |
 |
 |
| Parameter | Plot |
|---|---|
| CZT HV Monitor | 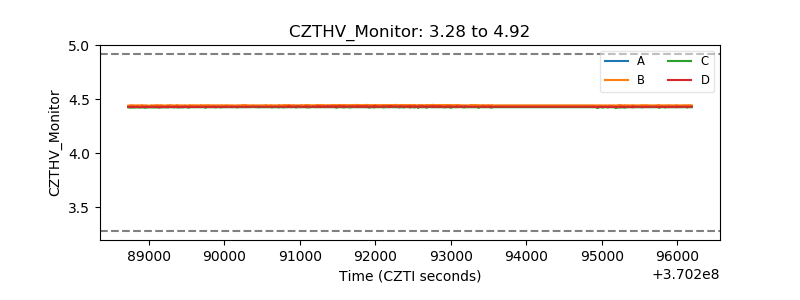 |
| D_VDD | 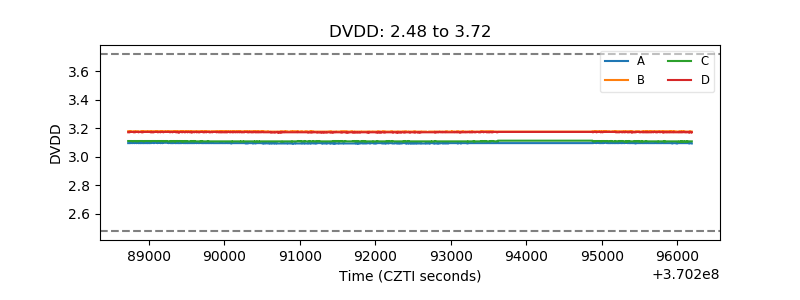 |
| Temperature 1 | 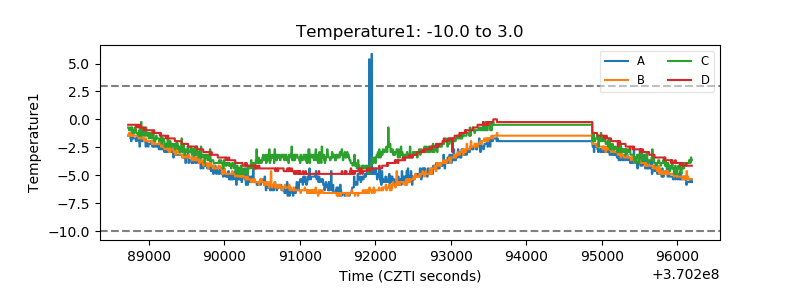 |
| Veto HV Monitor | 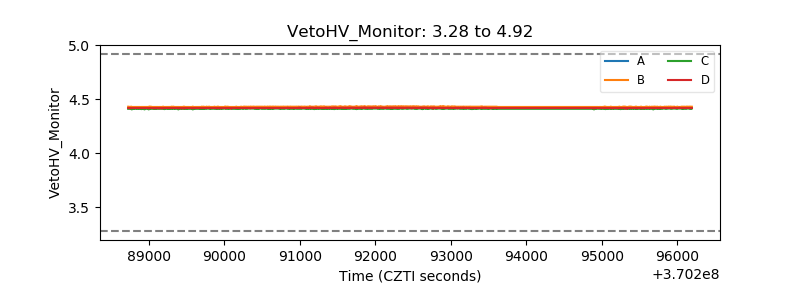 |
| Veto LLD | 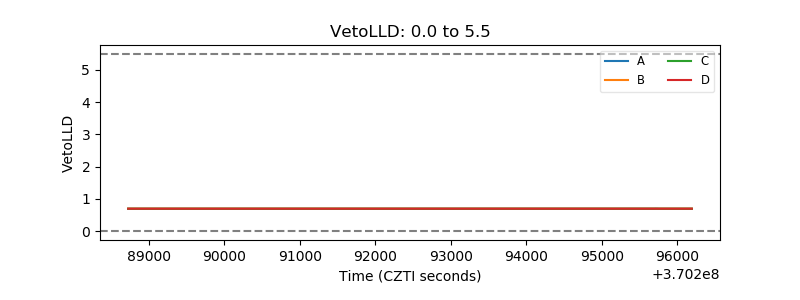 |
| Alpha Counter | 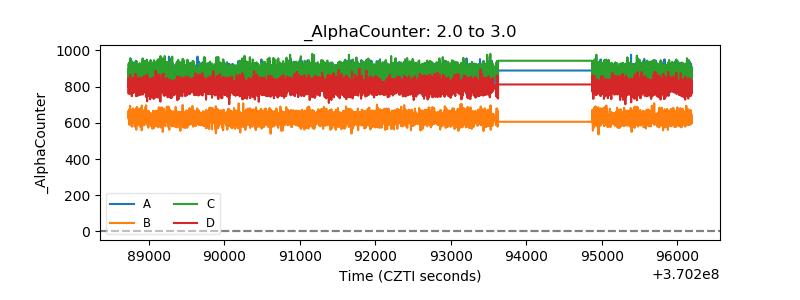 |
| _CPM_Rate | 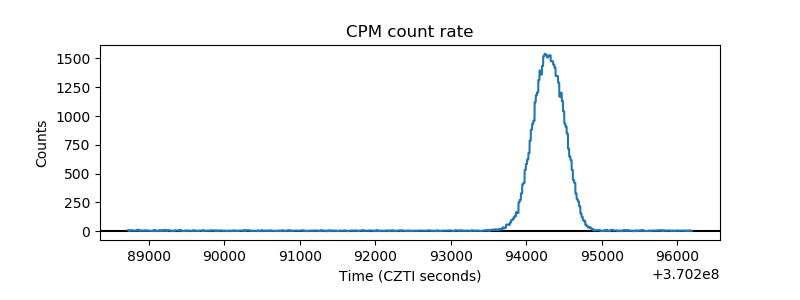 |
| CZT Counter | 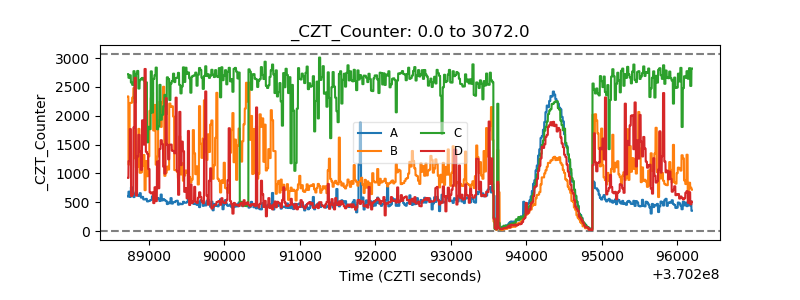 |
| +2.5 Volts monitor | 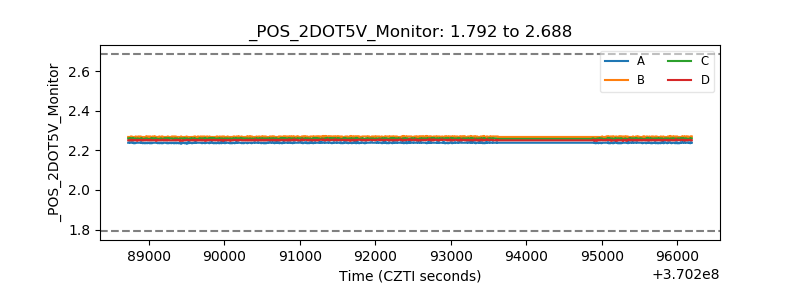 |
| +5 Volts monitor | 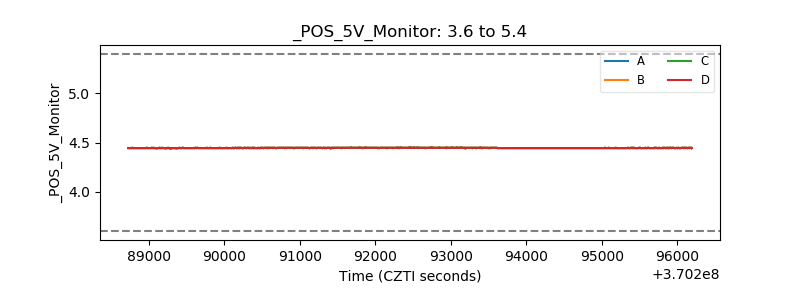 |
| _ROLL_ROT | 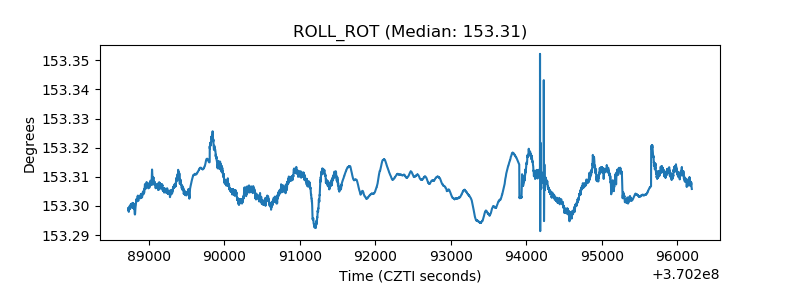 |
| _Roll_DEC | 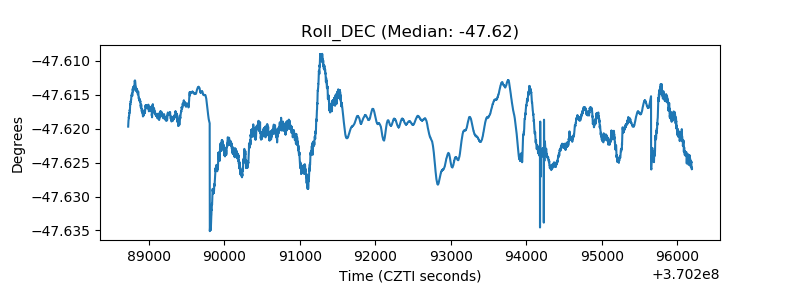 |
| _Roll_RA | 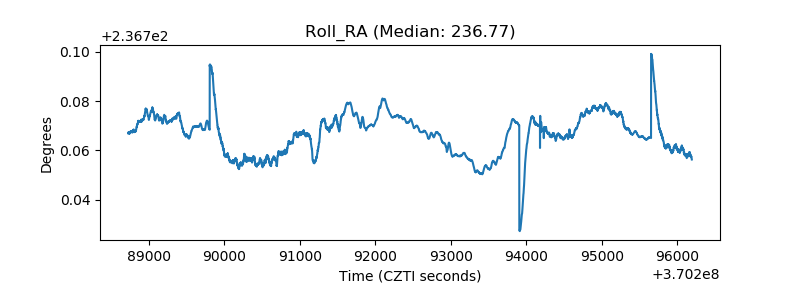 |
| Veto Counter | 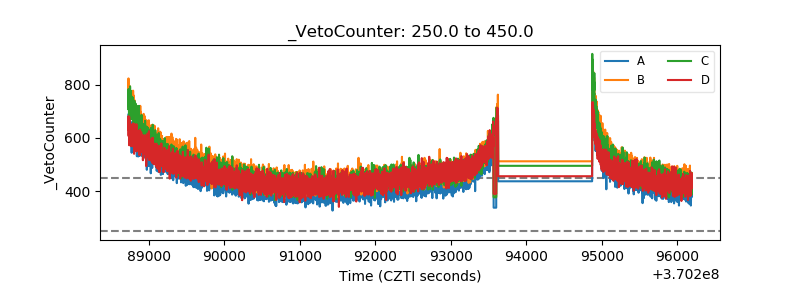 |