| Param | Original file | Final file |
|---|---|---|
| Filename | modeM0/AS1T04_059T01_9000004704_32412cztM0_level2.evt | modeM0/AS1T04_059T01_9000004704_32412cztM0_level2_quad_clean.evt |
| Size (bytes) | 907,427,520 | 63,630,720 |
| Size | 865.4 MB | 60.7 MB |
| Events in quadrant A | 2,935,062 | 492,577 |
| Events in quadrant B | 5,769,068 | 472,261 |
| Events in quadrant C | 14,129,372 | 80,930 |
| Events in quadrant D | 4,236,508 | 452,458 |
| Mode M0 | |||
|---|---|---|---|
| Quadrant | BADHDUFLAG | Total packets | Discarded packets |
| A | 0 | 12566 | 2 |
| B | 0 | 21380 | 1 |
| C | 0 | 46119 | 1 |
| D | 0 | 16651 | 1 |
| Mode M9 | |||
|---|---|---|---|
| Quadrant | BADHDUFLAG | Total packets | Discarded packets |
| A | 0 | 10 | 0 |
| B | 0 | 10 | 0 |
| C | 0 | 10 | 0 |
| D | 0 | 10 | 0 |
| Mode SS | |||
|---|---|---|---|
| Quadrant | BADHDUFLAG | Total packets | Discarded packets |
| A | 0 | 124 | 0 |
| B | 0 | 124 | 0 |
| C | 0 | 124 | 0 |
| D | 0 | 124 | 0 |
| Quadrant | Total seconds | Saturated seconds | Saturation percentage |
|---|---|---|---|
| A | 6107 | 38 | 0.622237% |
| B | 6107 | 408 | 6.680858% |
| C | 6107 | 5174 | 84.722450% |
| D | 6107 | 212 | 3.471426% |
Noise dominated data is calculated using 1-second bins in cleaned event files. If a bin has >2000 counts, and if more than 50% of those come from <1% of pixels, then it is considered to be noise-dominated and hence unusable.
| Quadrant | # 1 sec bins | Bins with >0 counts | Bins with >2000 counts | High rate bins dominated by noise | Noise dominated (total time) | Noise dominated (detector-on time) | Marked lightcurve |
|---|---|---|---|---|---|---|---|
| A | 7092 | 6108 | 0 | 0 | 0.00% | 0.00% | 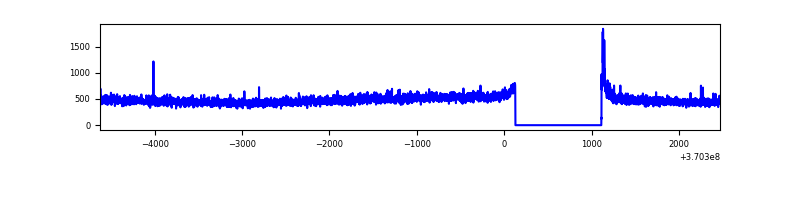 |
| B | 7092 | 6108 | 147 | 147 | 2.07% | 2.41% | 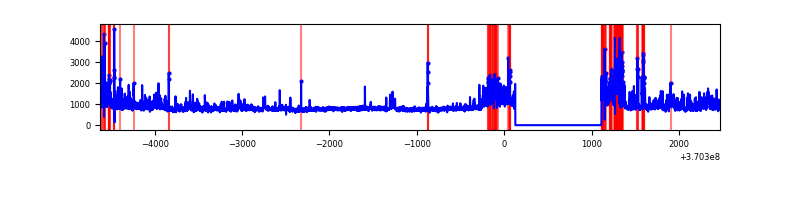 |
| C | 7092 | 6105 | 4434 | 4434 | 62.52% | 72.63% | 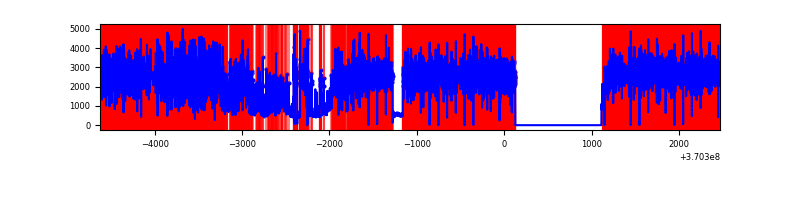 |
| D | 7092 | 6108 | 196 | 196 | 2.76% | 3.21% |  |
Top three noisy pixels from each quadrant. If the there are fewer than three noisy pixels in the level2.evt file, extra rows are filled as -1
| Pixel properties | Quadrant properties | ||||||
|---|---|---|---|---|---|---|---|
| Quadrant | DetID | PixID | Counts | Sigma | Mean | Median | Sigma |
| A | 0 | 6 | 17583 | 111.04 | 752 | 737 | 151.7 |
| A | 13 | 254 | 12437 | 77.12 | 752 | 737 | 151.7 |
| A | 13 | 6 | 11343 | 69.91 | 752 | 737 | 151.7 |
| B | 6 | 159 | 1690067 | 12218.26 | 729 | 710 | 138.3 |
| B | 4 | 80 | 733352 | 5298.83 | 729 | 710 | 138.3 |
| B | 5 | 172 | 333330 | 2405.67 | 729 | 710 | 138.3 |
| C | 3 | 233 | 13051152 | 222090.44 | 245 | 247 | 58.8 |
| C | 14 | 238 | 49702 | 841.59 | 245 | 247 | 58.8 |
| C | 0 | 10 | 28692 | 484.06 | 245 | 247 | 58.8 |
| D | 8 | 195 | 540700 | 3188.08 | 711 | 691 | 169.4 |
| D | 12 | 218 | 437057 | 2576.2 | 711 | 691 | 169.4 |
| D | 12 | 233 | 163445 | 960.86 | 711 | 691 | 169.4 |
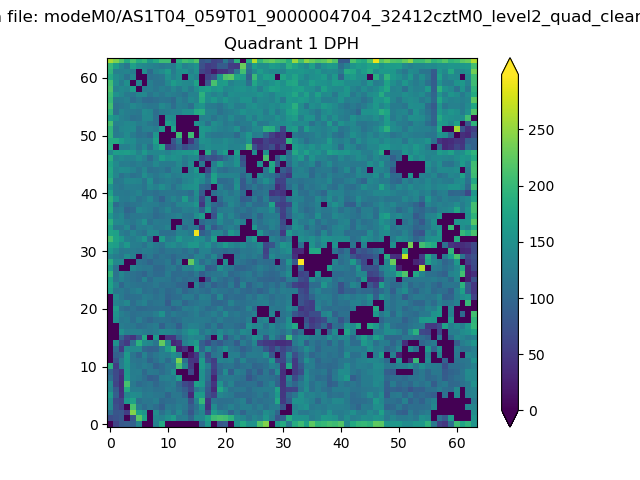
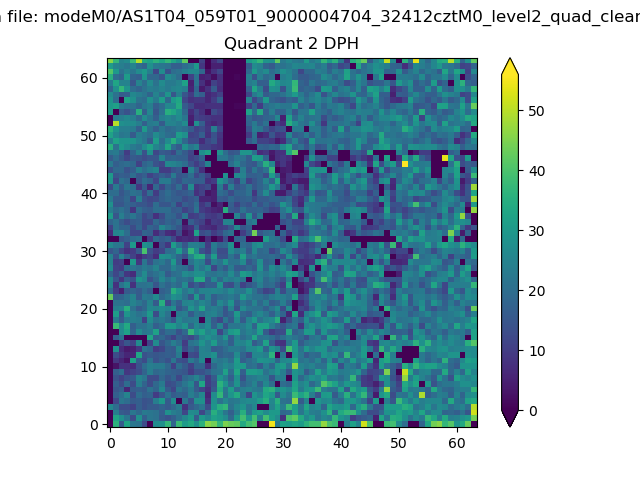
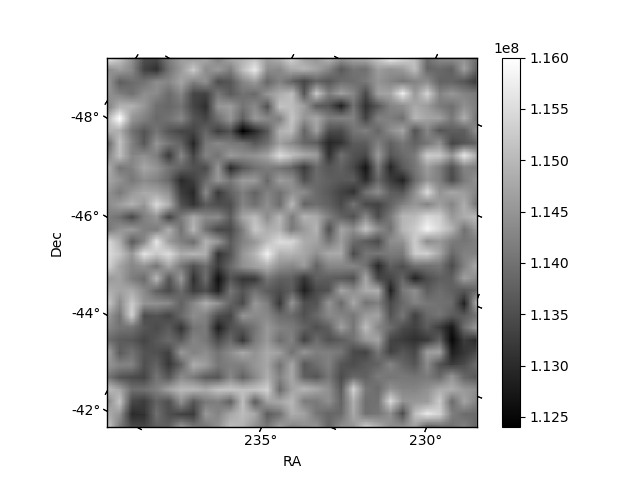
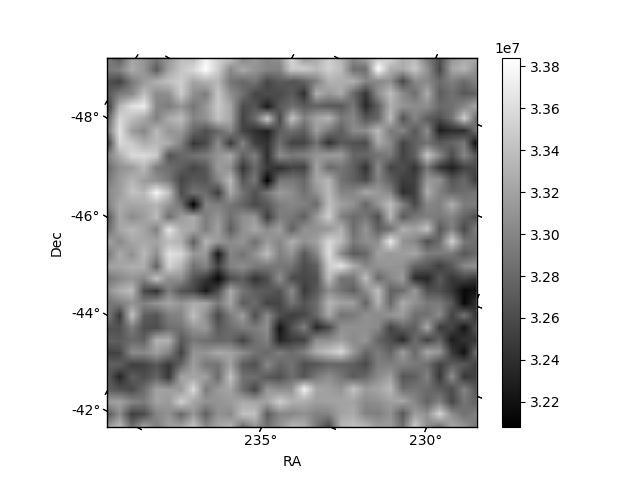
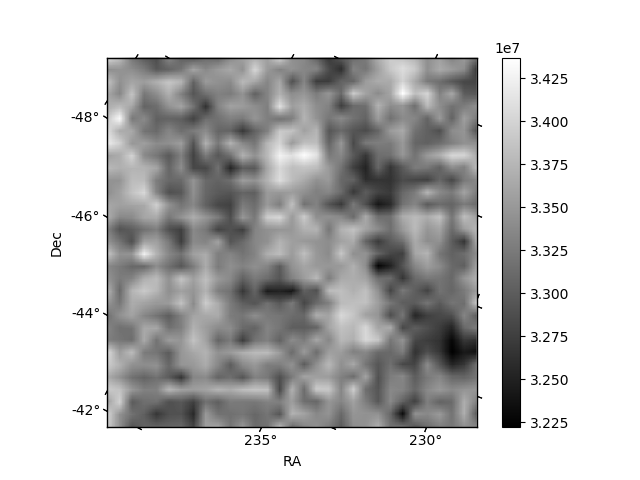
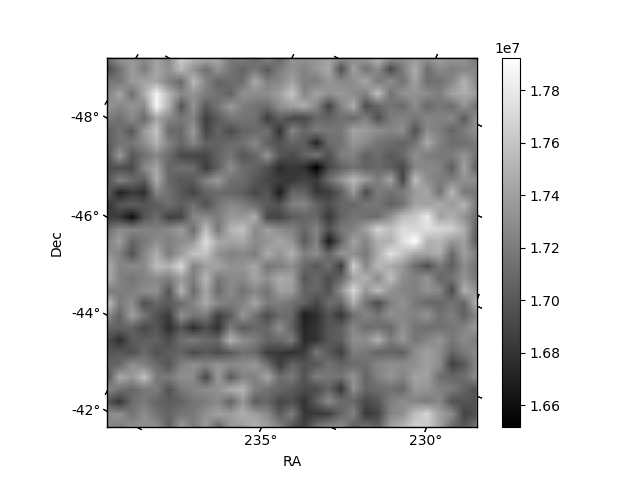
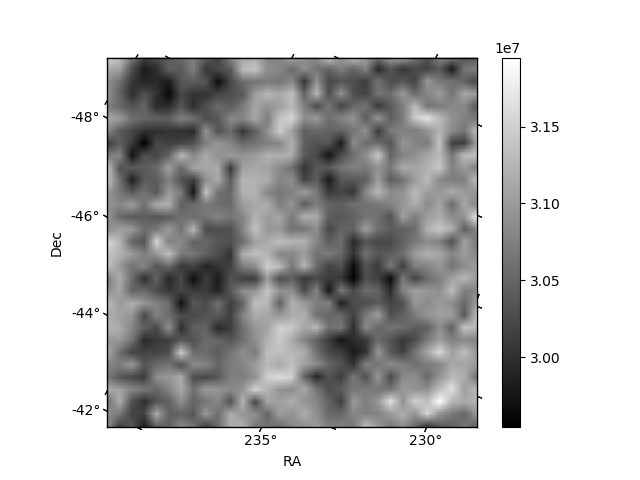
Histogram calculated using DETX and DETY for each event in the final _common_clean file
| Quadrant A | 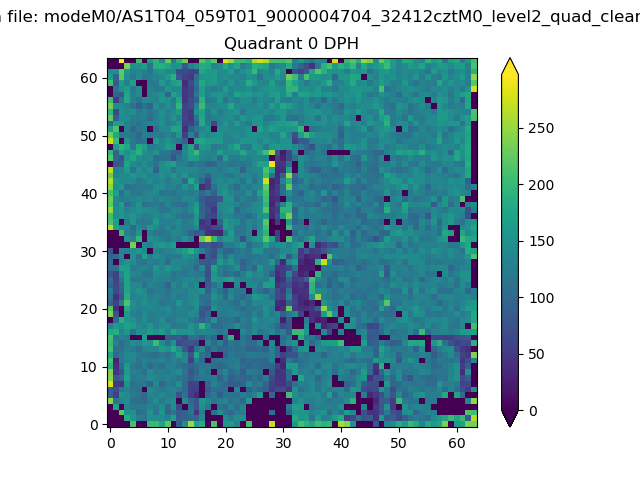 |
 |
Quadrant B |
|---|---|---|---|
| Quadrant D | 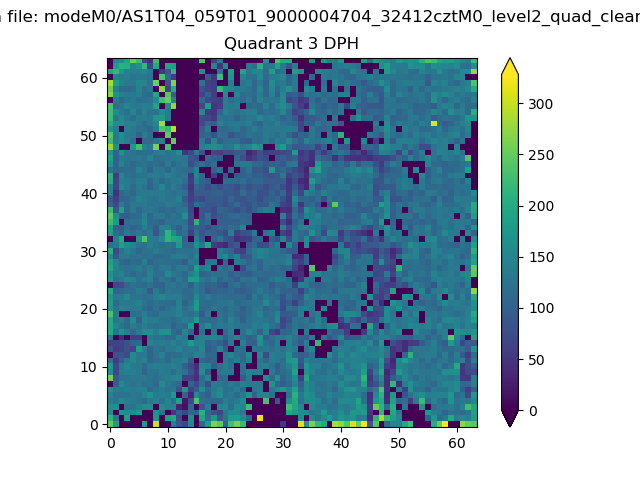 |
 |
Quadrant C |
| Plot type | Count rate plots | Images |
|---|---|---|
| Comparison with Poisson distribution Blue bars denote a histogram of data divided into 1 sec bins. Red curve is a Poisson curve with rate = median count rate of data. |
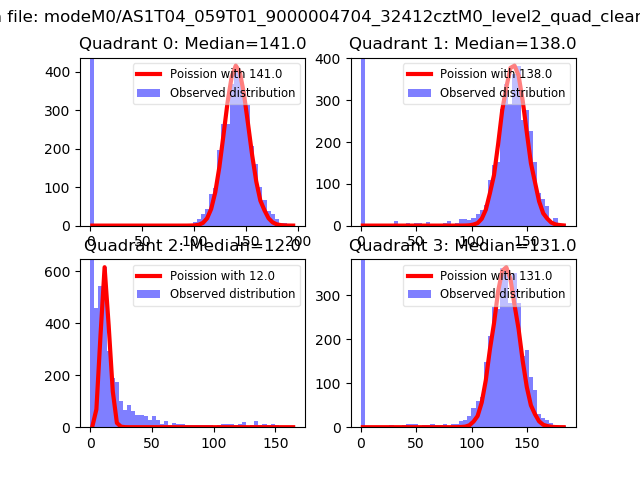 |
 |
| Quadrant-wise count rates Data is divided into 100 sec bins |
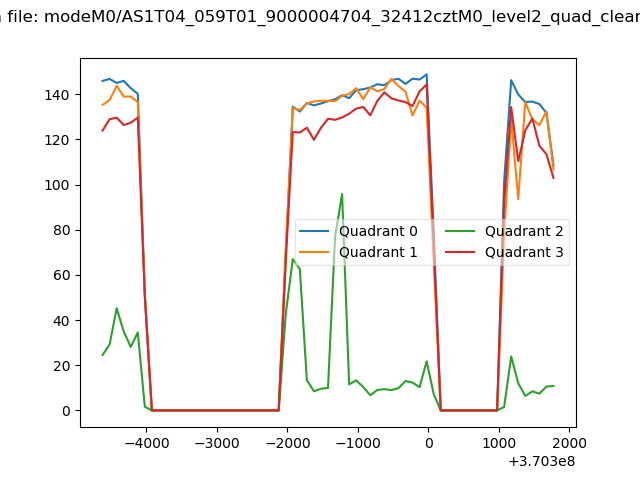 |
|
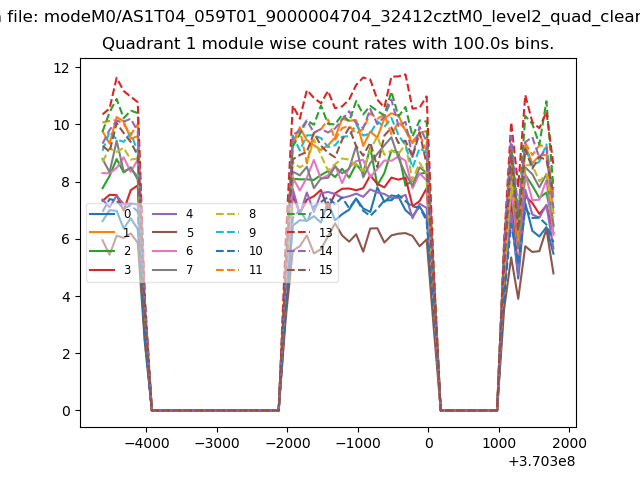
| Module-wise count rates for Quadrant A Data is divided into 100 sec bins |
 |
 |
| Module-wise count rates for Quadrant B Data is divided into 100 sec bins |
 |
 |
| Module-wise count rates for Quadrant C Data is divided into 100 sec bins |
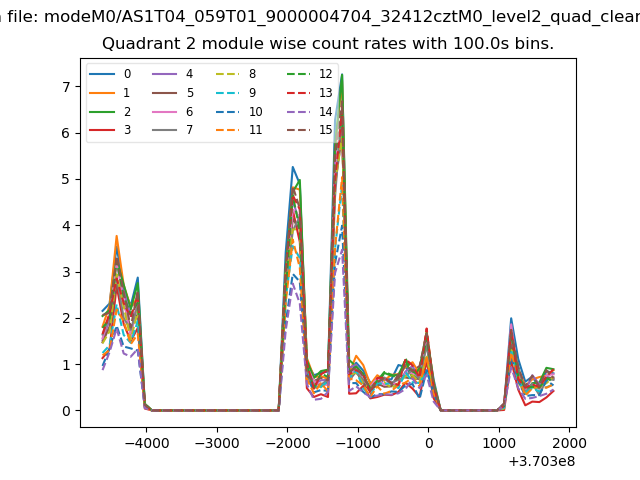 |
 |
| Module-wise count rates for Quadrant D Data is divided into 100 sec bins |
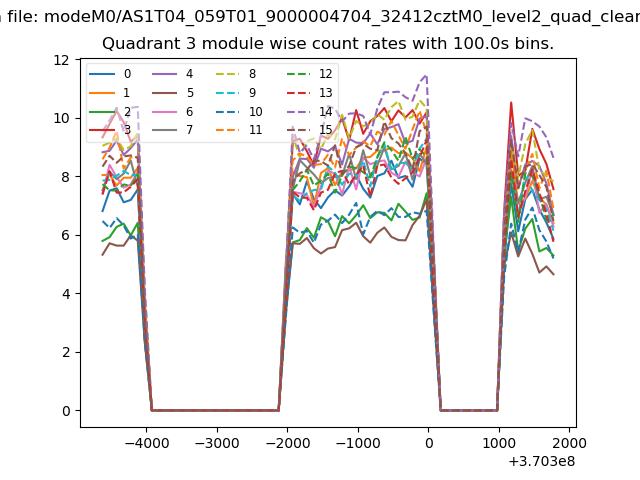 |
 |
| Parameter | Plot |
|---|---|
| CZT HV Monitor | 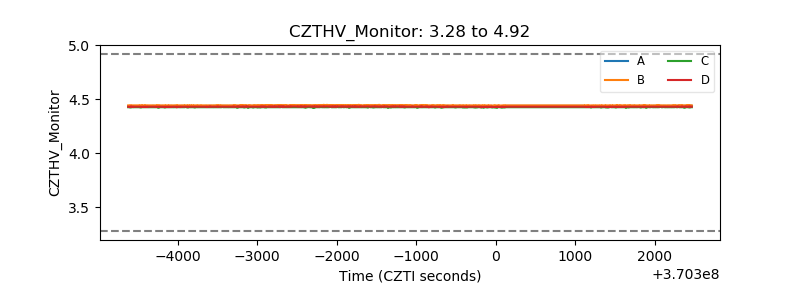 |
| D_VDD | 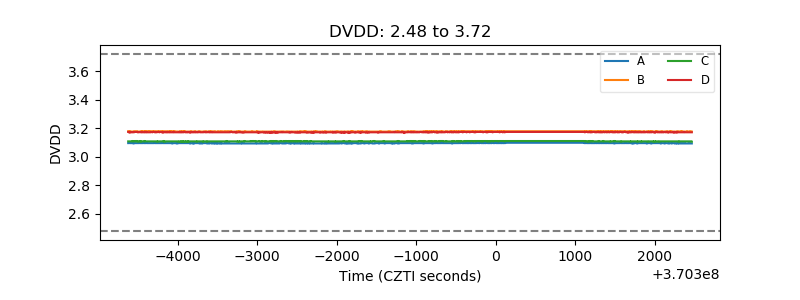 |
| Temperature 1 | 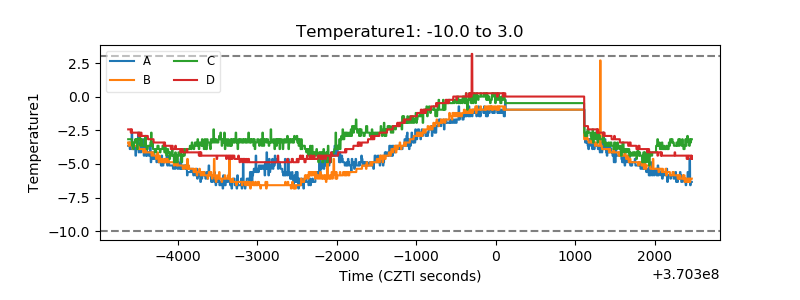 |
| Veto HV Monitor |  |
| Veto LLD |  |
| Alpha Counter | 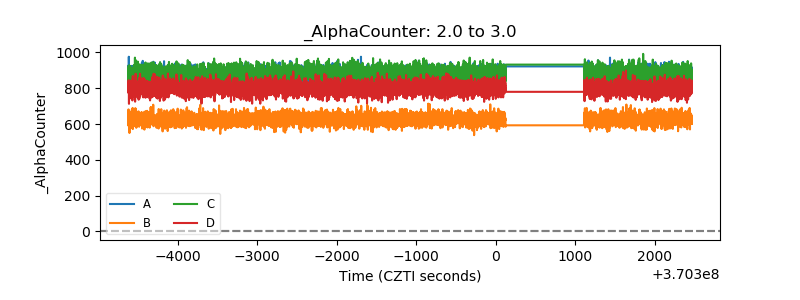 |
| _CPM_Rate | 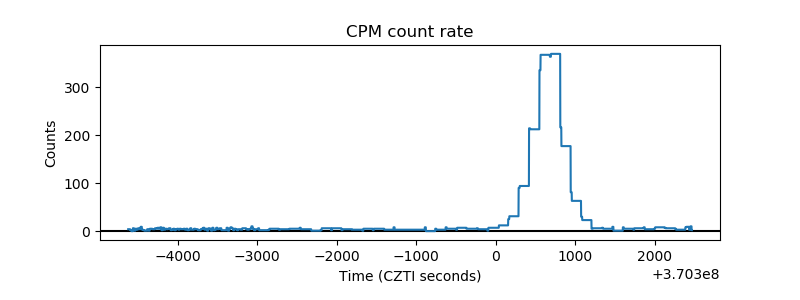 |
| CZT Counter | 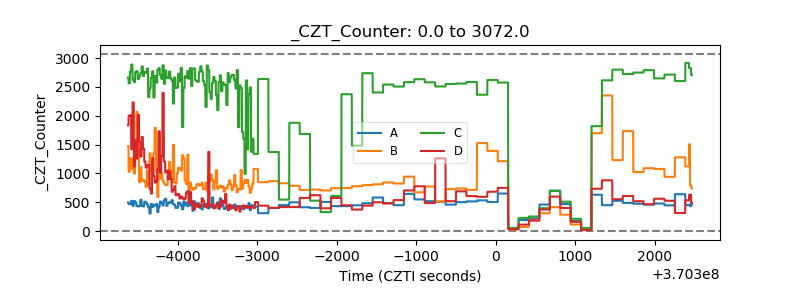 |
| +2.5 Volts monitor |  |
| +5 Volts monitor | 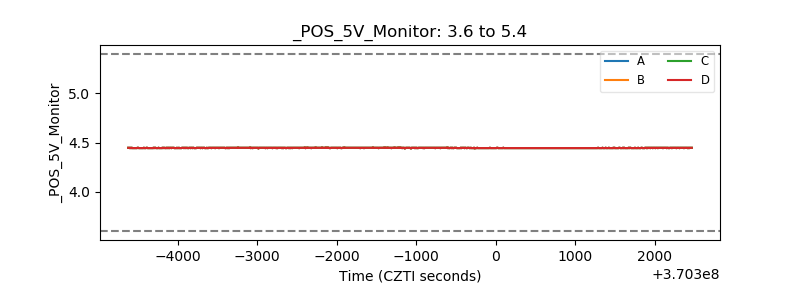 |
| _ROLL_ROT | 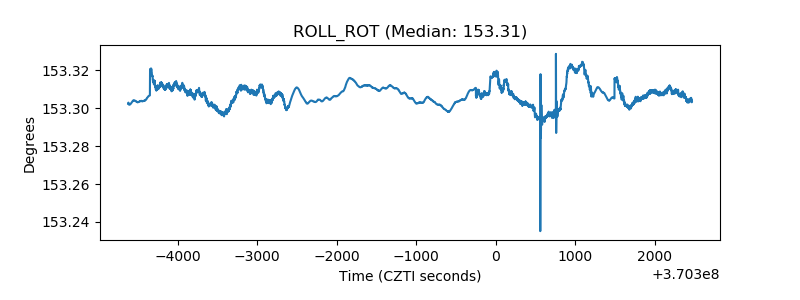 |
| _Roll_DEC | 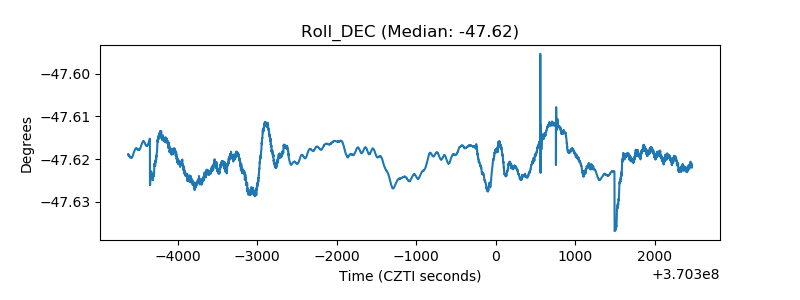 |
| _Roll_RA | 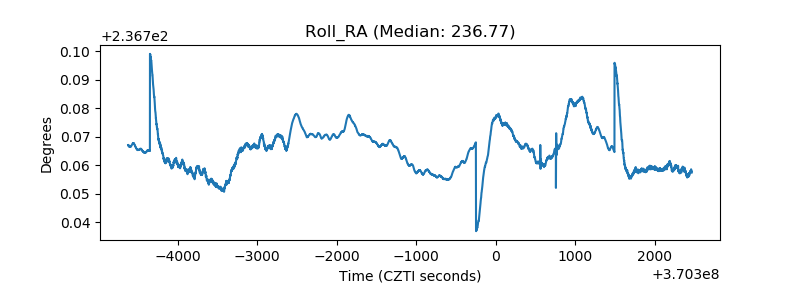 |
| Veto Counter | 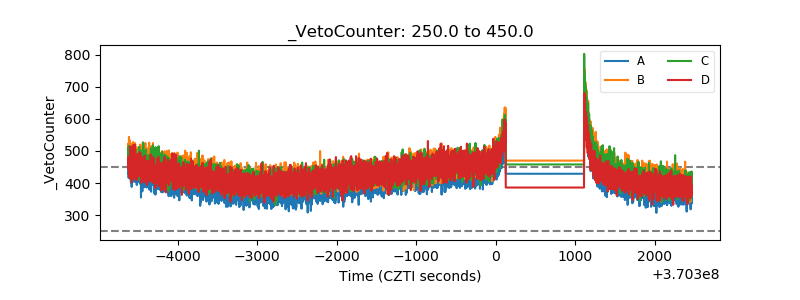 |