| Param | Original file | Final file |
|---|---|---|
| Filename | modeM0/AS1T04_059T01_9000004704_32414cztM0_level2.evt | modeM0/AS1T04_059T01_9000004704_32414cztM0_level2_quad_clean.evt |
| Size (bytes) | 1,108,935,360 | 69,514,560 |
| Size | 1.0 GB | 66.3 MB |
| Events in quadrant A | 3,495,632 | 500,546 |
| Events in quadrant B | 6,571,078 | 494,100 |
| Events in quadrant C | 17,433,984 | 133,039 |
| Events in quadrant D | 5,587,579 | 462,443 |
| Mode M0 | |||
|---|---|---|---|
| Quadrant | BADHDUFLAG | Total packets | Discarded packets |
| A | 0 | 15275 | 2 |
| B | 0 | 24915 | 1 |
| C | 0 | 56884 | 1 |
| D | 0 | 21590 | 1 |
| Mode M9 | |||
|---|---|---|---|
| Quadrant | BADHDUFLAG | Total packets | Discarded packets |
| A | 0 | 2 | 0 |
| B | 0 | 2 | 0 |
| C | 0 | 2 | 0 |
| D | 0 | 2 | 0 |
| Mode SS | |||
|---|---|---|---|
| Quadrant | BADHDUFLAG | Total packets | Discarded packets |
| A | 0 | 150 | 0 |
| B | 0 | 150 | 0 |
| C | 0 | 150 | 0 |
| D | 0 | 150 | 0 |
| Quadrant | Total seconds | Saturated seconds | Saturation percentage |
|---|---|---|---|
| A | 7372 | 122 | 1.654910% |
| B | 7372 | 367 | 4.978296% |
| C | 7372 | 6447 | 87.452523% |
| D | 7372 | 421 | 5.710798% |
Noise dominated data is calculated using 1-second bins in cleaned event files. If a bin has >2000 counts, and if more than 50% of those come from <1% of pixels, then it is considered to be noise-dominated and hence unusable.
| Quadrant | # 1 sec bins | Bins with >0 counts | Bins with >2000 counts | High rate bins dominated by noise | Noise dominated (total time) | Noise dominated (detector-on time) | Marked lightcurve |
|---|---|---|---|---|---|---|---|
| A | 7517 | 7374 | 2 | 2 | 0.03% | 0.03% | 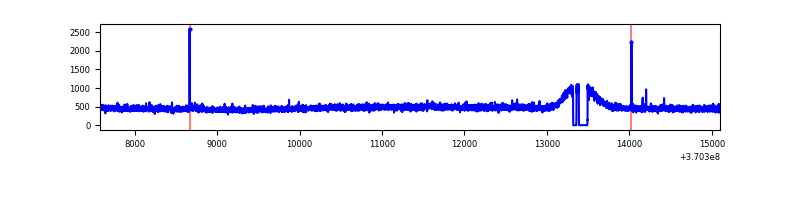 |
| B | 7517 | 7374 | 63 | 63 | 0.84% | 0.85% | 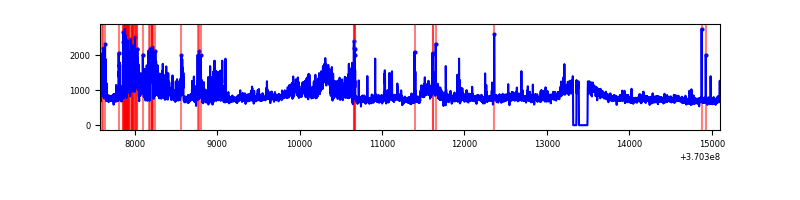 |
| C | 7517 | 7372 | 5811 | 5811 | 77.30% | 78.83% | 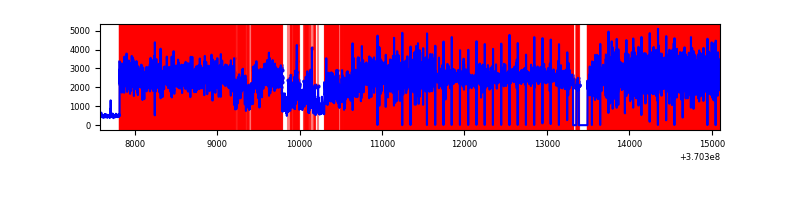 |
| D | 7517 | 7374 | 270 | 270 | 3.59% | 3.66% | 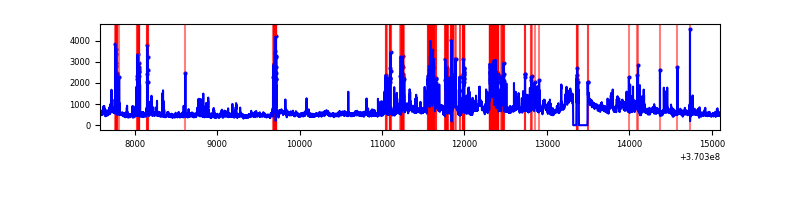 |
Top three noisy pixels from each quadrant. If the there are fewer than three noisy pixels in the level2.evt file, extra rows are filled as -1
| Pixel properties | Quadrant properties | ||||||
|---|---|---|---|---|---|---|---|
| Quadrant | DetID | PixID | Counts | Sigma | Mean | Median | Sigma |
| A | 13 | 254 | 13828 | 71.21 | 899 | 878 | 181.9 |
| A | 13 | 6 | 10661 | 53.8 | 899 | 878 | 181.9 |
| A | 3 | 137 | 9518 | 47.51 | 899 | 878 | 181.9 |
| B | 6 | 159 | 2036078 | 12058.12 | 885 | 862 | 168.8 |
| B | 4 | 80 | 888885 | 5261.3 | 885 | 862 | 168.8 |
| B | 0 | 190 | 45788 | 266.17 | 885 | 862 | 168.8 |
| C | 3 | 233 | 16243321 | 241295.01 | 284 | 284 | 67.3 |
| C | 14 | 238 | 43526 | 642.37 | 284 | 284 | 67.3 |
| C | 14 | 67 | 15754 | 229.81 | 284 | 284 | 67.3 |
| D | 8 | 195 | 996821 | 4843.68 | 854 | 830 | 205.6 |
| D | 12 | 233 | 550477 | 2673.03 | 854 | 830 | 205.6 |
| D | 1 | 47 | 321290 | 1558.45 | 854 | 830 | 205.6 |
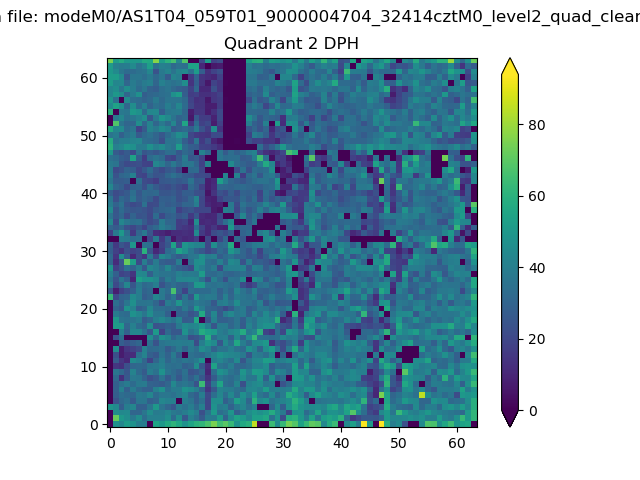
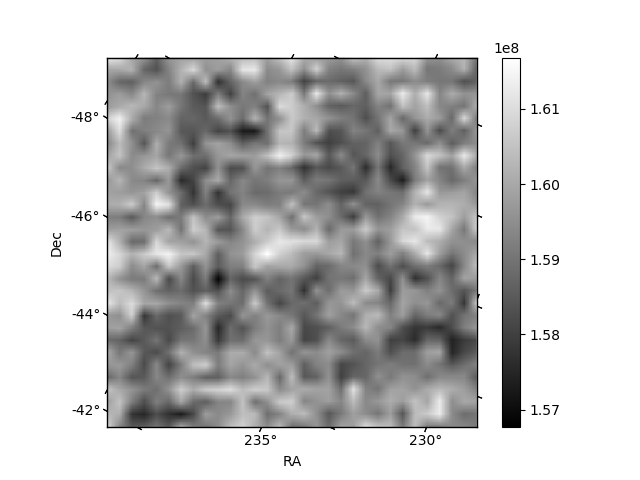
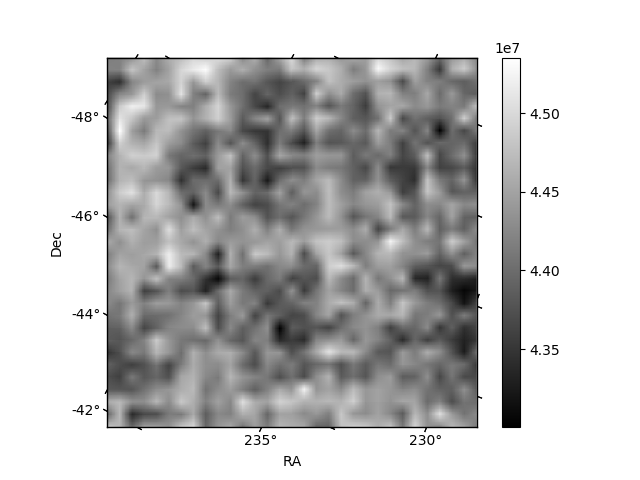
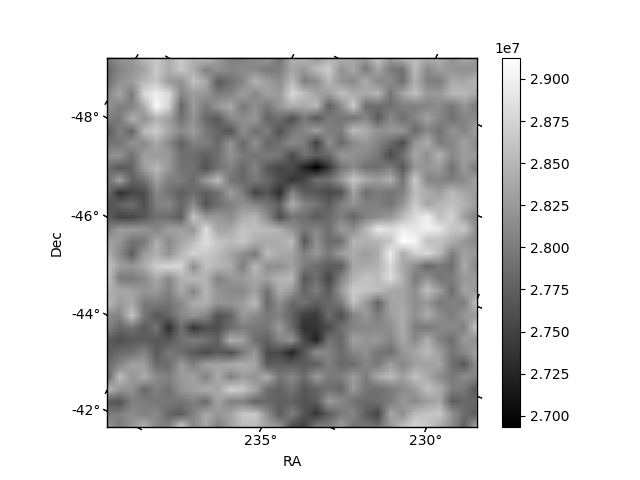
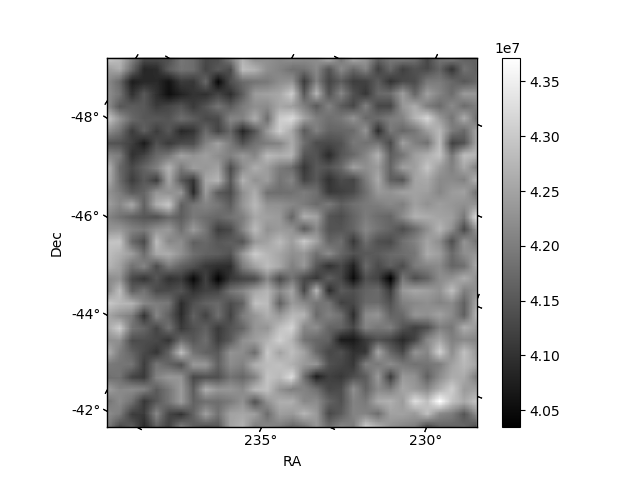
Histogram calculated using DETX and DETY for each event in the final _common_clean file
| Quadrant A | 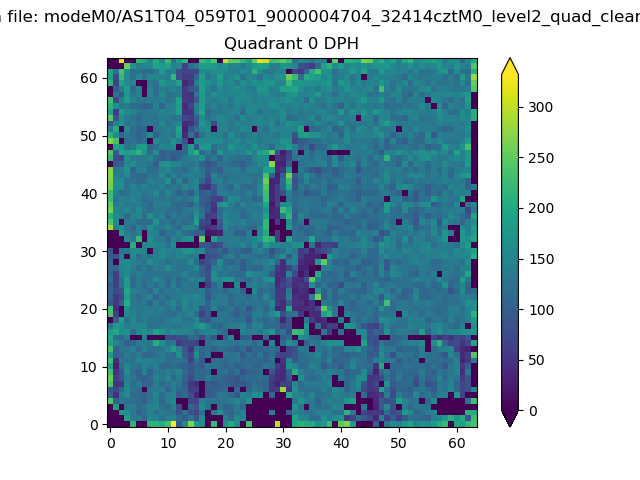 |
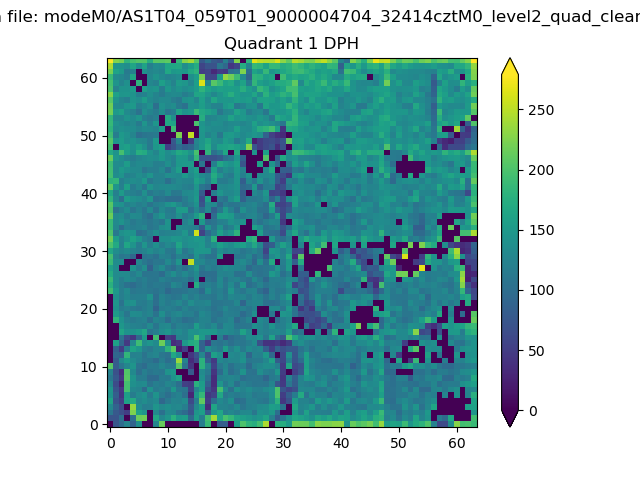 |
Quadrant B |
|---|---|---|---|
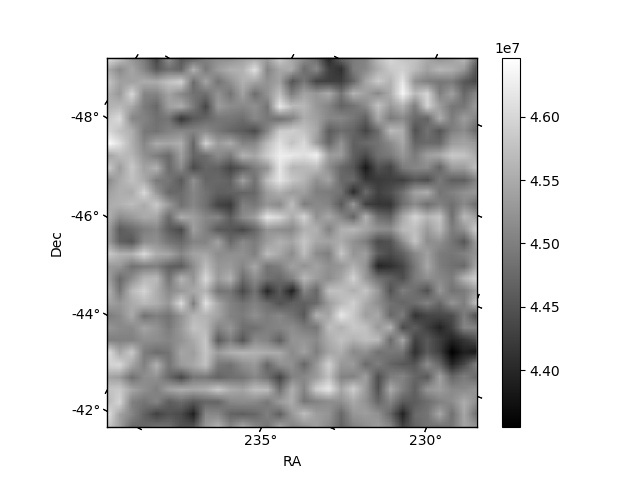
| Quadrant D | 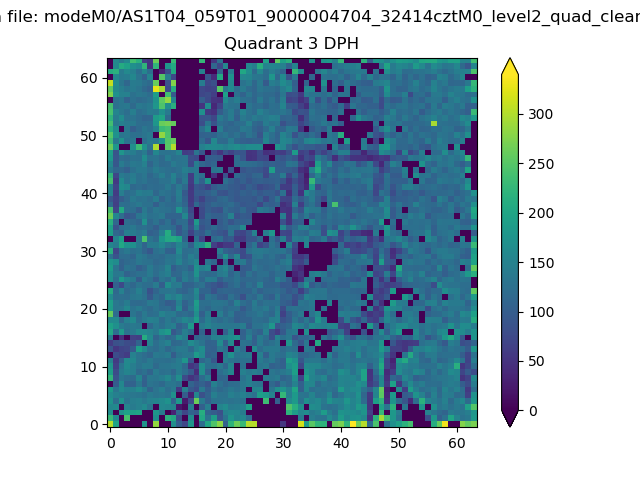 |
 |
Quadrant C |
| Plot type | Count rate plots | Images |
|---|---|---|
| Comparison with Poisson distribution Blue bars denote a histogram of data divided into 1 sec bins. Red curve is a Poisson curve with rate = median count rate of data. |
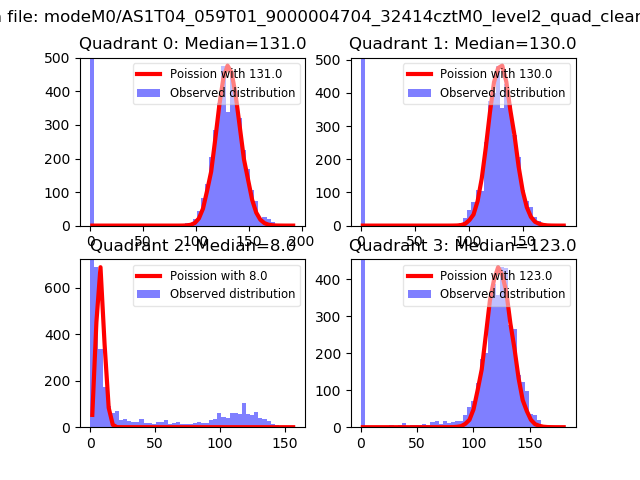 |
 |
| Quadrant-wise count rates Data is divided into 100 sec bins |
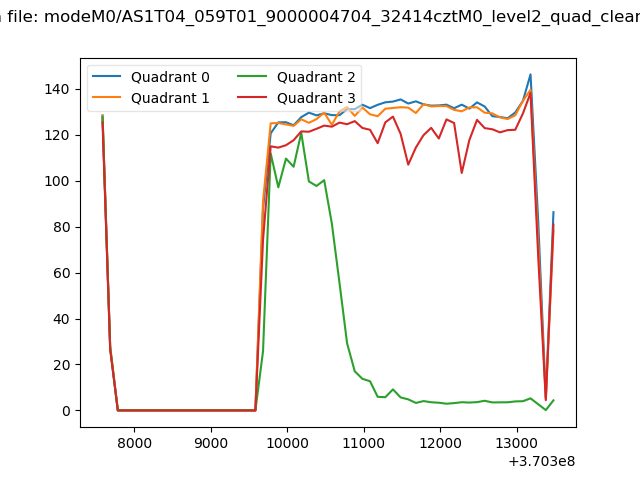 |
|
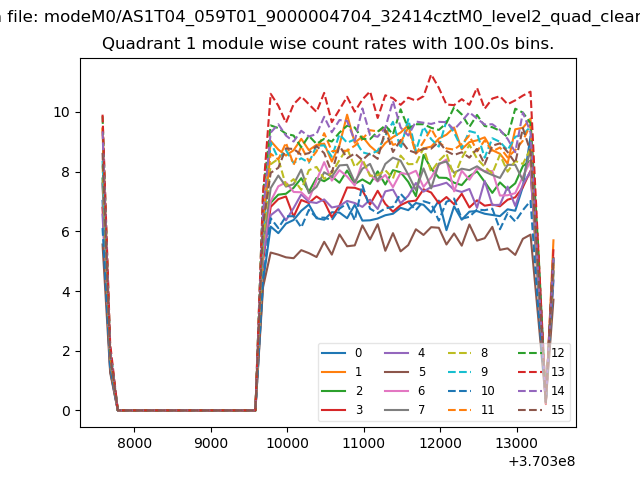
| Module-wise count rates for Quadrant A Data is divided into 100 sec bins |
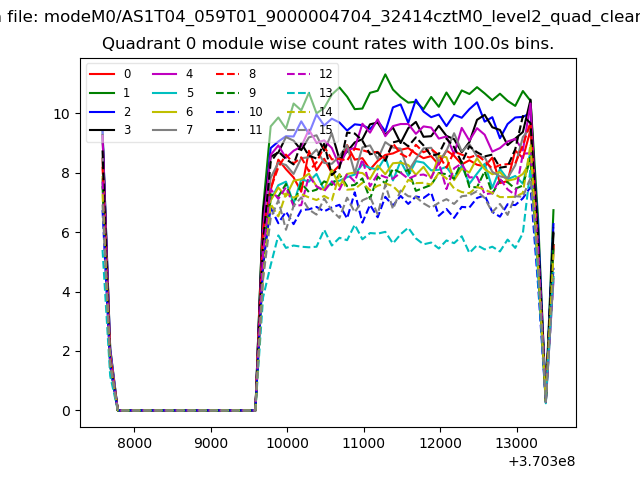 |
 |
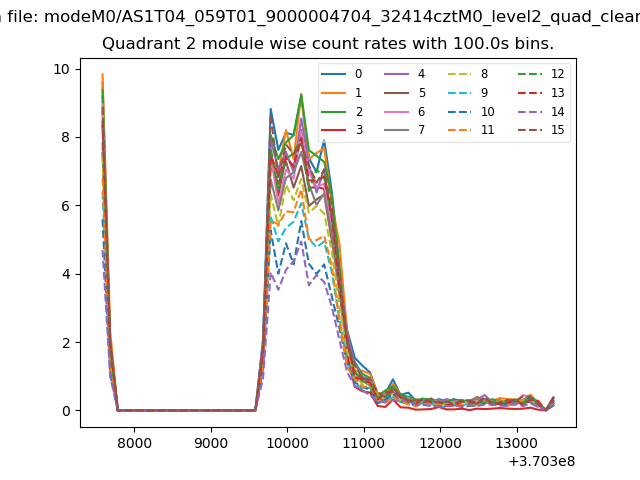
| Module-wise count rates for Quadrant B Data is divided into 100 sec bins |
 |
 |
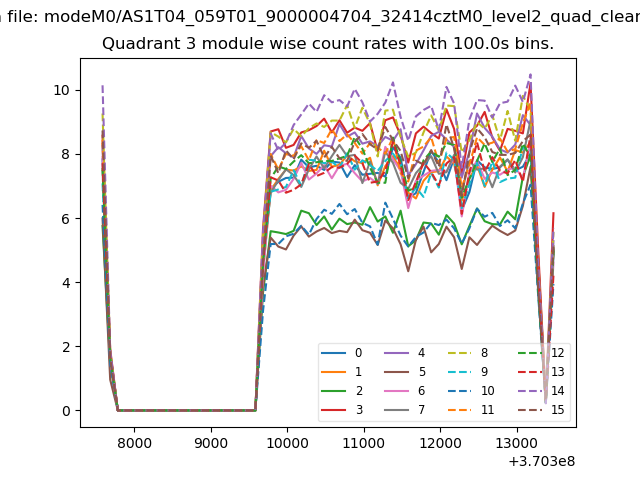
| Module-wise count rates for Quadrant C Data is divided into 100 sec bins |
 |
 |
| Module-wise count rates for Quadrant D Data is divided into 100 sec bins |
 |
 |
| Parameter | Plot |
|---|---|
| CZT HV Monitor | 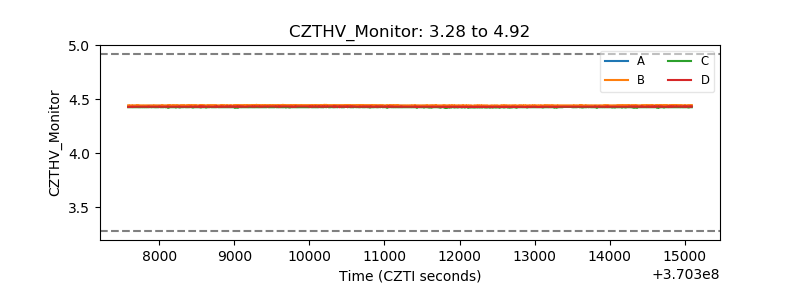 |
| D_VDD | 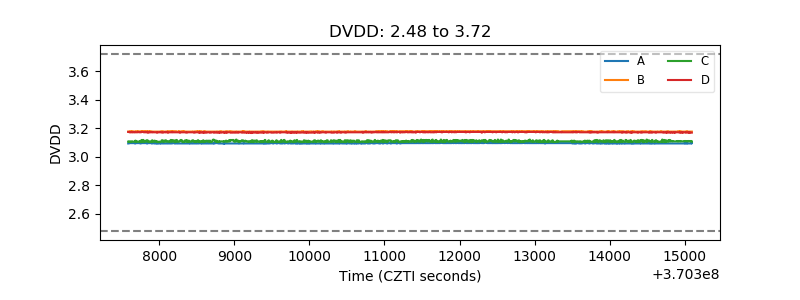 |
| Temperature 1 | 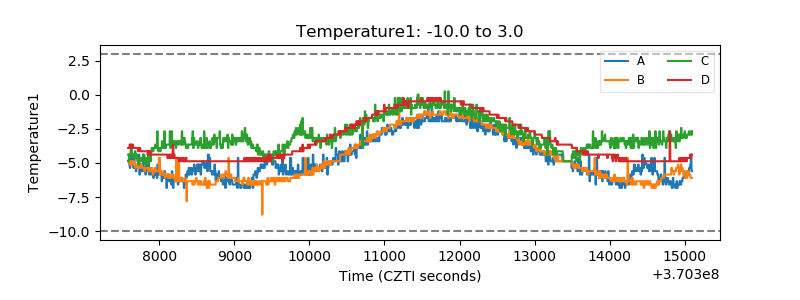 |
| Veto HV Monitor | 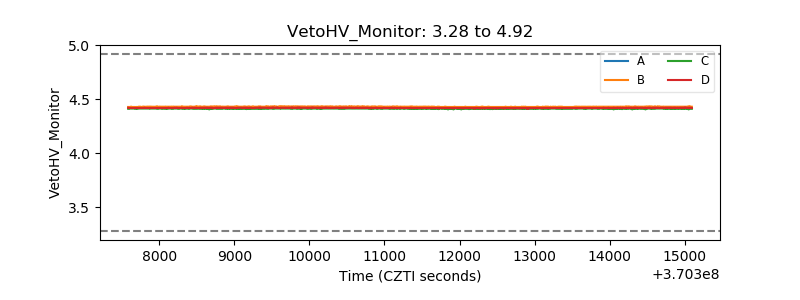 |
| Veto LLD | 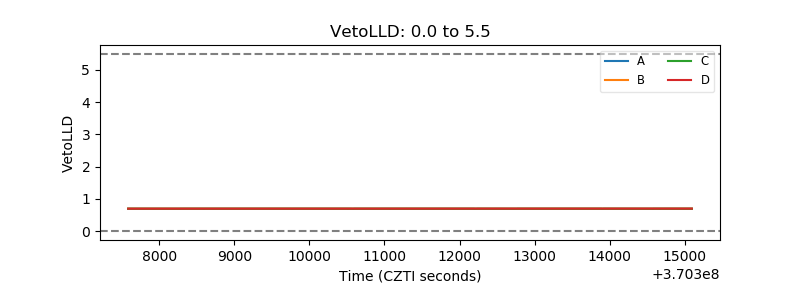 |
| Alpha Counter | 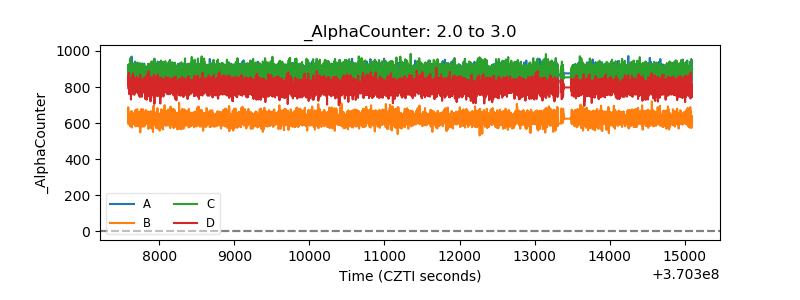 |
| _CPM_Rate | 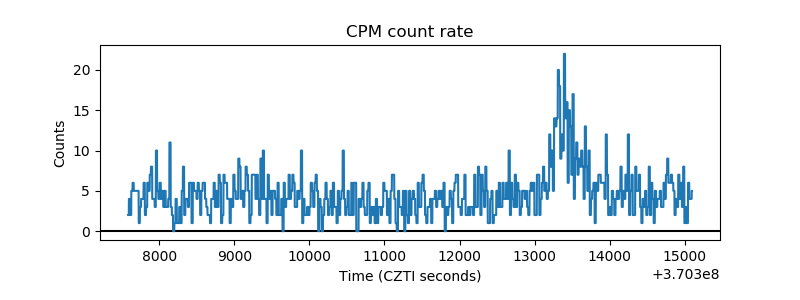 |
| CZT Counter | 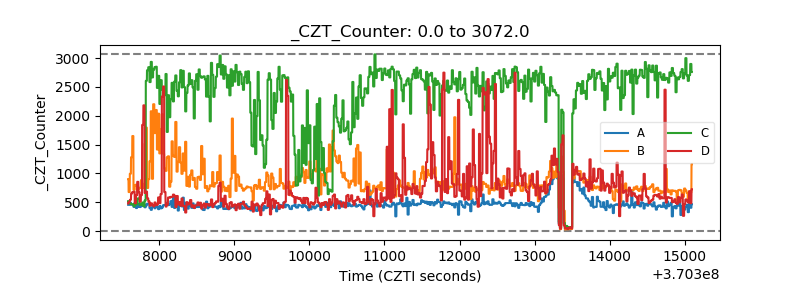 |
| +2.5 Volts monitor |  |
| +5 Volts monitor |  |
| _ROLL_ROT | 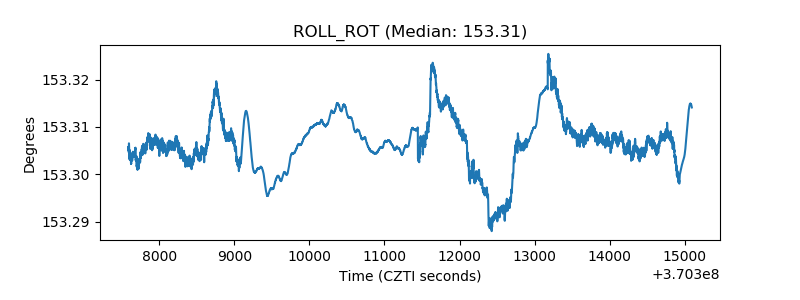 |
| _Roll_DEC | 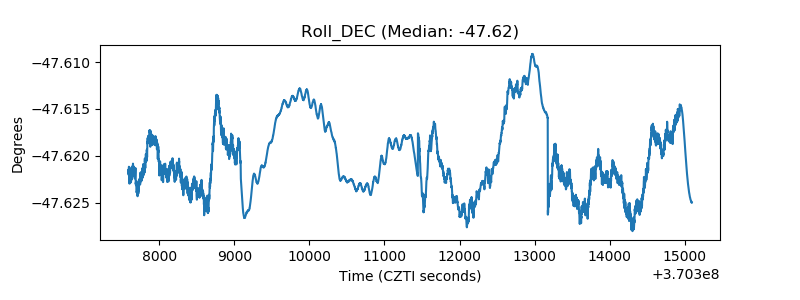 |
| _Roll_RA | 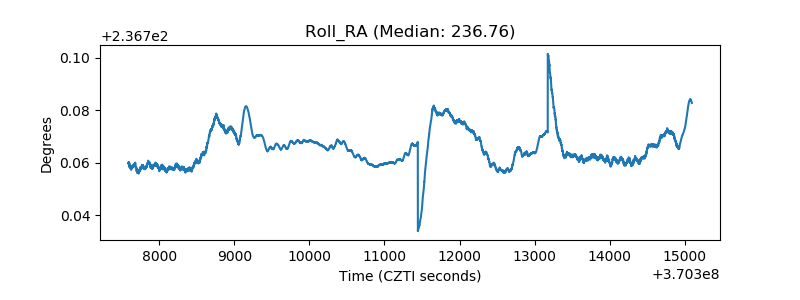 |
| Veto Counter | 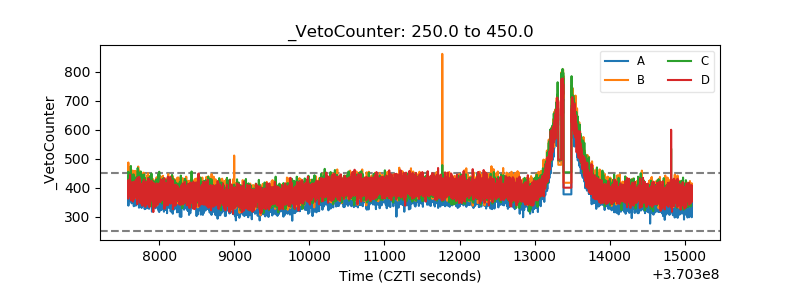 |