| Param | Original file | Final file |
|---|---|---|
| Filename | modeM0/AS1T04_059T01_9000004704_32415cztM0_level2.evt | modeM0/AS1T04_059T01_9000004704_32415cztM0_level2_quad_clean.evt |
| Size (bytes) | 1,112,592,960 | 67,599,360 |
| Size | 1.0 GB | 64.5 MB |
| Events in quadrant A | 3,391,212 | 499,297 |
| Events in quadrant B | 5,520,102 | 496,026 |
| Events in quadrant C | 18,599,659 | 97,380 |
| Events in quadrant D | 5,707,212 | 459,126 |
| Mode M0 | |||
|---|---|---|---|
| Quadrant | BADHDUFLAG | Total packets | Discarded packets |
| A | 0 | 14745 | 1 |
| B | 0 | 21901 | 0 |
| C | 0 | 60174 | 0 |
| D | 0 | 21624 | 0 |
| Mode M9 | |||
|---|---|---|---|
| Quadrant | BADHDUFLAG | Total packets | Discarded packets |
| A | 0 | 2 | 0 |
| B | 0 | 2 | 0 |
| C | 0 | 2 | 0 |
| D | 0 | 2 | 0 |
| Mode SS | |||
|---|---|---|---|
| Quadrant | BADHDUFLAG | Total packets | Discarded packets |
| A | 0 | 144 | 0 |
| B | 0 | 144 | 0 |
| C | 0 | 144 | 0 |
| D | 0 | 144 | 0 |
| Quadrant | Total seconds | Saturated seconds | Saturation percentage |
|---|---|---|---|
| A | 7084 | 204 | 2.879729% |
| B | 7084 | 300 | 4.234896% |
| C | 7084 | 7042 | 99.407115% |
| D | 7084 | 474 | 6.691135% |
Noise dominated data is calculated using 1-second bins in cleaned event files. If a bin has >2000 counts, and if more than 50% of those come from <1% of pixels, then it is considered to be noise-dominated and hence unusable.
| Quadrant | # 1 sec bins | Bins with >0 counts | Bins with >2000 counts | High rate bins dominated by noise | Noise dominated (total time) | Noise dominated (detector-on time) | Marked lightcurve |
|---|---|---|---|---|---|---|---|
| A | 7194 | 7088 | 8 | 8 | 0.11% | 0.11% | 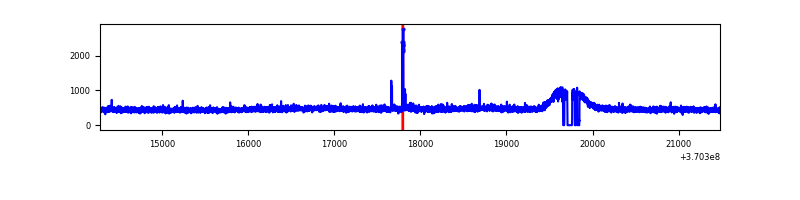 |
| B | 7194 | 7088 | 15 | 15 | 0.21% | 0.21% | 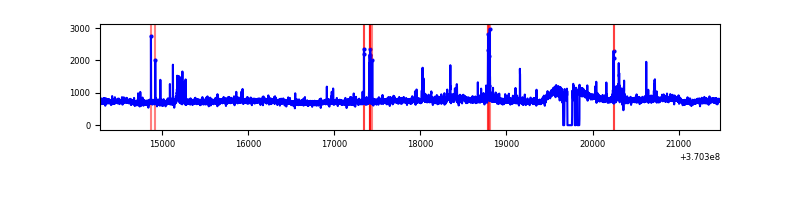 |
| C | 7194 | 7088 | 6266 | 6266 | 87.10% | 88.40% | 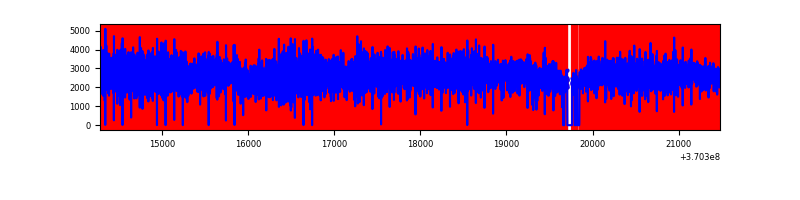 |
| D | 7194 | 7088 | 297 | 297 | 4.13% | 4.19% | 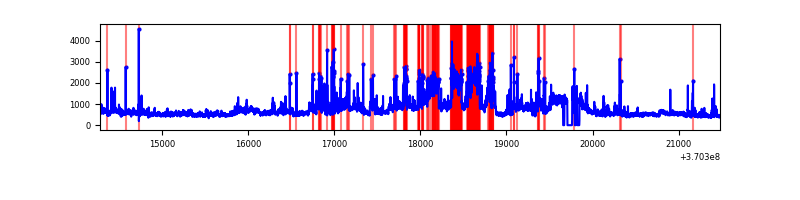 |
Top three noisy pixels from each quadrant. If the there are fewer than three noisy pixels in the level2.evt file, extra rows are filled as -1
| Pixel properties | Quadrant properties | ||||||
|---|---|---|---|---|---|---|---|
| Quadrant | DetID | PixID | Counts | Sigma | Mean | Median | Sigma |
| A | 15 | 174 | 36237 | 200.75 | 864 | 844 | 176.3 |
| A | 13 | 6 | 17909 | 96.79 | 864 | 844 | 176.3 |
| A | 13 | 254 | 13924 | 74.19 | 864 | 844 | 176.3 |
| B | 6 | 159 | 1940366 | 11752.21 | 850 | 827 | 165.0 |
| B | 0 | 190 | 84931 | 509.61 | 850 | 827 | 165.0 |
| B | 10 | 245 | 67293 | 402.74 | 850 | 827 | 165.0 |
| C | 3 | 233 | 17690364 | 346216.2 | 215 | 215 | 51.1 |
| C | 14 | 238 | 37193 | 723.7 | 215 | 215 | 51.1 |
| C | 14 | 254 | 11547 | 221.78 | 215 | 215 | 51.1 |
| D | 8 | 195 | 1297818 | 6478.25 | 825 | 800 | 200.2 |
| D | 12 | 218 | 818968 | 4086.52 | 825 | 800 | 200.2 |
| D | 1 | 47 | 195387 | 971.91 | 825 | 800 | 200.2 |
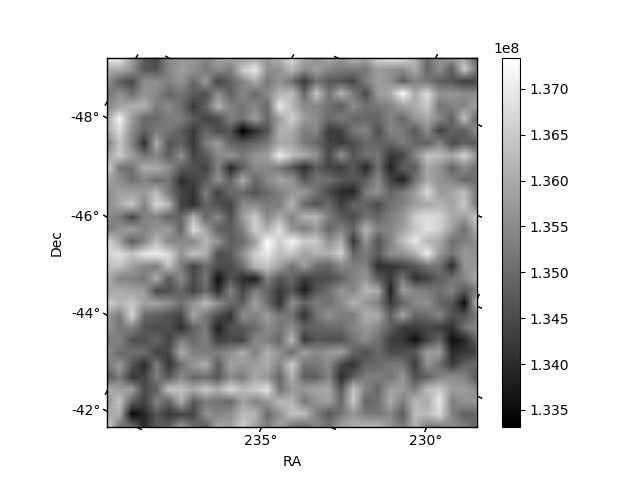
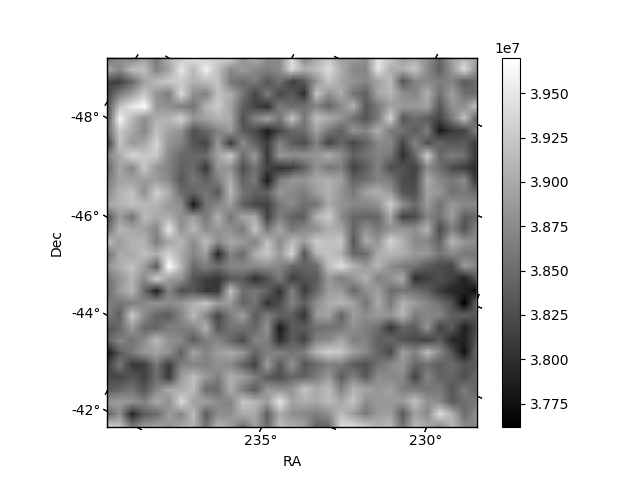
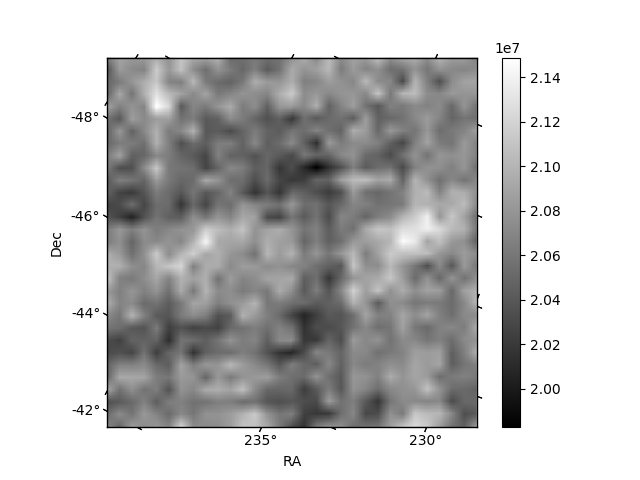
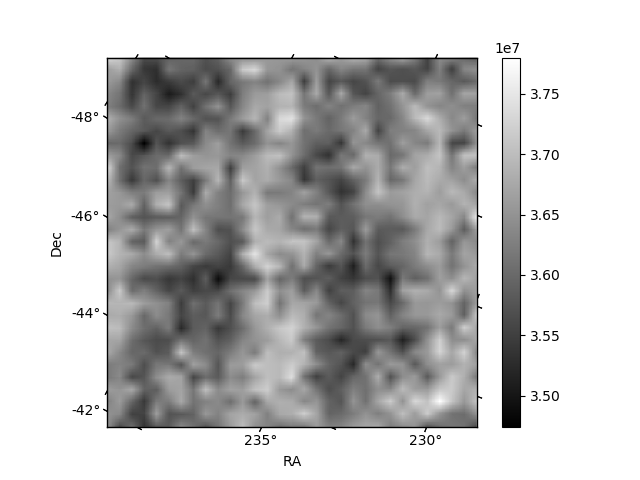
Histogram calculated using DETX and DETY for each event in the final _common_clean file
| Quadrant A | 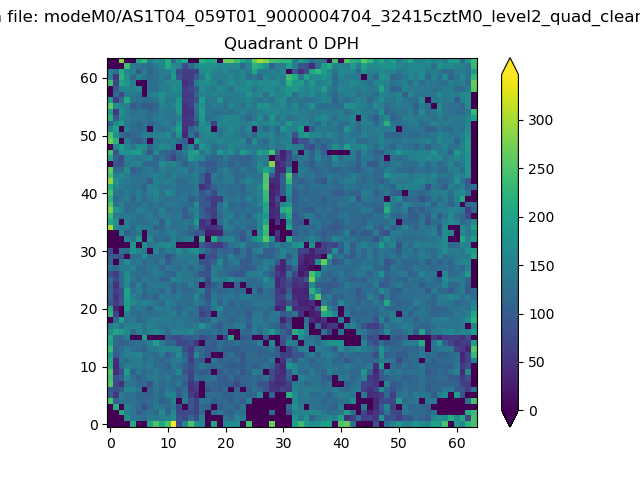 |
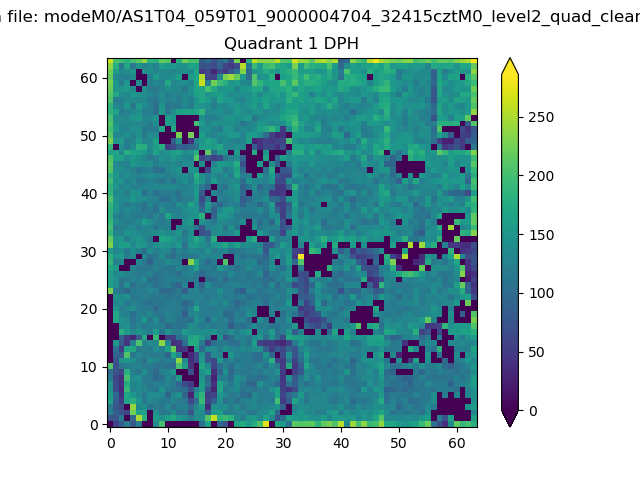 |
Quadrant B |
|---|---|---|---|
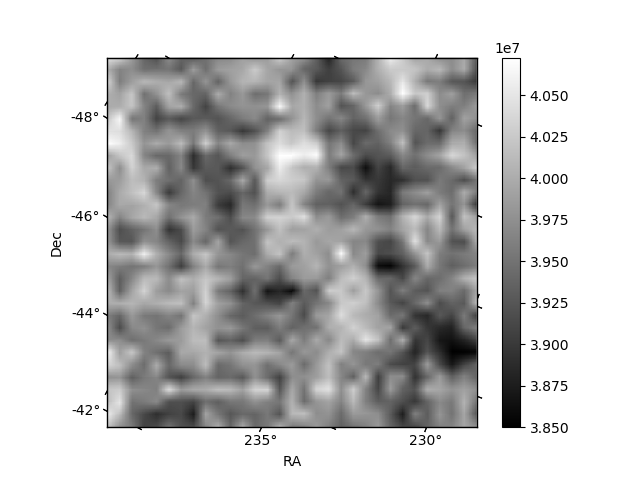
| Quadrant D | 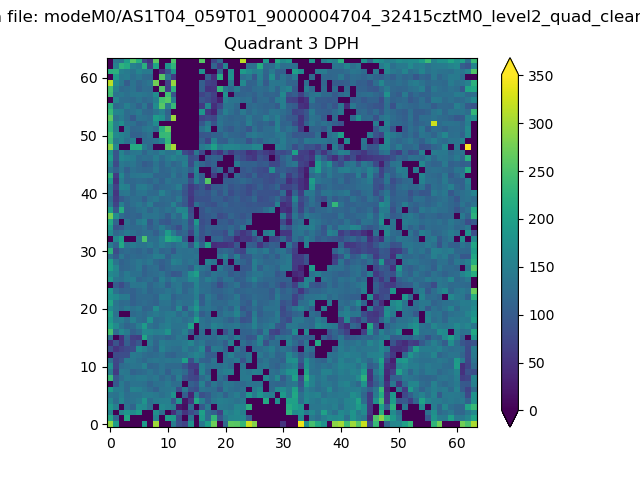 |
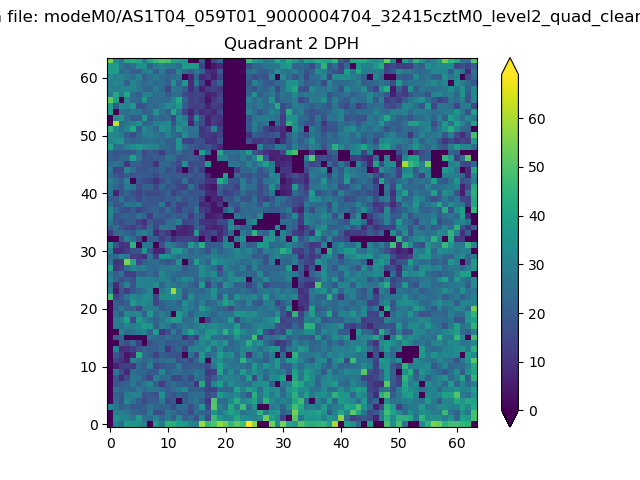 |
Quadrant C |
| Plot type | Count rate plots | Images |
|---|---|---|
| Comparison with Poisson distribution Blue bars denote a histogram of data divided into 1 sec bins. Red curve is a Poisson curve with rate = median count rate of data. |
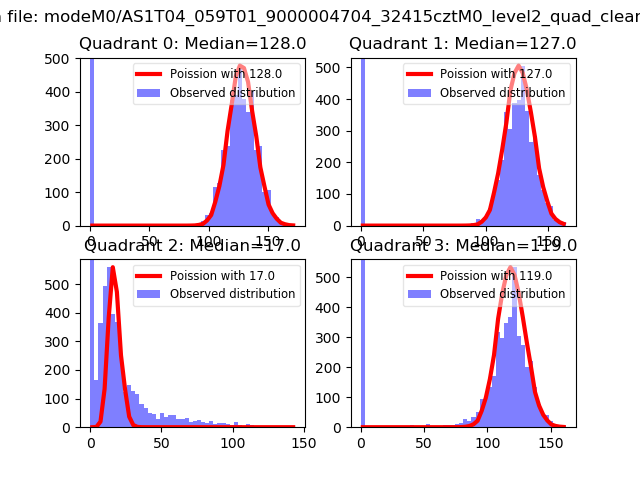 |
 |
| Quadrant-wise count rates Data is divided into 100 sec bins |
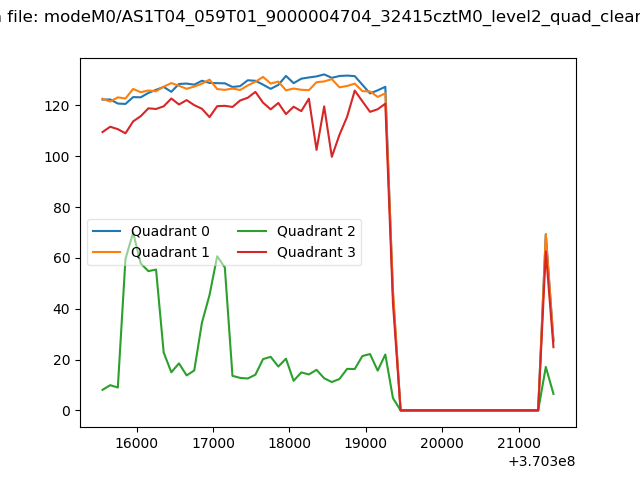 |
|
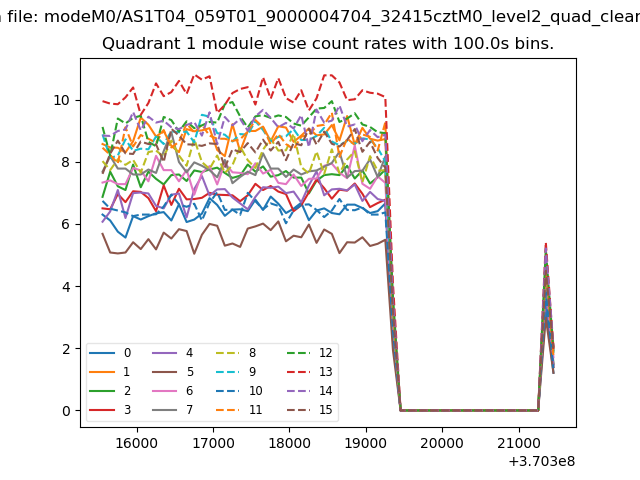
| Module-wise count rates for Quadrant A Data is divided into 100 sec bins |
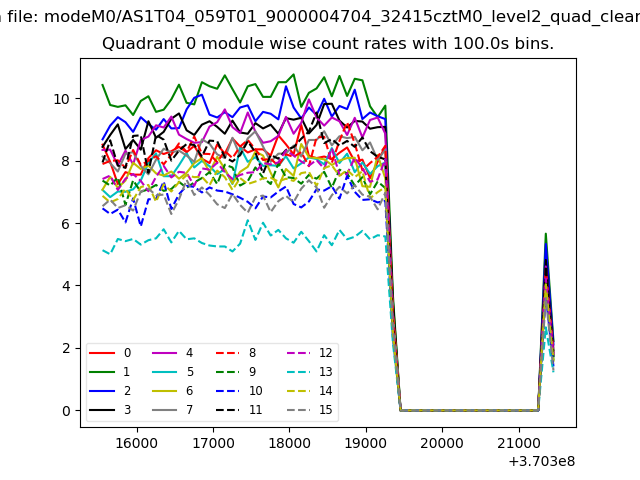 |
 |
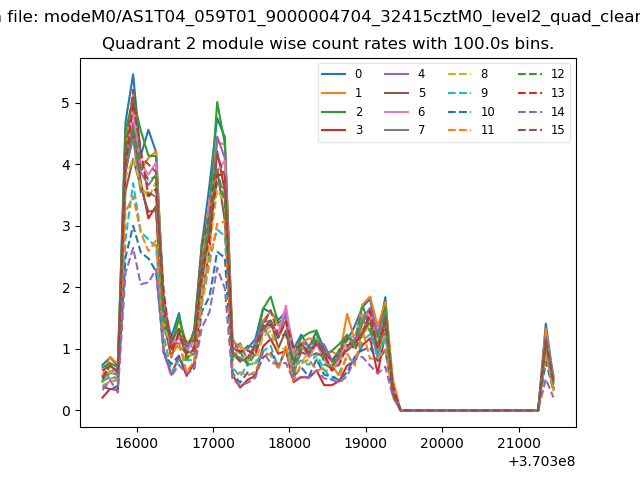
| Module-wise count rates for Quadrant B Data is divided into 100 sec bins |
 |
 |
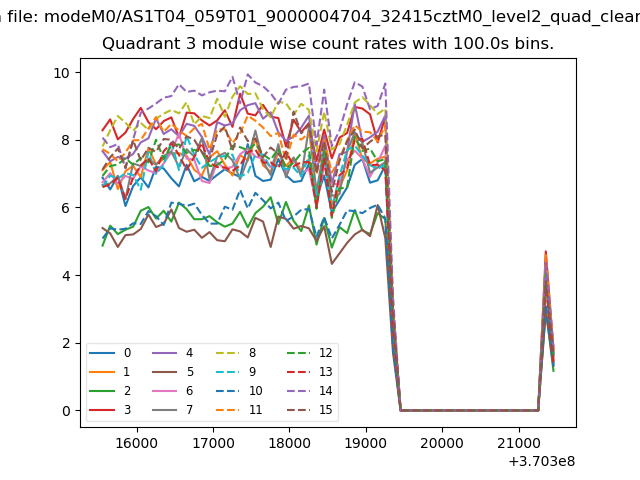
| Module-wise count rates for Quadrant C Data is divided into 100 sec bins |
 |
 |
| Module-wise count rates for Quadrant D Data is divided into 100 sec bins |
 |
 |
| Parameter | Plot |
|---|---|
| CZT HV Monitor | 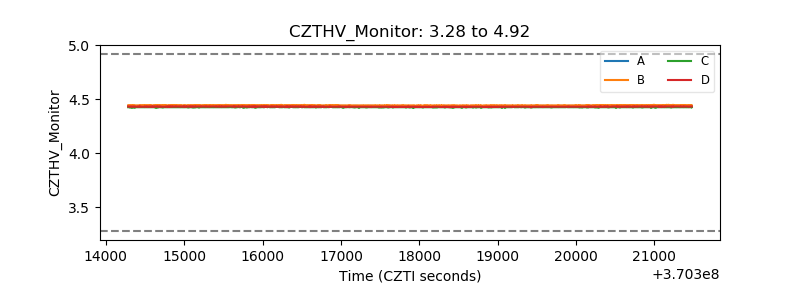 |
| D_VDD | 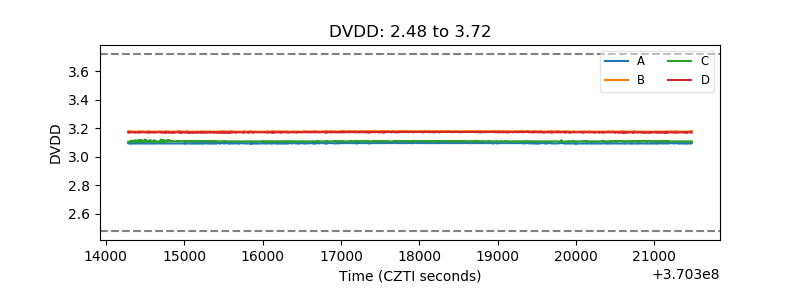 |
| Temperature 1 | 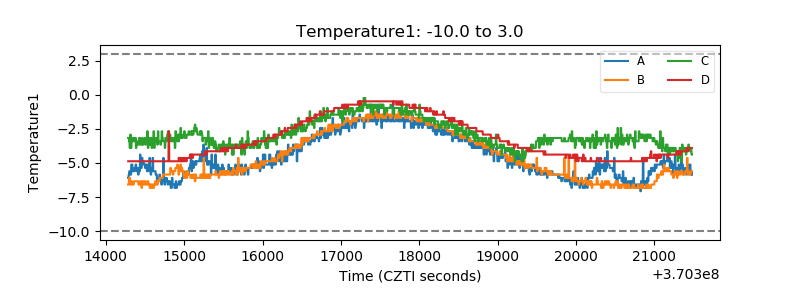 |
| Veto HV Monitor |  |
| Veto LLD | 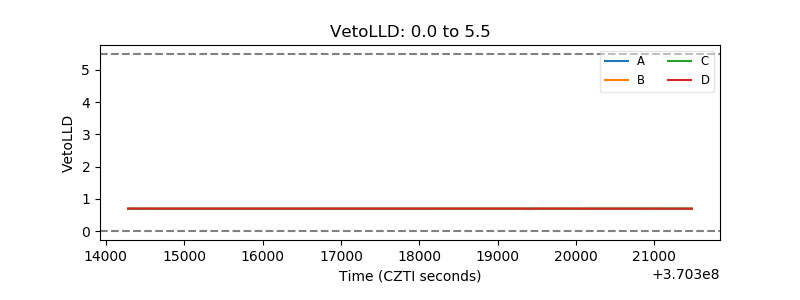 |
| Alpha Counter | 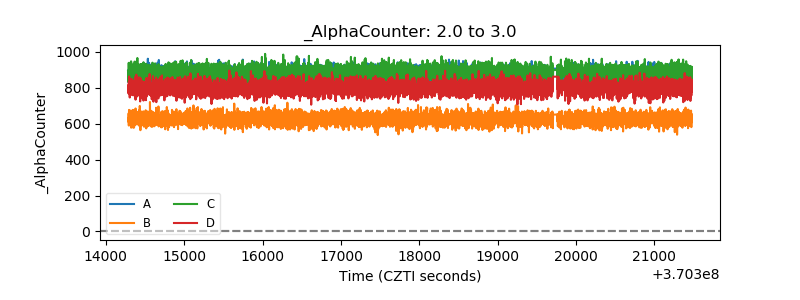 |
| _CPM_Rate | 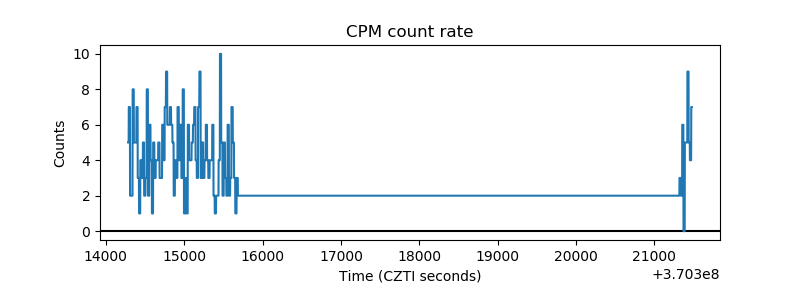 |
| CZT Counter | 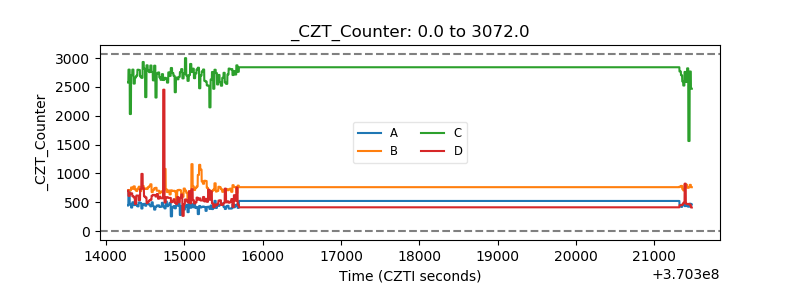 |
| +2.5 Volts monitor |  |
| +5 Volts monitor | 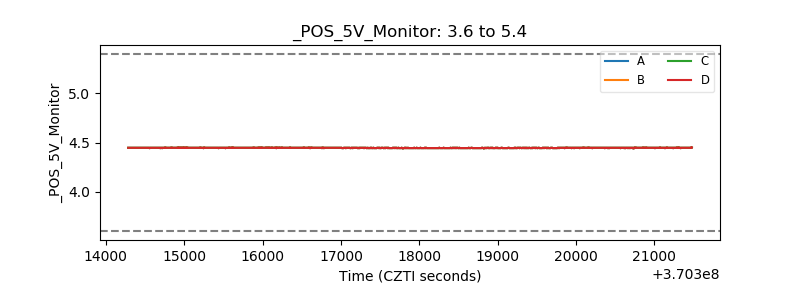 |
| _ROLL_ROT | 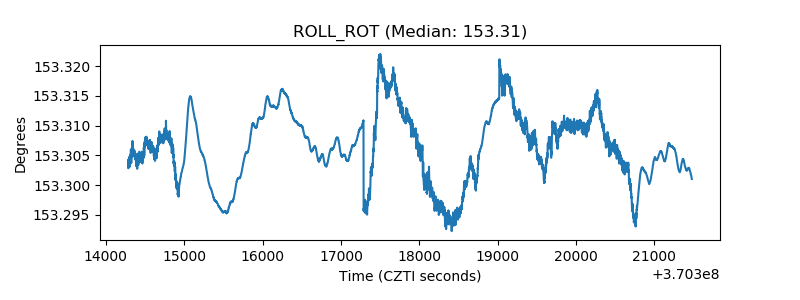 |
| _Roll_DEC | 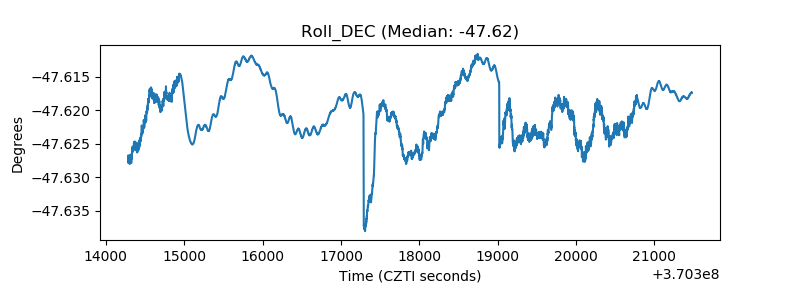 |
| _Roll_RA | 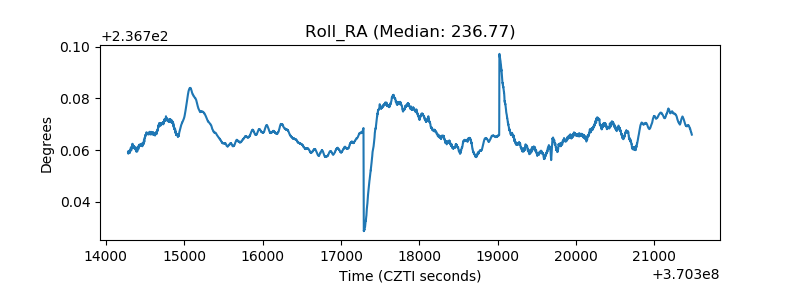 |
| Veto Counter | 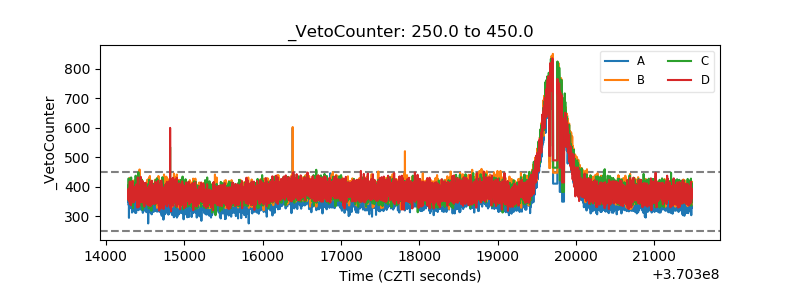 |