| Param | Original file | Final file |
|---|---|---|
| Filename | modeM0/AS1A09_108T02_9000004706cztM0_level2.fits | modeM0/AS1A09_108T02_9000004706cztM0_level2_quad_clean.evt |
| Size (bytes) | 481,659,840 | 434,128,320 |
| Size | 459.3 MB | 414.0 MB |
| Events in quadrant A | 3,041,322 | 2,636,767 |
| Events in quadrant B | 2,855,362 | 2,694,677 |
| Events in quadrant C | 2,747,112 | 2,146,212 |
| Events in quadrant D | 2,594,470 | 2,324,022 |
| Mode SS | |||
|---|---|---|---|
| Quadrant | BADHDUFLAG | Total packets | Discarded packets |
| A | 0 | 992 | 0 |
| B | 0 | 992 | 0 |
| C | 0 | 992 | 0 |
| D | 0 | 992 | 0 |
| Mode M9 | |||
|---|---|---|---|
| Quadrant | BADHDUFLAG | Total packets | Discarded packets |
| A | 0 | 73 | 0 |
| B | 0 | 73 | 0 |
| C | 0 | 73 | 0 |
| D | 0 | 74 | 0 |
| Mode M0 | |||
|---|---|---|---|
| Quadrant | BADHDUFLAG | Total packets | Discarded packets |
| A | 0 | 102330 | 0 |
| B | 0 | 158189 | 0 |
| C | 0 | 154790 | 0 |
| D | 0 | 123357 | 0 |
| Quadrant | Total seconds | Saturated seconds | Saturation percentage |
|---|---|---|---|
| A | 48737 | 500 | 1.025915% |
| B | 48737 | 1930 | 3.960030% |
| C | 48737 | 8087 | 16.593143% |
| D | 48737 | 925 | 1.897942% |
Noise dominated data is calculated using 1-second bins in cleaned event files. If a bin has >2000 counts, and if more than 50% of those come from <1% of pixels, then it is considered to be noise-dominated and hence unusable.
| Quadrant | # 1 sec bins | Bins with >0 counts | Bins with >2000 counts | High rate bins dominated by noise | Noise dominated (total time) | Noise dominated (detector-on time) | Marked lightcurve |
|---|---|---|---|---|---|---|---|
| A | 66688 | 48738 | 0 | 0 | 0.00% | 0.00% |  |
| B | 66688 | 48737 | 0 | 0 | 0.00% | 0.00% |  |
| C | 66688 | 48727 | 0 | 0 | 0.00% | 0.00% |  |
| D | 66688 | 48729 | 0 | 0 | 0.00% | 0.00% |  |
Top three noisy pixels from each quadrant. If the there are fewer than three noisy pixels in the level2.evt file, extra rows are filled as -1
| Pixel properties | Quadrant properties | ||||||
|---|---|---|---|---|---|---|---|
| Quadrant | DetID | PixID | Counts | Sigma | Mean | Median | Sigma |
| A | 0 | 29 | 2972 | 11.15 | 794 | 744 | 199.8 |
| A | 0 | 30 | 2334 | 7.96 | 794 | 744 | 199.8 |
| A | 7 | 110 | 2333 | 7.95 | 794 | 744 | 199.8 |
| B | 2 | 9 | 2333 | 10.74 | 753 | 717 | 150.5 |
| B | 5 | 232 | 1901 | 7.87 | 753 | 717 | 150.5 |
| B | 5 | 128 | 1897 | 7.84 | 753 | 717 | 150.5 |
| C | 1 | 80 | 2180 | 8.19 | 726 | 681 | 183.1 |
| C | 1 | 81 | 2117 | 7.84 | 726 | 681 | 183.1 |
| C | 9 | 209 | 1928 | 6.81 | 726 | 681 | 183.1 |
| D | 6 | 67 | 1832 | 5.87 | 741 | 675 | 197.1 |
| D | 3 | 14 | 1832 | 5.87 | 741 | 675 | 197.1 |
| D | 6 | 231 | 1823 | 5.82 | 741 | 675 | 197.1 |
Histogram calculated using DETX and DETY for each event in the final _common_clean file
| Quadrant A |  |
 |
Quadrant B |
|---|---|---|---|
| Quadrant D |  |
 |
Quadrant C |
| Plot type | Count rate plots | Images |
|---|---|---|
| Comparison with Poisson distribution Blue bars denote a histogram of data divided into 1 sec bins. Red curve is a Poisson curve with rate = median count rate of data. |
 |
 |
| Quadrant-wise count rates Data is divided into 100 sec bins |
 |
|
| Module-wise count rates for Quadrant A Data is divided into 100 sec bins |
 |
 |
| Module-wise count rates for Quadrant B Data is divided into 100 sec bins |
 |
 |
| Module-wise count rates for Quadrant C Data is divided into 100 sec bins |
 |
 |
| Module-wise count rates for Quadrant D Data is divided into 100 sec bins |
 |
 |
| Parameter | Plot |
|---|---|
| CZT HV Monitor |  |
| D_VDD | 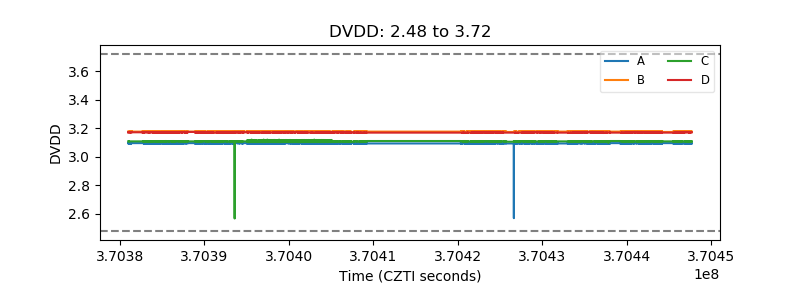 |
| Temperature 1 |  |
| Veto HV Monitor |  |
| Veto LLD |  |
| Alpha Counter |  |
| _CPM_Rate |  |
| CZT Counter |  |
| +2.5 Volts monitor |  |
| +5 Volts monitor |  |
| _ROLL_ROT |  |
| _Roll_DEC |  |
| _Roll_RA |  |
| Veto Counter |  |