| Param | Original file | Final file |
|---|---|---|
| Filename | modeM0/AS1A09_108T02_9000004706_32427cztM0_level2.evt | modeM0/AS1A09_108T02_9000004706_32427cztM0_level2_quad_clean.evt |
| Size (bytes) | 623,229,120 | 99,273,600 |
| Size | 594.4 MB | 94.7 MB |
| Events in quadrant A | 3,529,219 | 629,895 |
| Events in quadrant B | 6,208,361 | 650,701 |
| Events in quadrant C | 4,442,637 | 609,755 |
| Events in quadrant D | 4,199,403 | 606,937 |
| Mode SS | |||
|---|---|---|---|
| Quadrant | BADHDUFLAG | Total packets | Discarded packets |
| A | 0 | 150 | 0 |
| B | 0 | 150 | 0 |
| C | 0 | 150 | 0 |
| D | 0 | 150 | 0 |
| Mode M9 | |||
|---|---|---|---|
| Quadrant | BADHDUFLAG | Total packets | Discarded packets |
| A | 0 | 20 | 0 |
| B | 0 | 20 | 0 |
| C | 0 | 20 | 0 |
| D | 0 | 20 | 0 |
| Mode M0 | |||
|---|---|---|---|
| Quadrant | BADHDUFLAG | Total packets | Discarded packets |
| A | 0 | 15315 | 3 |
| B | 0 | 23477 | 2 |
| C | 0 | 17919 | 2 |
| D | 0 | 17518 | 2 |
| Quadrant | Total seconds | Saturated seconds | Saturation percentage |
|---|---|---|---|
| A | 7313 | 42 | 0.574320% |
| B | 7313 | 290 | 3.965541% |
| C | 7313 | 349 | 4.772323% |
| D | 7313 | 94 | 1.285382% |
Noise dominated data is calculated using 1-second bins in cleaned event files. If a bin has >2000 counts, and if more than 50% of those come from <1% of pixels, then it is considered to be noise-dominated and hence unusable.
| Quadrant | # 1 sec bins | Bins with >0 counts | Bins with >2000 counts | High rate bins dominated by noise | Noise dominated (total time) | Noise dominated (detector-on time) | Marked lightcurve |
|---|---|---|---|---|---|---|---|
| A | 9299 | 7316 | 0 | 0 | 0.00% | 0.00% |  |
| B | 9299 | 7316 | 7 | 7 | 0.08% | 0.10% |  |
| C | 9299 | 7316 | 69 | 69 | 0.74% | 0.94% |  |
| D | 9299 | 7316 | 26 | 26 | 0.28% | 0.36% |  |
Top three noisy pixels from each quadrant. If the there are fewer than three noisy pixels in the level2.evt file, extra rows are filled as -1
| Pixel properties | Quadrant properties | ||||||
|---|---|---|---|---|---|---|---|
| Quadrant | DetID | PixID | Counts | Sigma | Mean | Median | Sigma |
| A | 13 | 6 | 13604 | 69.57 | 910 | 893 | 182.7 |
| A | 13 | 254 | 12951 | 65.99 | 910 | 893 | 182.7 |
| A | 3 | 137 | 9340 | 46.23 | 910 | 893 | 182.7 |
| B | 6 | 159 | 1958970 | 11343.93 | 909 | 887 | 172.6 |
| B | 4 | 80 | 512253 | 2962.54 | 909 | 887 | 172.6 |
| B | 0 | 183 | 117335 | 674.63 | 909 | 887 | 172.6 |
| C | 3 | 233 | 477122 | 2321.0 | 871 | 875 | 205.2 |
| C | 0 | 10 | 331474 | 1611.18 | 871 | 875 | 205.2 |
| C | 14 | 238 | 143628 | 695.71 | 871 | 875 | 205.2 |
| D | 8 | 195 | 484943 | 2306.07 | 884 | 860 | 209.9 |
| D | 12 | 233 | 135014 | 639.08 | 884 | 860 | 209.9 |
| D | 2 | 250 | 112767 | 533.1 | 884 | 860 | 209.9 |
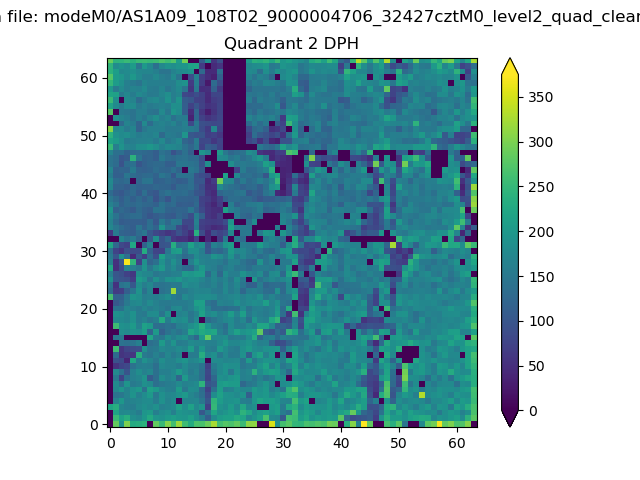
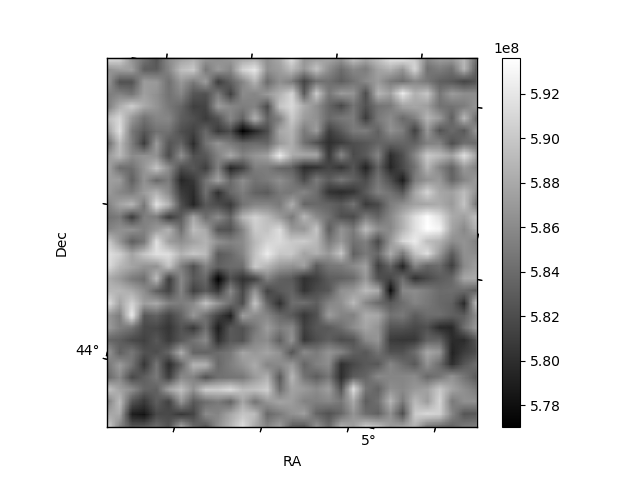
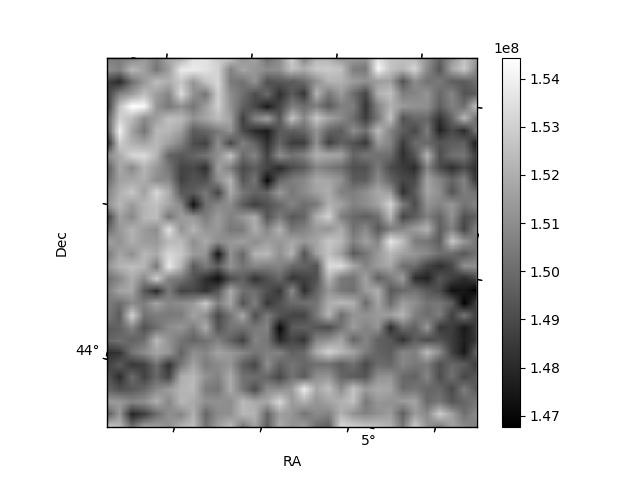
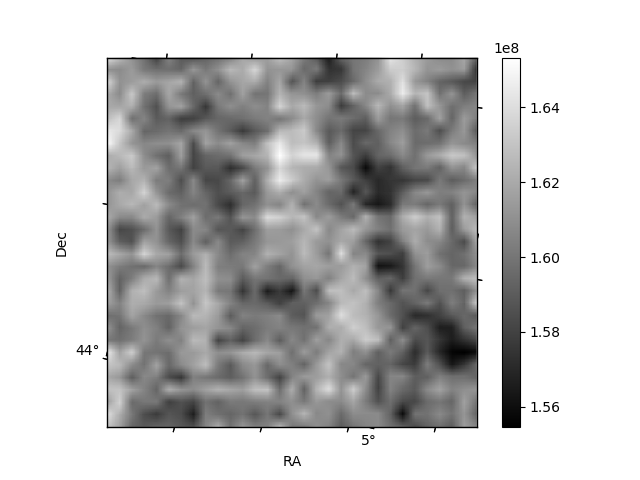
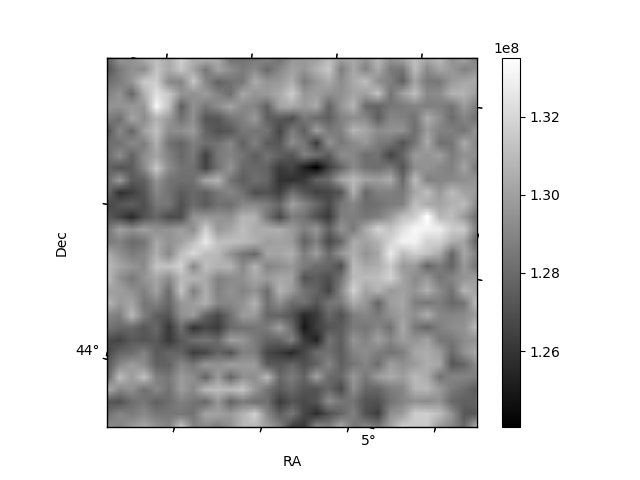
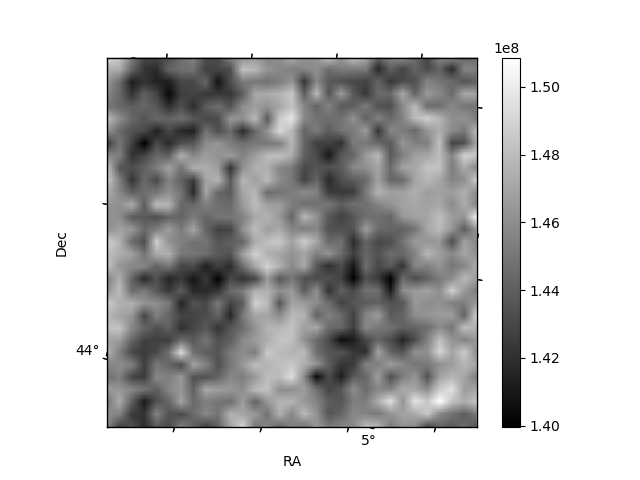
Histogram calculated using DETX and DETY for each event in the final _common_clean file
| Quadrant A | 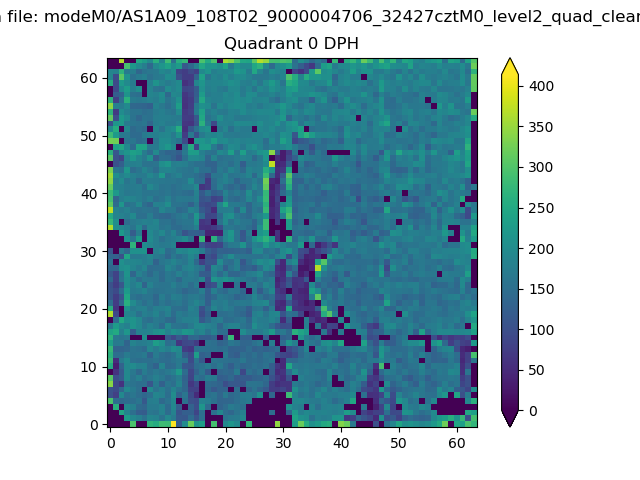 |
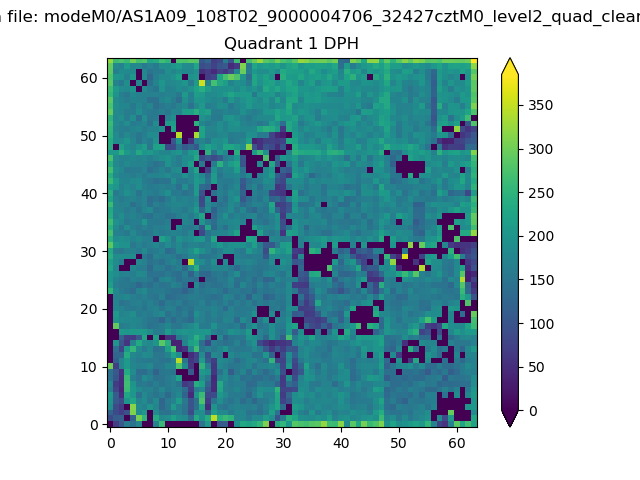 |
Quadrant B |
|---|---|---|---|
| Quadrant D | 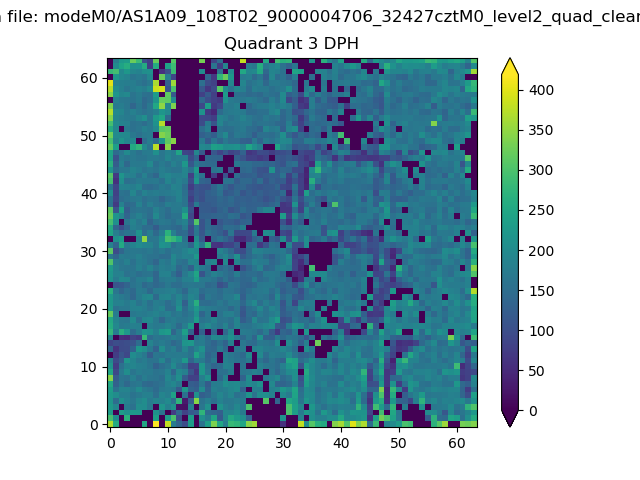 |
 |
Quadrant C |
| Plot type | Count rate plots | Images |
|---|---|---|
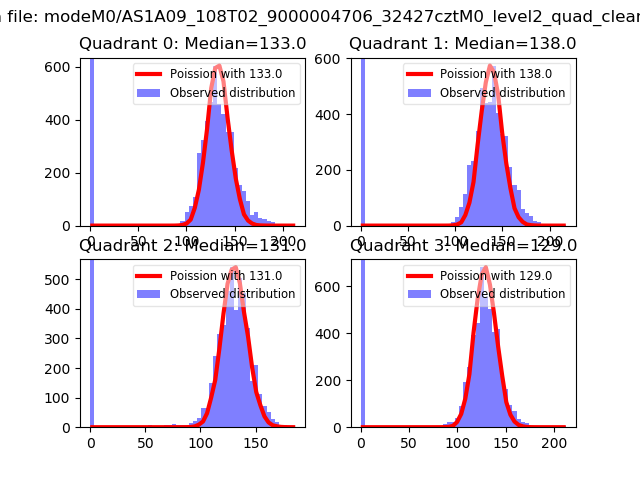
| Comparison with Poisson distribution Blue bars denote a histogram of data divided into 1 sec bins. Red curve is a Poisson curve with rate = median count rate of data. |
 |
 |
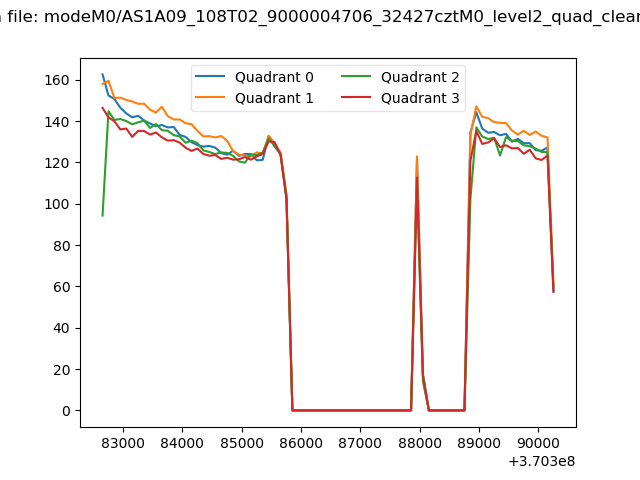
| Quadrant-wise count rates Data is divided into 100 sec bins |
 |
|
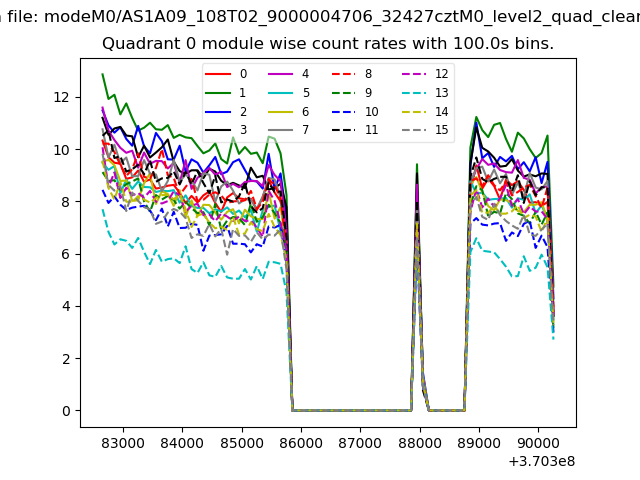
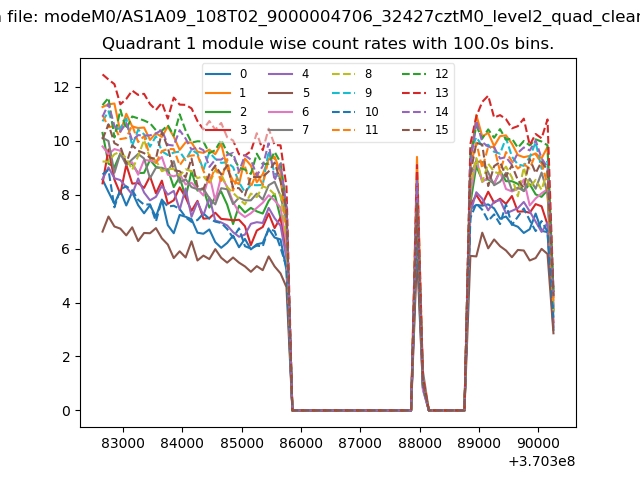
| Module-wise count rates for Quadrant A Data is divided into 100 sec bins |
 |
 |
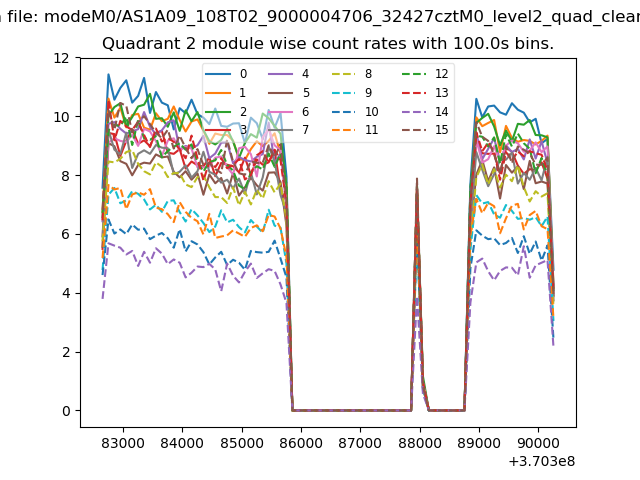
| Module-wise count rates for Quadrant B Data is divided into 100 sec bins |
 |
 |
| Module-wise count rates for Quadrant C Data is divided into 100 sec bins |
 |
 |
| Module-wise count rates for Quadrant D Data is divided into 100 sec bins |
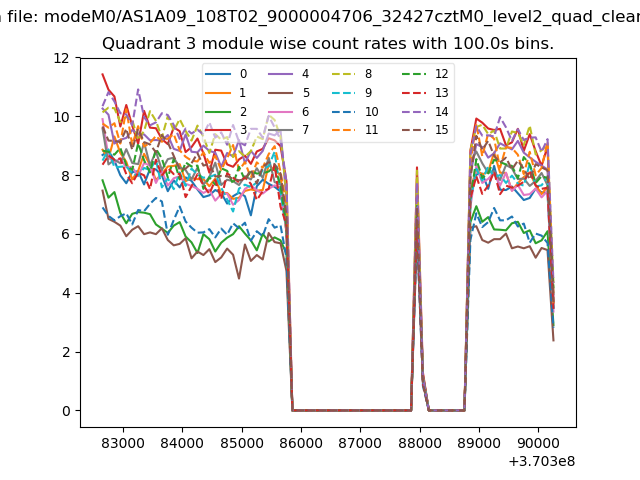 |
 |
| Parameter | Plot |
|---|---|
| CZT HV Monitor | 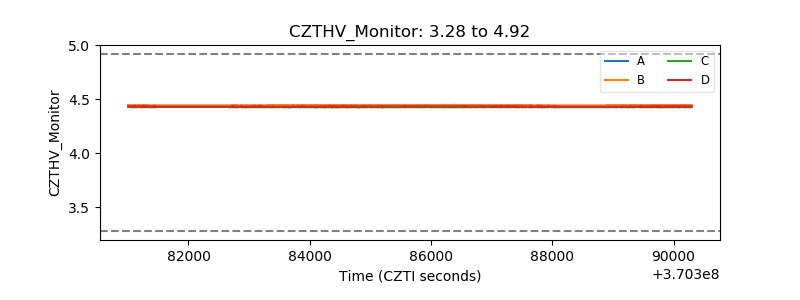 |
| D_VDD | 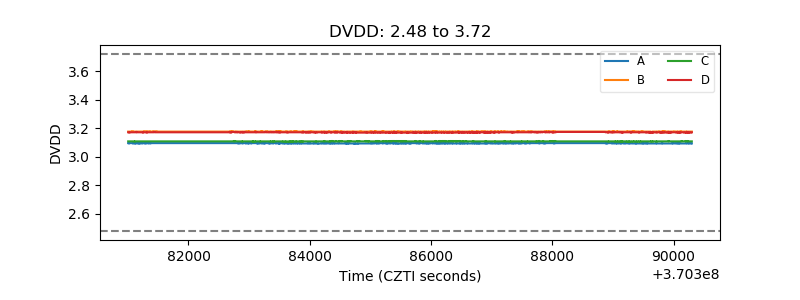 |
| Temperature 1 | 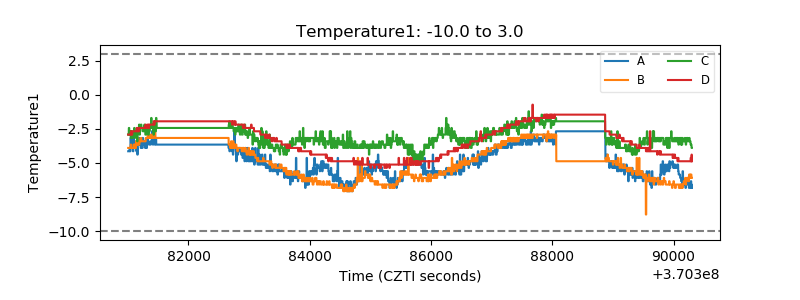 |
| Veto HV Monitor | 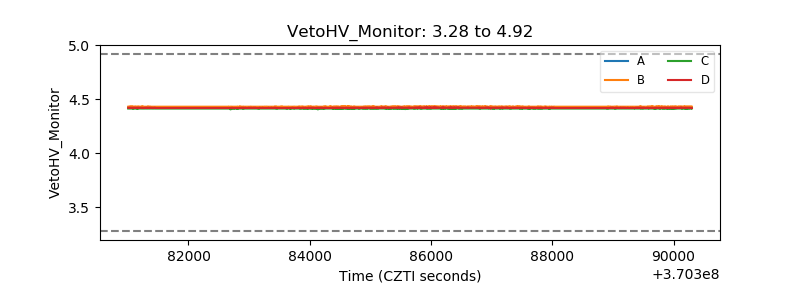 |
| Veto LLD | 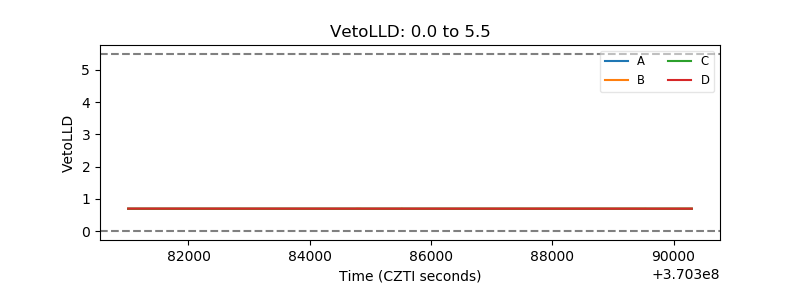 |
| Alpha Counter | 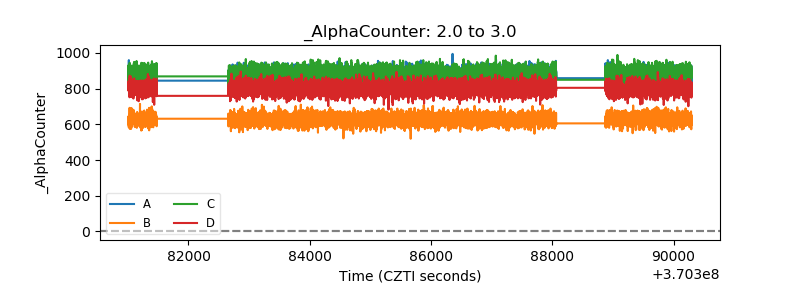 |
| _CPM_Rate | 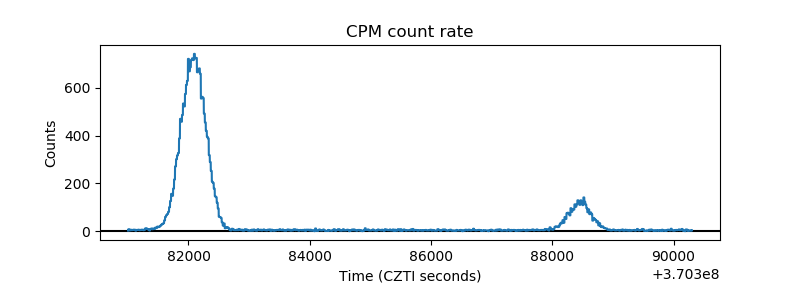 |
| CZT Counter | 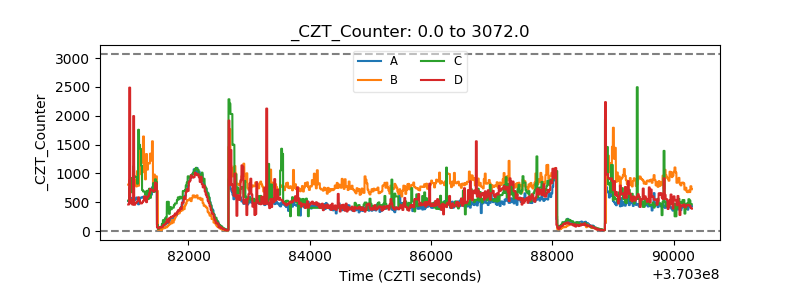 |
| +2.5 Volts monitor |  |
| +5 Volts monitor |  |
| _ROLL_ROT | 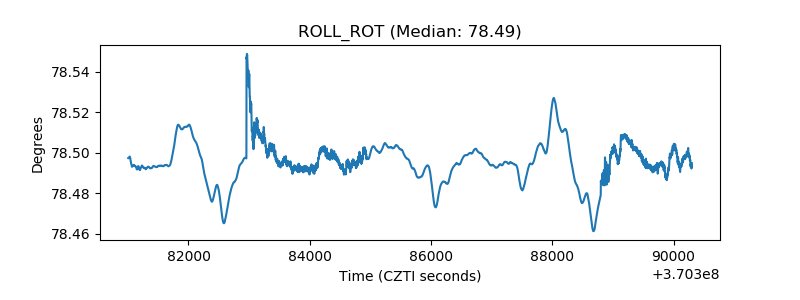 |
| _Roll_DEC | 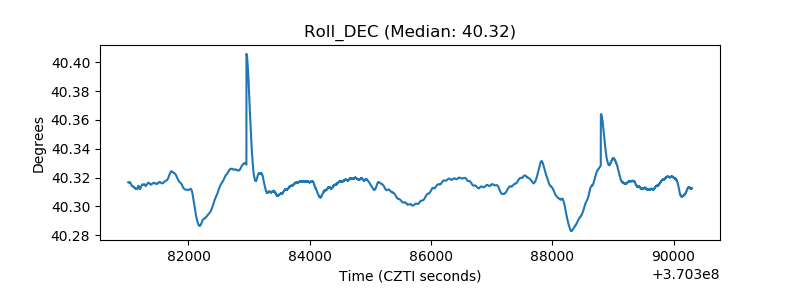 |
| _Roll_RA | 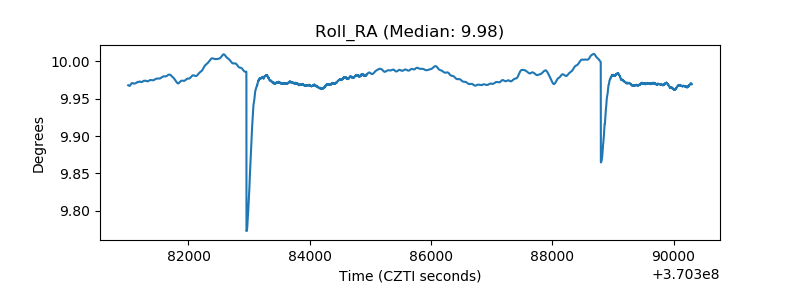 |
| Veto Counter | 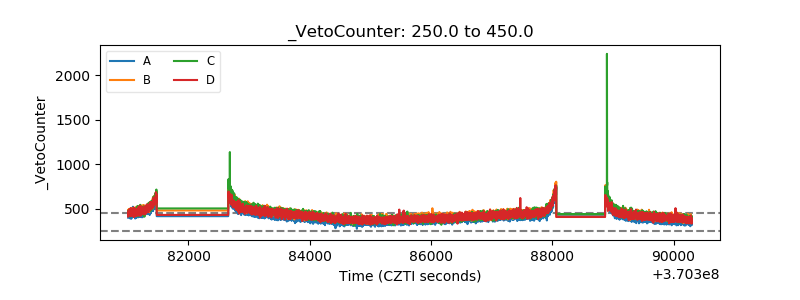 |