| Param | Original file | Final file |
|---|---|---|
| Filename | modeM0/AS1A09_108T02_9000004706_32428cztM0_level2.evt | modeM0/AS1A09_108T02_9000004706_32428cztM0_level2_quad_clean.evt |
| Size (bytes) | 646,323,840 | 106,980,480 |
| Size | 616.4 MB | 102.0 MB |
| Events in quadrant A | 3,496,799 | 689,707 |
| Events in quadrant B | 5,941,599 | 711,028 |
| Events in quadrant C | 5,172,539 | 665,473 |
| Events in quadrant D | 4,459,834 | 655,671 |
| Mode SS | |||
|---|---|---|---|
| Quadrant | BADHDUFLAG | Total packets | Discarded packets |
| A | 0 | 150 | 0 |
| B | 0 | 150 | 0 |
| C | 0 | 150 | 0 |
| D | 0 | 150 | 0 |
| Mode M9 | |||
|---|---|---|---|
| Quadrant | BADHDUFLAG | Total packets | Discarded packets |
| A | 0 | 12 | 0 |
| B | 0 | 12 | 0 |
| C | 0 | 12 | 0 |
| D | 0 | 12 | 0 |
| Mode M0 | |||
|---|---|---|---|
| Quadrant | BADHDUFLAG | Total packets | Discarded packets |
| A | 0 | 15469 | 3 |
| B | 0 | 23103 | 2 |
| C | 0 | 20388 | 2 |
| D | 0 | 18163 | 2 |
| Quadrant | Total seconds | Saturated seconds | Saturation percentage |
|---|---|---|---|
| A | 7450 | 58 | 0.778523% |
| B | 7450 | 197 | 2.644295% |
| C | 7450 | 376 | 5.046980% |
| D | 7450 | 178 | 2.389262% |
Noise dominated data is calculated using 1-second bins in cleaned event files. If a bin has >2000 counts, and if more than 50% of those come from <1% of pixels, then it is considered to be noise-dominated and hence unusable.
| Quadrant | # 1 sec bins | Bins with >0 counts | Bins with >2000 counts | High rate bins dominated by noise | Noise dominated (total time) | Noise dominated (detector-on time) | Marked lightcurve |
|---|---|---|---|---|---|---|---|
| A | 8575 | 7453 | 0 | 0 | 0.00% | 0.00% | 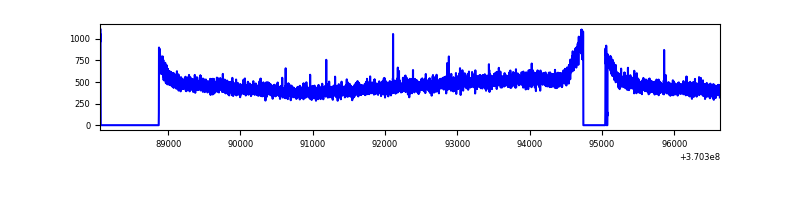 |
| B | 8575 | 7453 | 8 | 8 | 0.09% | 0.11% | 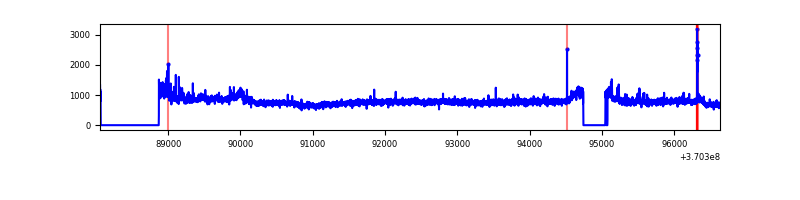 |
| C | 8575 | 7453 | 173 | 173 | 2.02% | 2.32% | 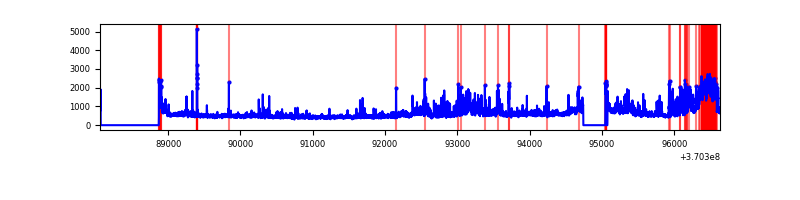 |
| D | 8575 | 7453 | 104 | 104 | 1.21% | 1.40% | 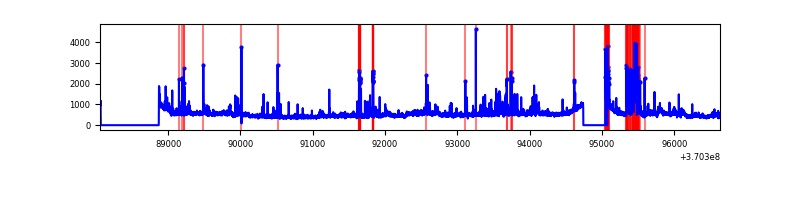 |
Top three noisy pixels from each quadrant. If the there are fewer than three noisy pixels in the level2.evt file, extra rows are filled as -1
| Pixel properties | Quadrant properties | ||||||
|---|---|---|---|---|---|---|---|
| Quadrant | DetID | PixID | Counts | Sigma | Mean | Median | Sigma |
| A | 13 | 254 | 13759 | 70.57 | 903 | 883 | 182.5 |
| A | 3 | 137 | 9468 | 47.05 | 903 | 883 | 182.5 |
| A | 13 | 6 | 8239 | 40.32 | 903 | 883 | 182.5 |
| B | 6 | 159 | 2085396 | 11991.12 | 903 | 878 | 173.8 |
| B | 4 | 80 | 134742 | 770.05 | 903 | 878 | 173.8 |
| B | 0 | 183 | 121164 | 691.94 | 903 | 878 | 173.8 |
| C | 3 | 233 | 1245796 | 6069.39 | 867 | 870 | 205.1 |
| C | 0 | 10 | 263815 | 1281.94 | 867 | 870 | 205.1 |
| C | 14 | 238 | 139361 | 675.19 | 867 | 870 | 205.1 |
| D | 8 | 195 | 482078 | 2297.82 | 872 | 846 | 209.4 |
| D | 1 | 47 | 220862 | 1050.55 | 872 | 846 | 209.4 |
| D | 12 | 218 | 182403 | 866.91 | 872 | 846 | 209.4 |
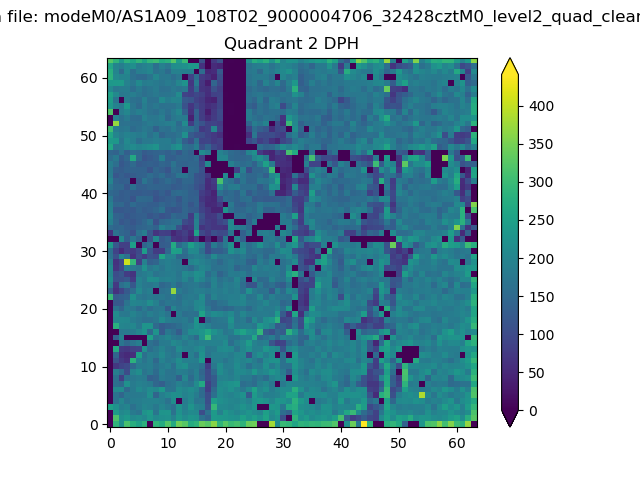
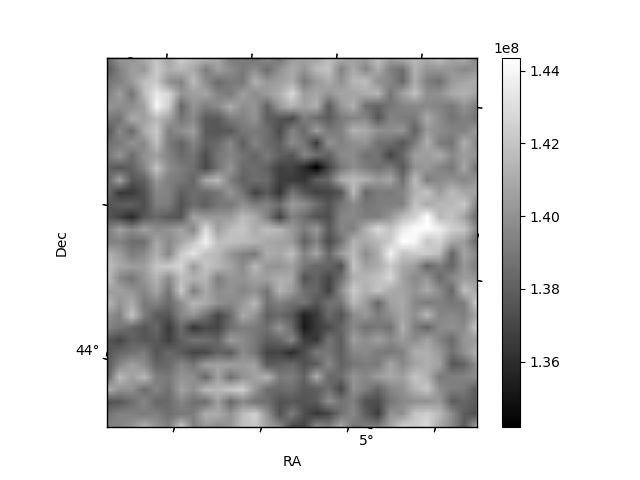
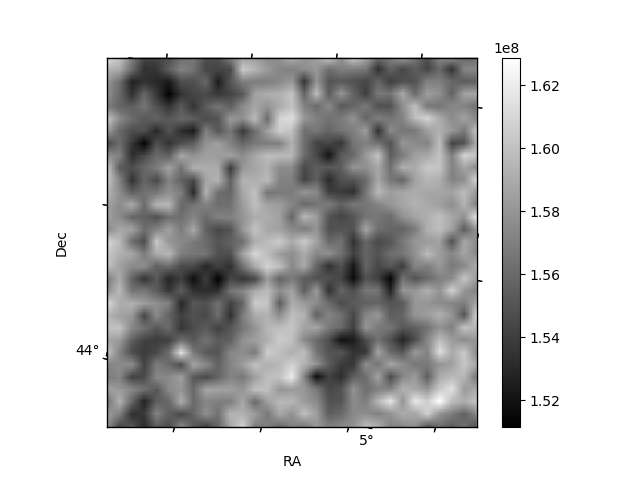
Histogram calculated using DETX and DETY for each event in the final _common_clean file
| Quadrant A | 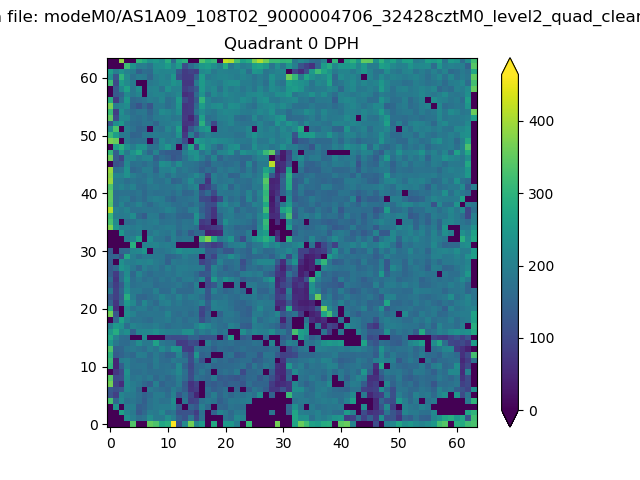 |
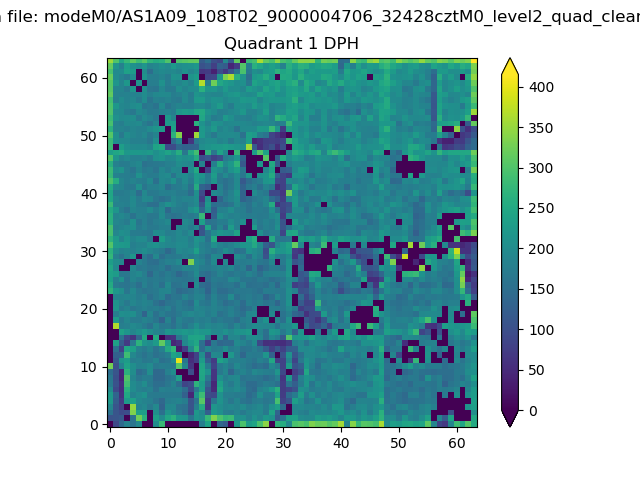 |
Quadrant B |
|---|---|---|---|
| Quadrant D | 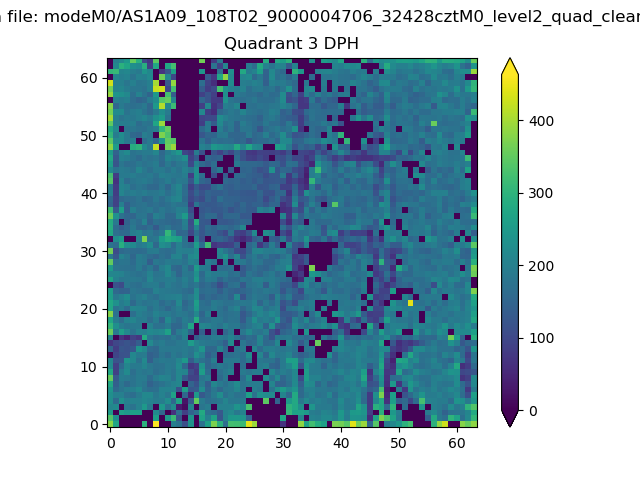 |
 |
Quadrant C |
| Plot type | Count rate plots | Images |
|---|---|---|
| Comparison with Poisson distribution Blue bars denote a histogram of data divided into 1 sec bins. Red curve is a Poisson curve with rate = median count rate of data. |
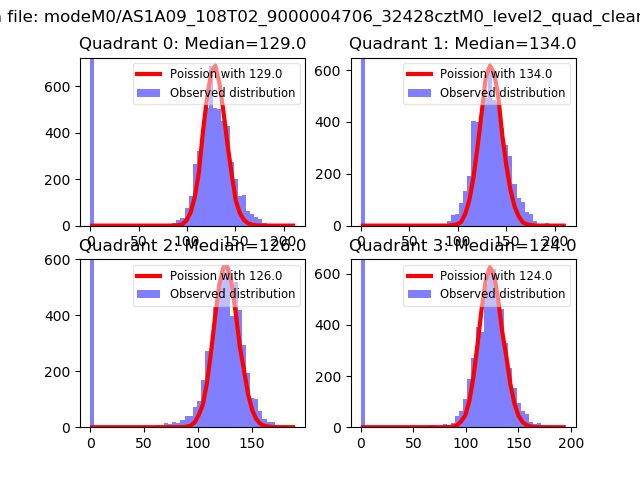 |
 |
| Quadrant-wise count rates Data is divided into 100 sec bins |
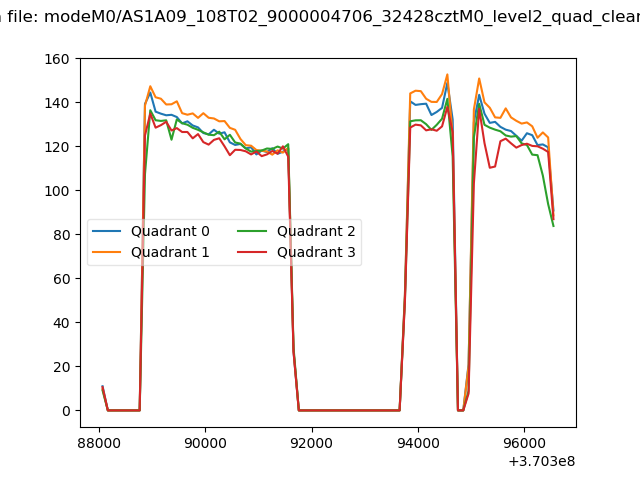 |
|
| Module-wise count rates for Quadrant A Data is divided into 100 sec bins |
 |
 |
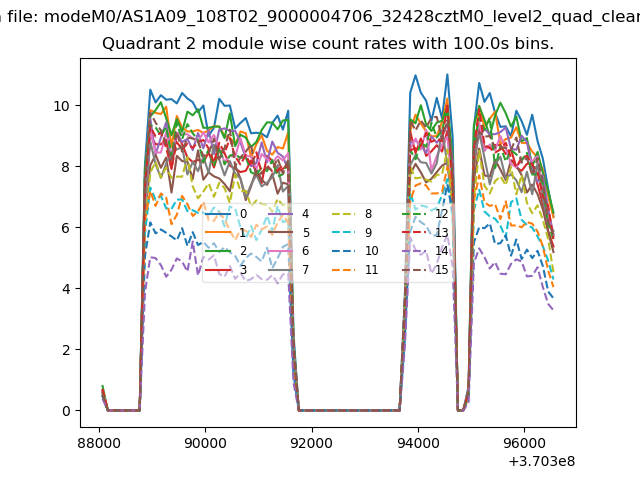
| Module-wise count rates for Quadrant B Data is divided into 100 sec bins |
 |
 |
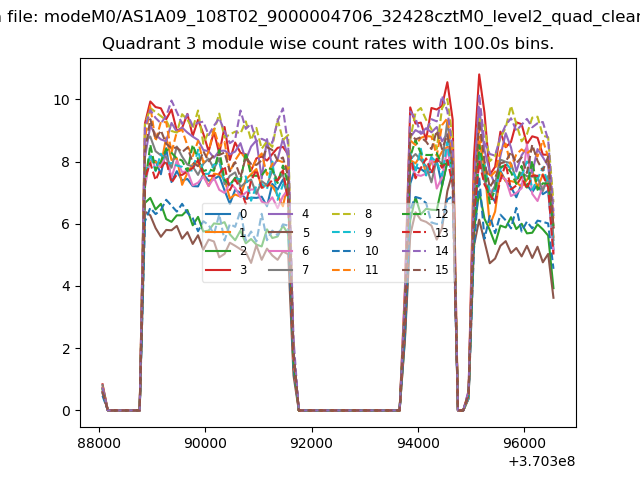
| Module-wise count rates for Quadrant C Data is divided into 100 sec bins |
 |
 |
| Module-wise count rates for Quadrant D Data is divided into 100 sec bins |
 |
 |
| Parameter | Plot |
|---|---|
| CZT HV Monitor | 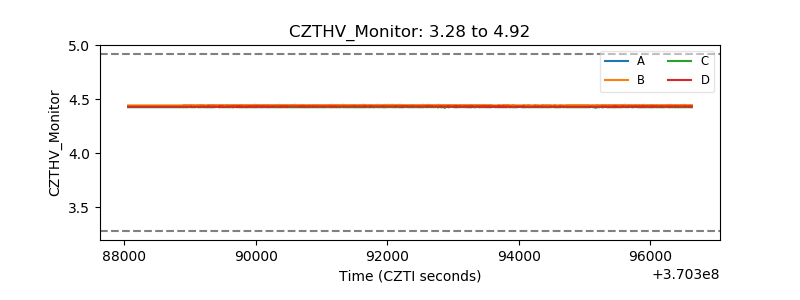 |
| D_VDD | 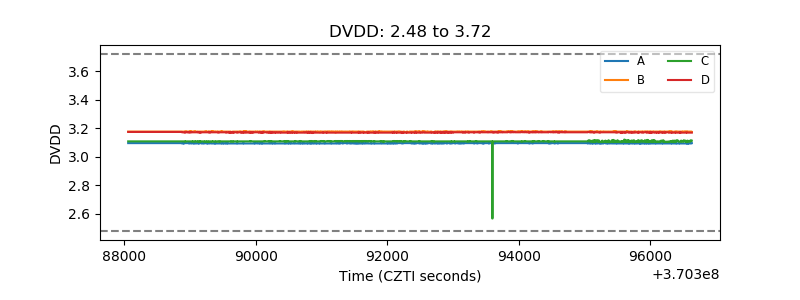 |
| Temperature 1 | 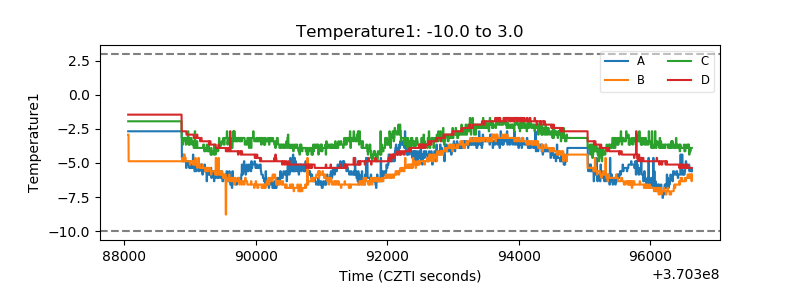 |
| Veto HV Monitor |  |
| Veto LLD | 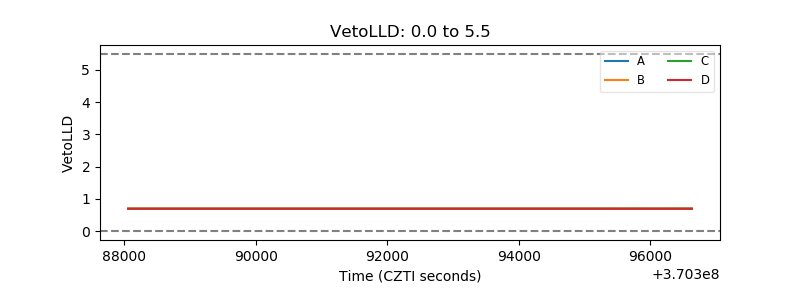 |
| Alpha Counter | 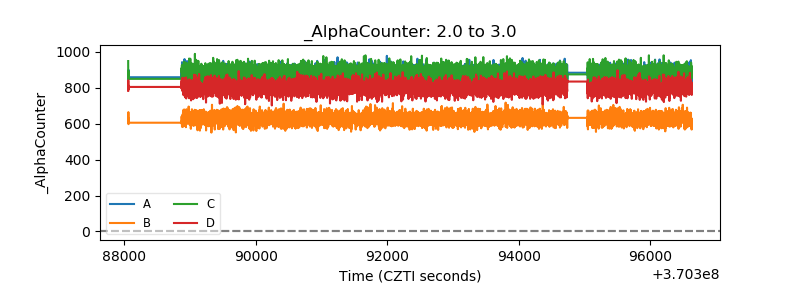 |
| _CPM_Rate | 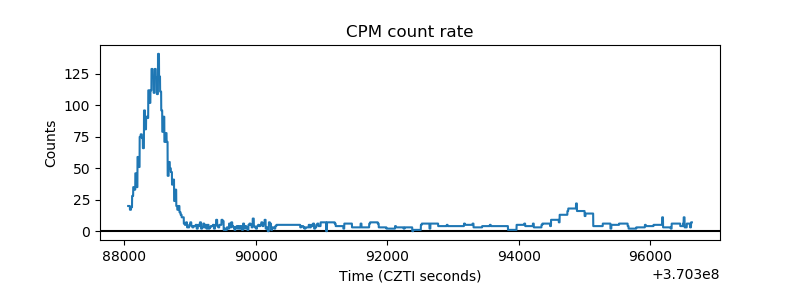 |
| CZT Counter | 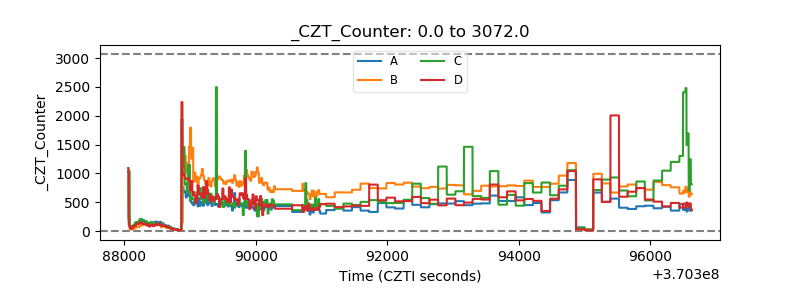 |
| +2.5 Volts monitor | 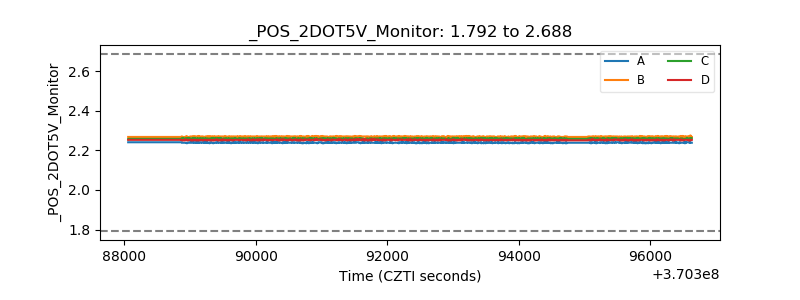 |
| +5 Volts monitor |  |
| _ROLL_ROT | 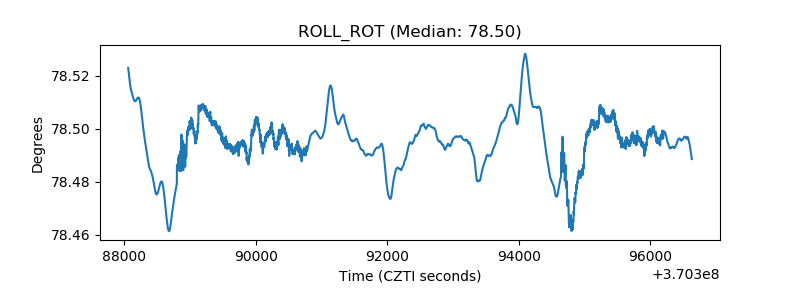 |
| _Roll_DEC | 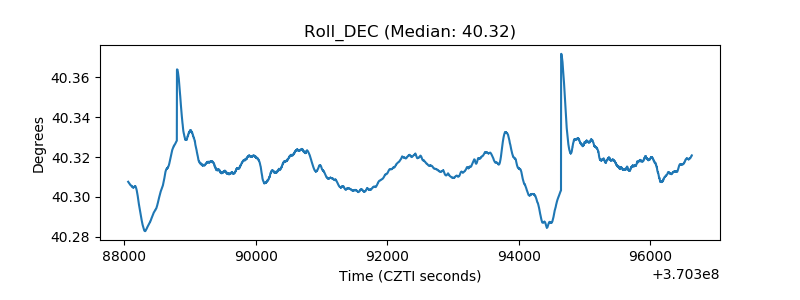 |
| _Roll_RA | 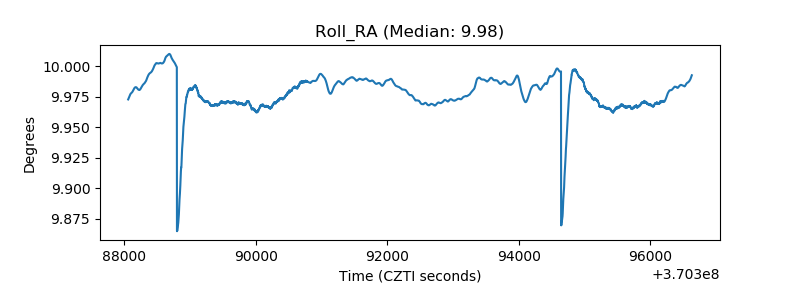 |
| Veto Counter | 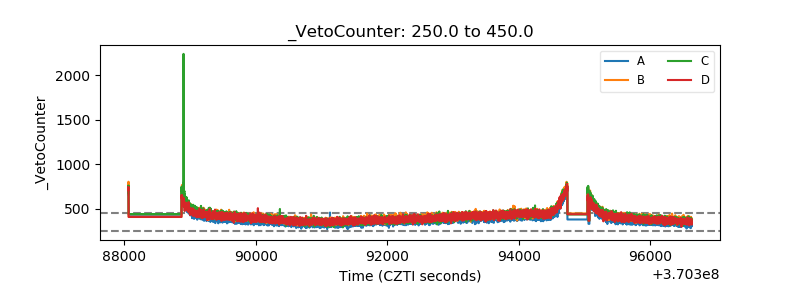 |