| Param | Original file | Final file |
|---|---|---|
| Filename | modeM0/AS1A09_108T02_9000004706_32429cztM0_level2.evt | modeM0/AS1A09_108T02_9000004706_32429cztM0_level2_quad_clean.evt |
| Size (bytes) | 766,431,360 | 116,107,200 |
| Size | 730.9 MB | 110.7 MB |
| Events in quadrant A | 3,801,433 | 759,712 |
| Events in quadrant B | 6,231,165 | 780,599 |
| Events in quadrant C | 7,922,779 | 693,959 |
| Events in quadrant D | 4,714,508 | 724,085 |
| Mode SS | |||
|---|---|---|---|
| Quadrant | BADHDUFLAG | Total packets | Discarded packets |
| A | 0 | 162 | 0 |
| B | 0 | 162 | 0 |
| C | 0 | 162 | 0 |
| D | 0 | 162 | 0 |
| Mode M9 | |||
|---|---|---|---|
| Quadrant | BADHDUFLAG | Total packets | Discarded packets |
| A | 0 | 4 | 0 |
| B | 0 | 4 | 0 |
| C | 0 | 4 | 0 |
| D | 0 | 4 | 0 |
| Mode M0 | |||
|---|---|---|---|
| Quadrant | BADHDUFLAG | Total packets | Discarded packets |
| A | 0 | 16791 | 2 |
| B | 0 | 24688 | 1 |
| C | 0 | 29081 | 1 |
| D | 0 | 19540 | 1 |
| Quadrant | Total seconds | Saturated seconds | Saturation percentage |
|---|---|---|---|
| A | 8017 | 131 | 1.634028% |
| B | 8017 | 378 | 4.714981% |
| C | 8017 | 1307 | 16.302856% |
| D | 8017 | 159 | 1.983286% |
Noise dominated data is calculated using 1-second bins in cleaned event files. If a bin has >2000 counts, and if more than 50% of those come from <1% of pixels, then it is considered to be noise-dominated and hence unusable.
| Quadrant | # 1 sec bins | Bins with >0 counts | Bins with >2000 counts | High rate bins dominated by noise | Noise dominated (total time) | Noise dominated (detector-on time) | Marked lightcurve |
|---|---|---|---|---|---|---|---|
| A | 8337 | 8019 | 0 | 0 | 0.00% | 0.00% | 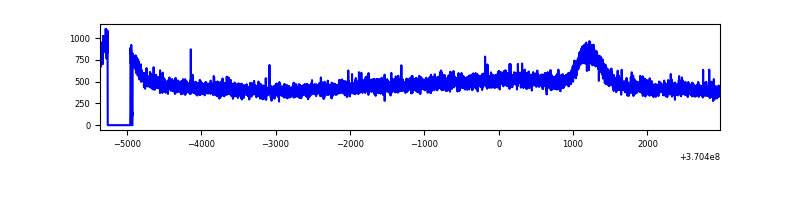 |
| B | 8337 | 8019 | 11 | 11 | 0.13% | 0.14% | 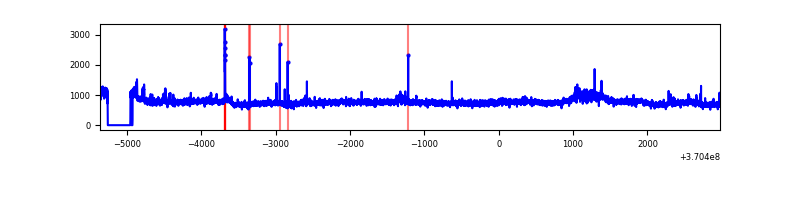 |
| C | 8337 | 8019 | 503 | 503 | 6.03% | 6.27% | 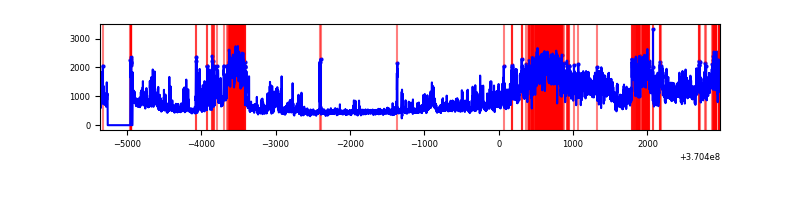 |
| D | 8337 | 8019 | 82 | 82 | 0.98% | 1.02% | 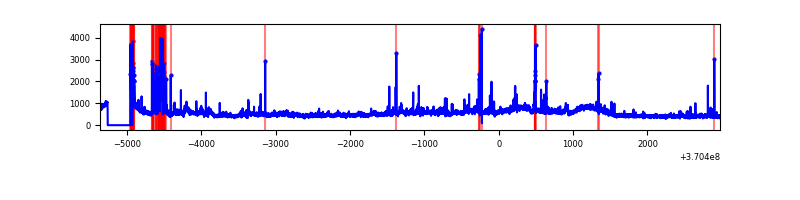 |
Top three noisy pixels from each quadrant. If the there are fewer than three noisy pixels in the level2.evt file, extra rows are filled as -1
| Pixel properties | Quadrant properties | ||||||
|---|---|---|---|---|---|---|---|
| Quadrant | DetID | PixID | Counts | Sigma | Mean | Median | Sigma |
| A | 13 | 254 | 13423 | 62.75 | 983 | 961 | 198.6 |
| A | 3 | 137 | 10409 | 47.57 | 983 | 961 | 198.6 |
| A | 0 | 226 | 8170 | 36.3 | 983 | 961 | 198.6 |
| B | 6 | 159 | 2230056 | 11697.67 | 979 | 951 | 190.6 |
| B | 4 | 80 | 84618 | 439.06 | 979 | 951 | 190.6 |
| B | 0 | 190 | 32107 | 163.49 | 979 | 951 | 190.6 |
| C | 3 | 233 | 3895105 | 18051.73 | 914 | 920 | 215.7 |
| C | 14 | 238 | 150159 | 691.81 | 914 | 920 | 215.7 |
| C | 0 | 10 | 148911 | 686.02 | 914 | 920 | 215.7 |
| D | 8 | 195 | 660575 | 2917.21 | 950 | 925 | 226.1 |
| D | 1 | 47 | 187742 | 826.17 | 950 | 925 | 226.1 |
| D | 2 | 250 | 101547 | 444.99 | 950 | 925 | 226.1 |
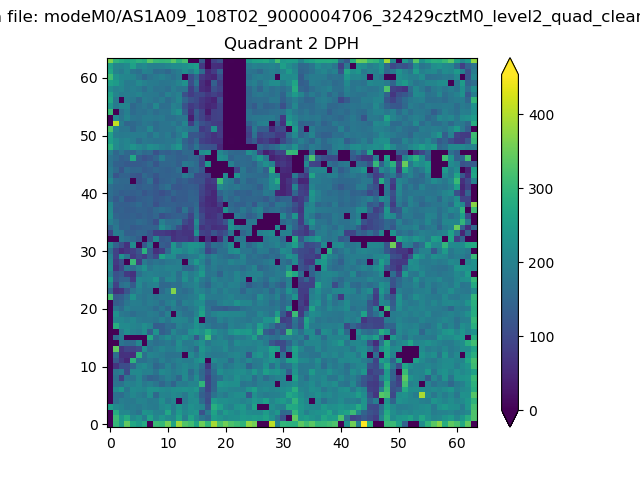
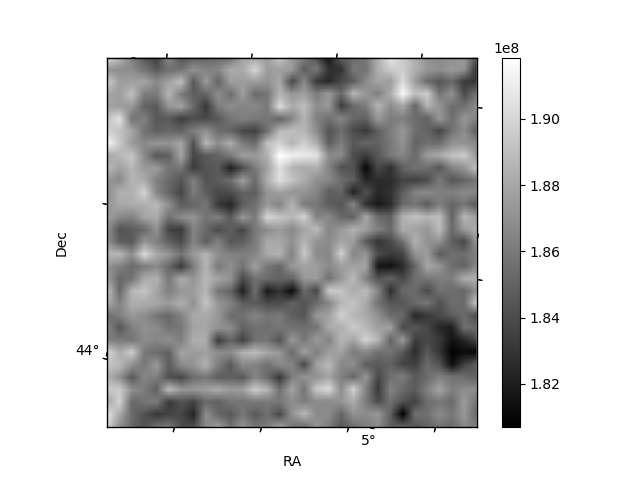
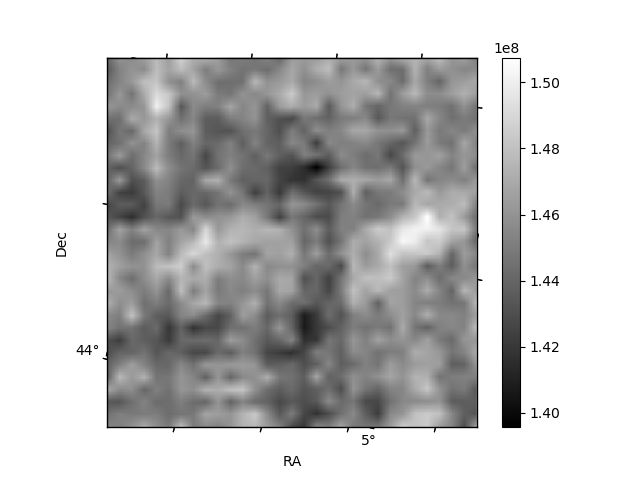
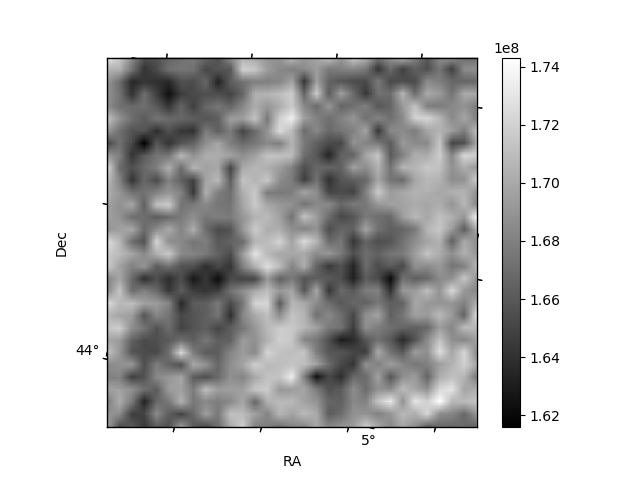
Histogram calculated using DETX and DETY for each event in the final _common_clean file
| Quadrant A | 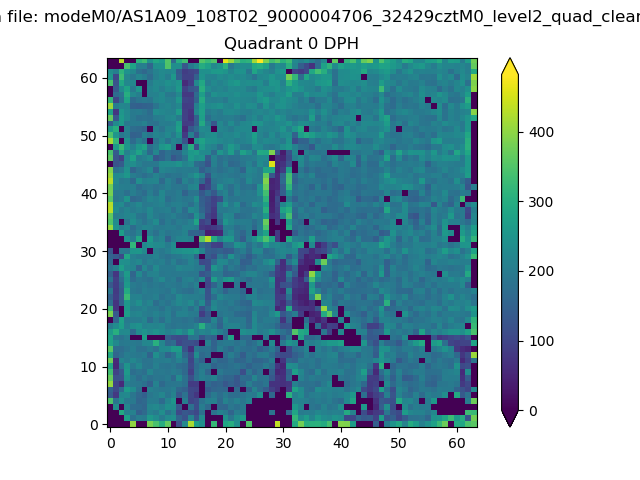 |
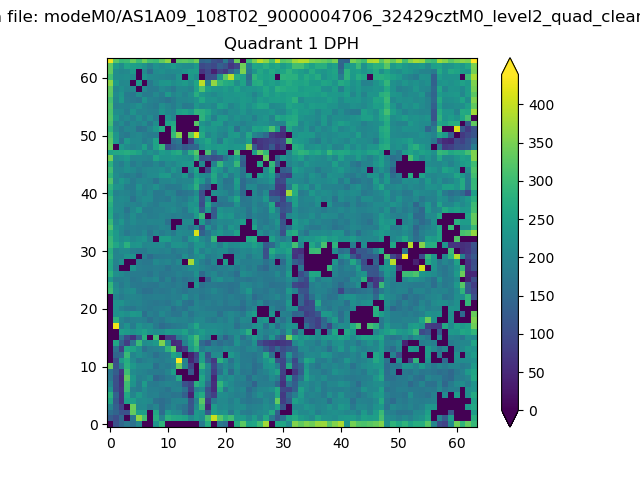 |
Quadrant B |
|---|---|---|---|
| Quadrant D | 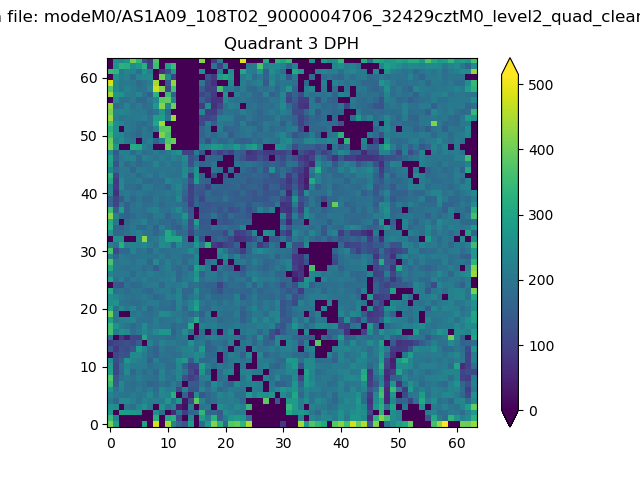 |
 |
Quadrant C |
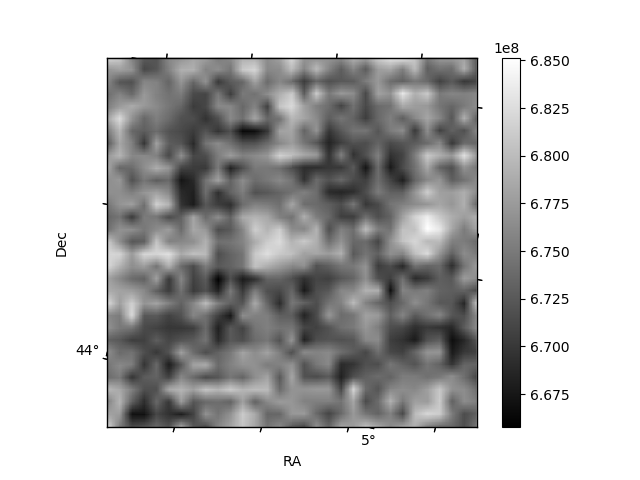
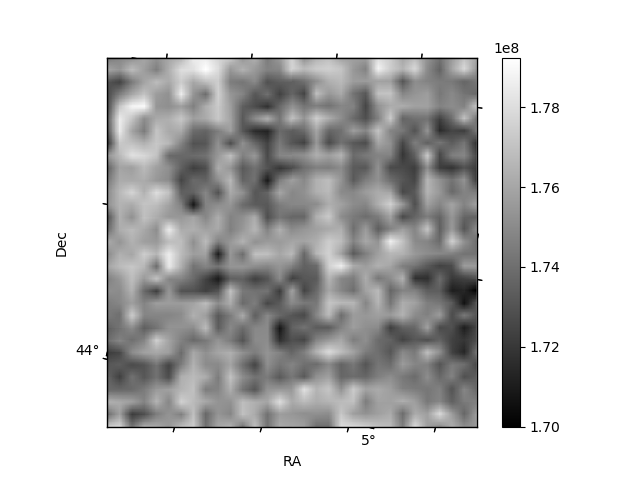
| Plot type | Count rate plots | Images |
|---|---|---|
| Comparison with Poisson distribution Blue bars denote a histogram of data divided into 1 sec bins. Red curve is a Poisson curve with rate = median count rate of data. |
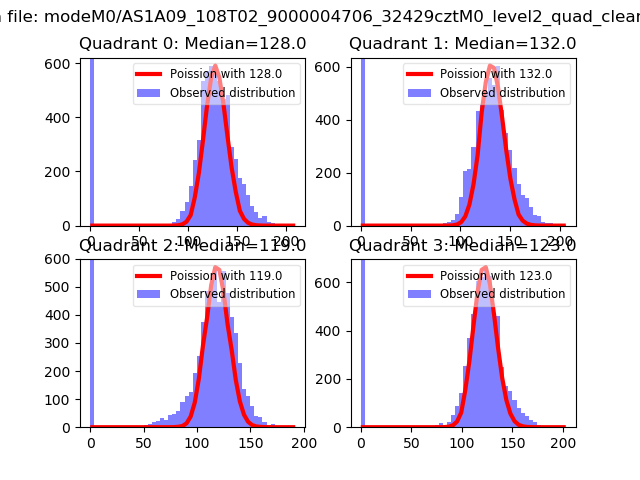 |
 |
| Quadrant-wise count rates Data is divided into 100 sec bins |
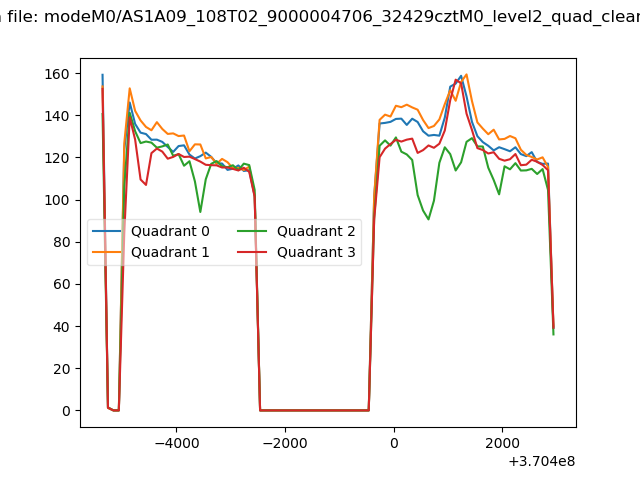 |
|
| Module-wise count rates for Quadrant A Data is divided into 100 sec bins |
 |
 |
| Module-wise count rates for Quadrant B Data is divided into 100 sec bins |
 |
 |
| Module-wise count rates for Quadrant C Data is divided into 100 sec bins |
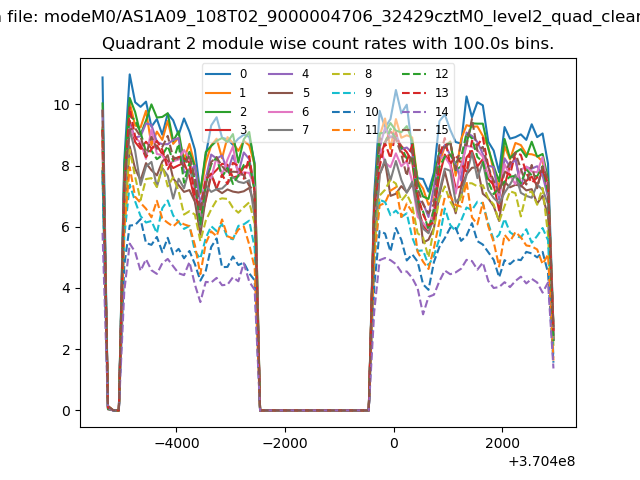 |
 |
| Module-wise count rates for Quadrant D Data is divided into 100 sec bins |
 |
 |
| Parameter | Plot |
|---|---|
| CZT HV Monitor | 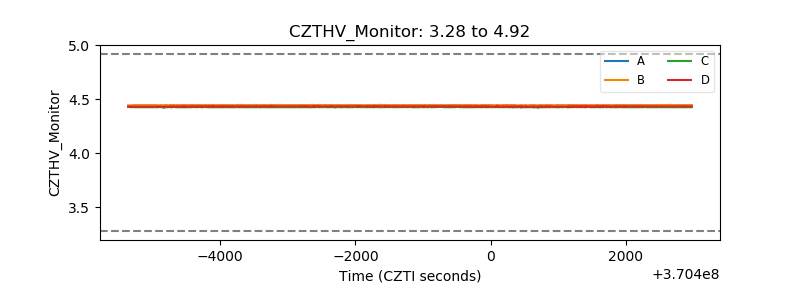 |
| D_VDD | 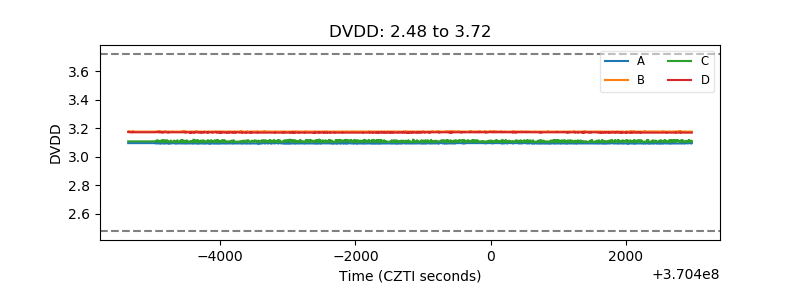 |
| Temperature 1 | 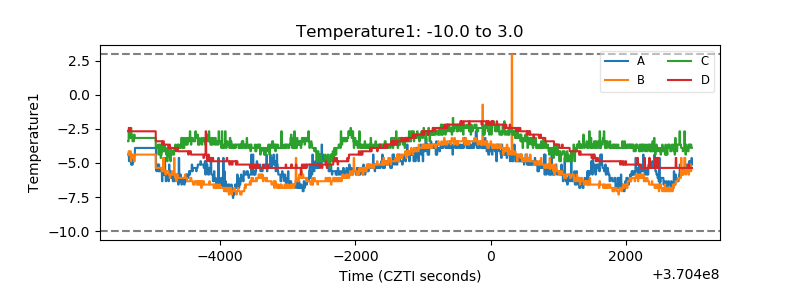 |
| Veto HV Monitor | 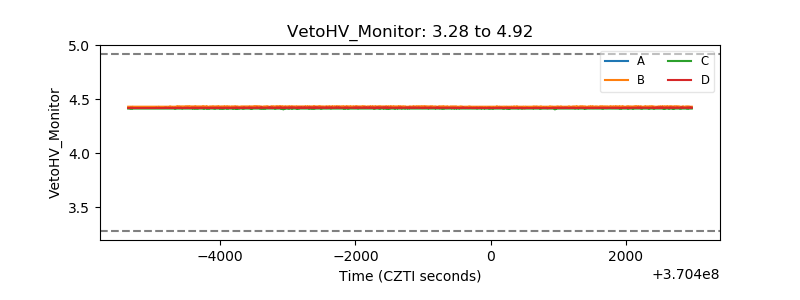 |
| Veto LLD | 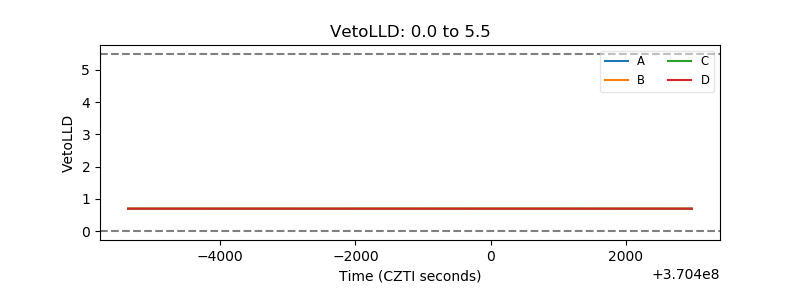 |
| Alpha Counter | 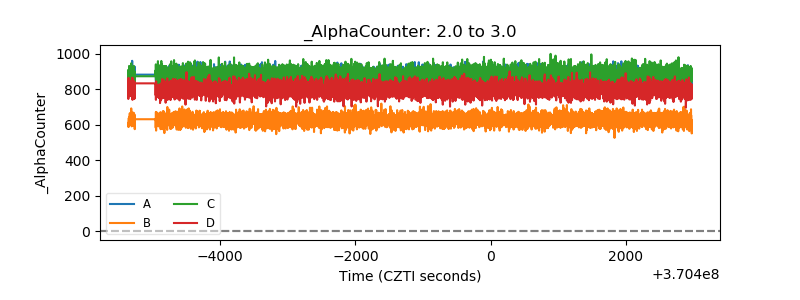 |
| _CPM_Rate | 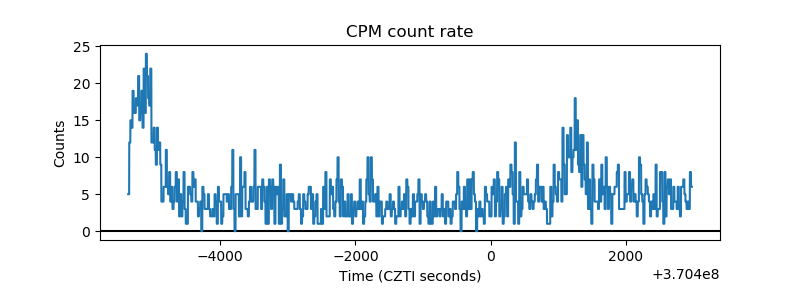 |
| CZT Counter | 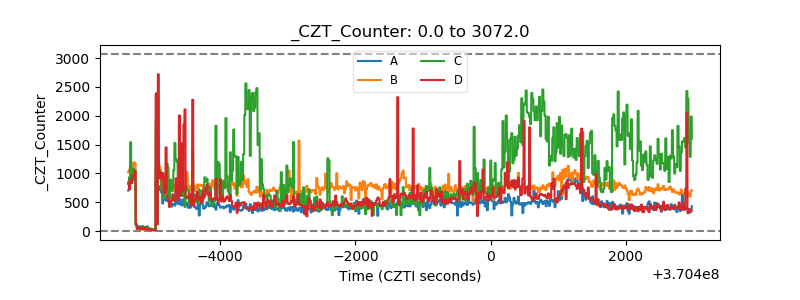 |
| +2.5 Volts monitor | 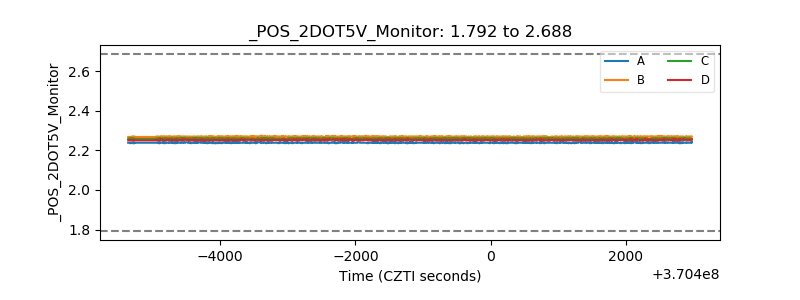 |
| +5 Volts monitor |  |
| _ROLL_ROT | 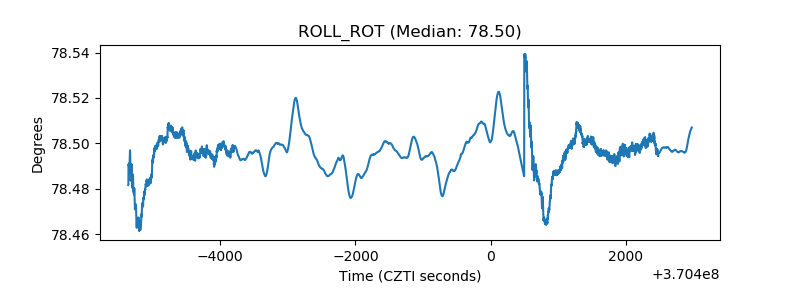 |
| _Roll_DEC | 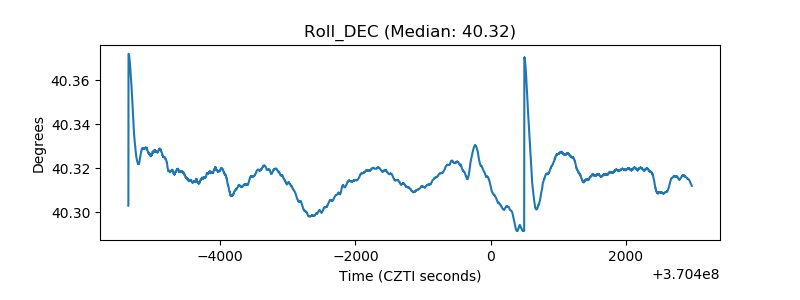 |
| _Roll_RA | 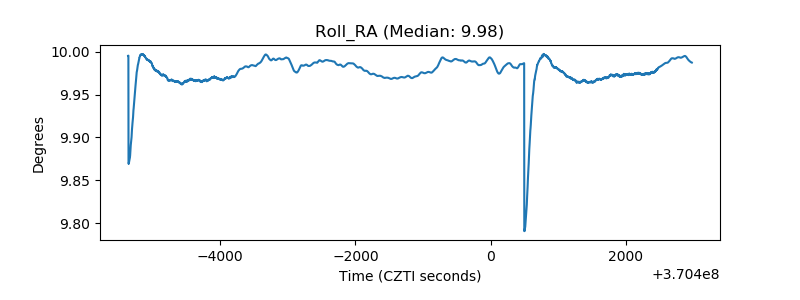 |
| Veto Counter | 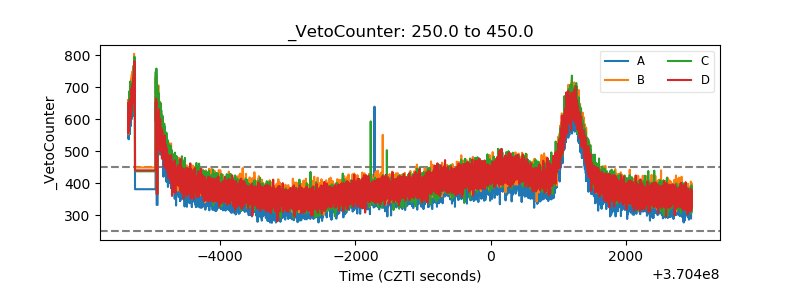 |