| Param | Original file | Final file |
|---|---|---|
| Filename | modeM0/AS1A09_108T02_9000004706_32430cztM0_level2.evt | modeM0/AS1A09_108T02_9000004706_32430cztM0_level2_quad_clean.evt |
| Size (bytes) | 1,010,160,000 | 110,318,400 |
| Size | 963.4 MB | 105.2 MB |
| Events in quadrant A | 3,777,510 | 747,150 |
| Events in quadrant B | 6,092,391 | 766,975 |
| Events in quadrant C | 15,677,299 | 546,032 |
| Events in quadrant D | 4,504,432 | 721,644 |
| Mode SS | |||
|---|---|---|---|
| Quadrant | BADHDUFLAG | Total packets | Discarded packets |
| A | 0 | 162 | 0 |
| B | 0 | 162 | 0 |
| C | 0 | 162 | 0 |
| D | 0 | 162 | 0 |
| Mode M9 | |||
|---|---|---|---|
| Quadrant | BADHDUFLAG | Total packets | Discarded packets |
| A | 0 | 3 | 0 |
| B | 0 | 3 | 0 |
| C | 0 | 3 | 0 |
| D | 0 | 3 | 0 |
| Mode M0 | |||
|---|---|---|---|
| Quadrant | BADHDUFLAG | Total packets | Discarded packets |
| A | 0 | 16736 | 2 |
| B | 0 | 24552 | 1 |
| C | 0 | 52059 | 1 |
| D | 0 | 19200 | 1 |
| Quadrant | Total seconds | Saturated seconds | Saturation percentage |
|---|---|---|---|
| A | 8019 | 176 | 2.194787% |
| B | 8019 | 412 | 5.137798% |
| C | 8019 | 5401 | 67.352538% |
| D | 8019 | 123 | 1.533857% |
Noise dominated data is calculated using 1-second bins in cleaned event files. If a bin has >2000 counts, and if more than 50% of those come from <1% of pixels, then it is considered to be noise-dominated and hence unusable.
| Quadrant | # 1 sec bins | Bins with >0 counts | Bins with >2000 counts | High rate bins dominated by noise | Noise dominated (total time) | Noise dominated (detector-on time) | Marked lightcurve |
|---|---|---|---|---|---|---|---|
| A | 8269 | 8020 | 0 | 0 | 0.00% | 0.00% | 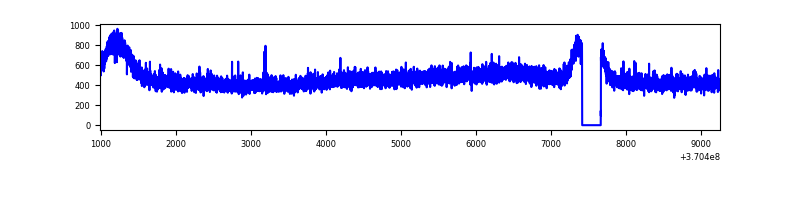 |
| B | 8269 | 8020 | 1 | 1 | 0.01% | 0.01% | 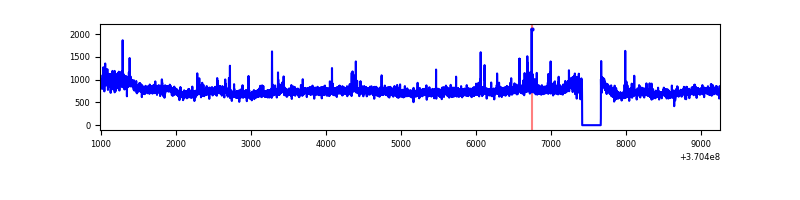 |
| C | 8269 | 8020 | 4345 | 4345 | 52.55% | 54.18% | 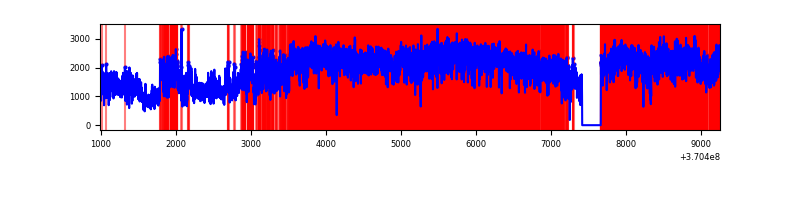 |
| D | 8269 | 8020 | 30 | 30 | 0.36% | 0.37% | 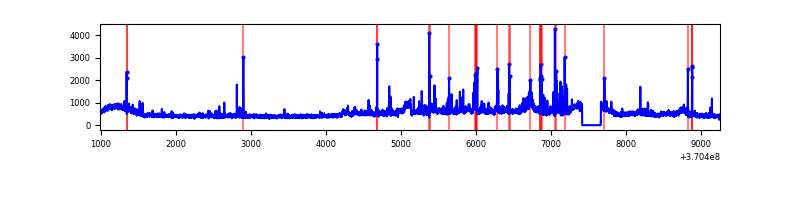 |
Top three noisy pixels from each quadrant. If the there are fewer than three noisy pixels in the level2.evt file, extra rows are filled as -1
| Pixel properties | Quadrant properties | ||||||
|---|---|---|---|---|---|---|---|
| Quadrant | DetID | PixID | Counts | Sigma | Mean | Median | Sigma |
| A | 13 | 254 | 13985 | 66.08 | 976 | 956 | 197.2 |
| A | 3 | 137 | 10502 | 48.41 | 976 | 956 | 197.2 |
| A | 0 | 226 | 8083 | 36.14 | 976 | 956 | 197.2 |
| B | 6 | 159 | 2159652 | 11424.82 | 972 | 944 | 188.9 |
| B | 4 | 80 | 72055 | 376.35 | 972 | 944 | 188.9 |
| B | 12 | 111 | 24263 | 123.41 | 972 | 944 | 188.9 |
| C | 3 | 233 | 12331101 | 71169.27 | 739 | 743 | 173.3 |
| C | 0 | 10 | 195261 | 1122.73 | 739 | 743 | 173.3 |
| C | 14 | 238 | 124872 | 716.46 | 739 | 743 | 173.3 |
| D | 8 | 195 | 596554 | 2612.99 | 948 | 922 | 228.0 |
| D | 2 | 250 | 135789 | 591.65 | 948 | 922 | 228.0 |
| D | 6 | 239 | 77253 | 334.86 | 948 | 922 | 228.0 |
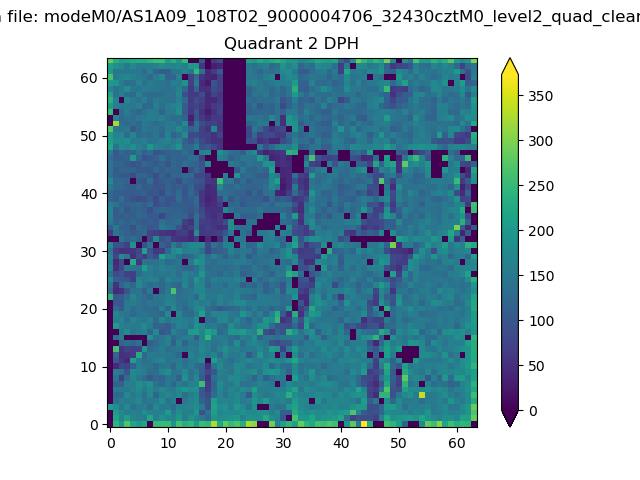
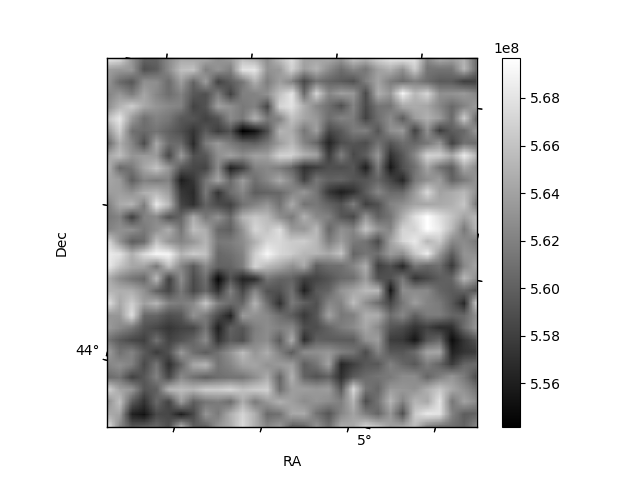
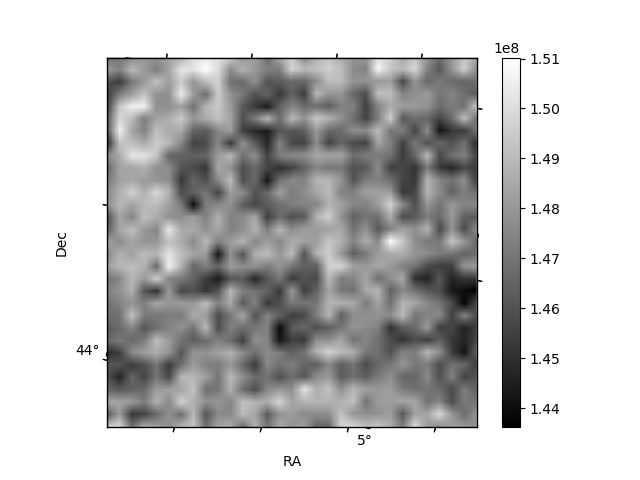
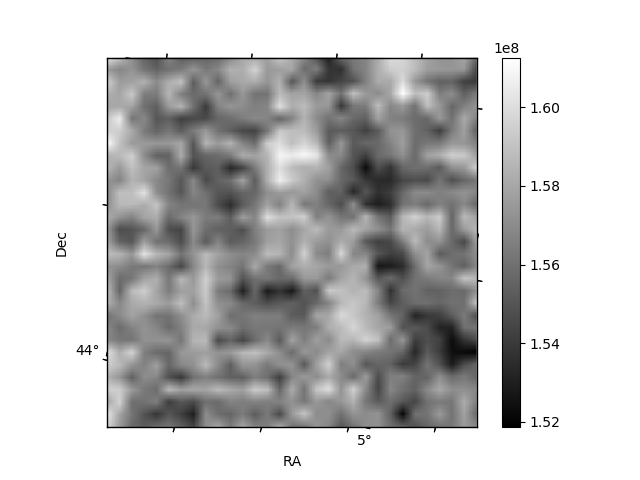
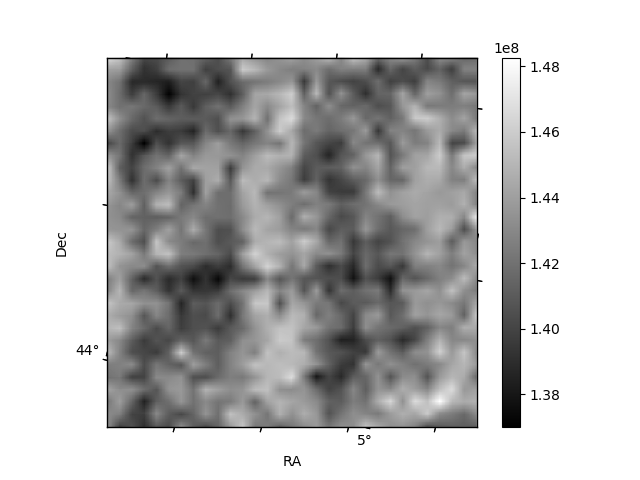
Histogram calculated using DETX and DETY for each event in the final _common_clean file
| Quadrant A | 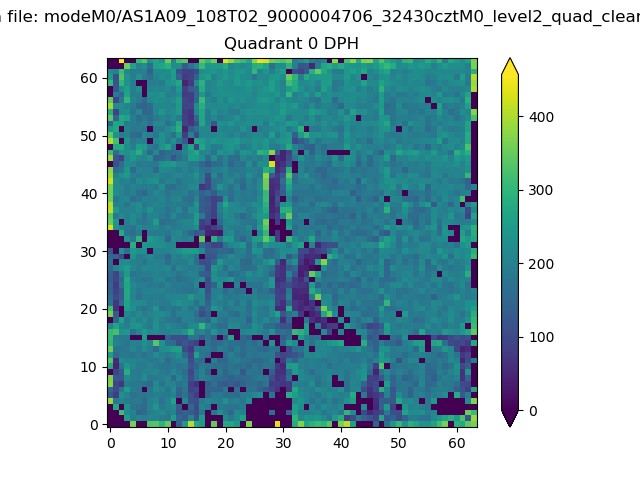 |
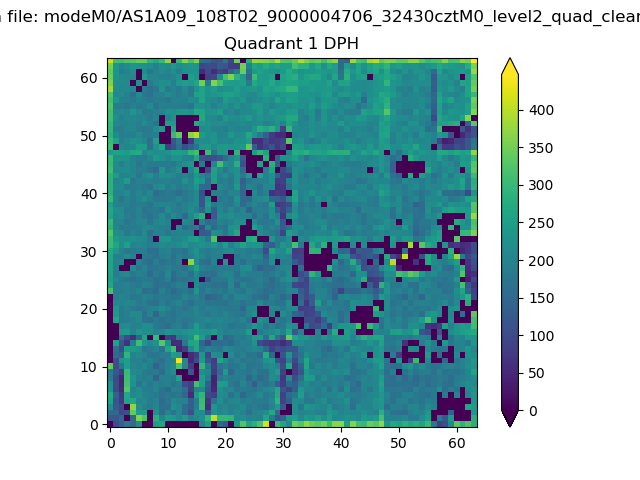 |
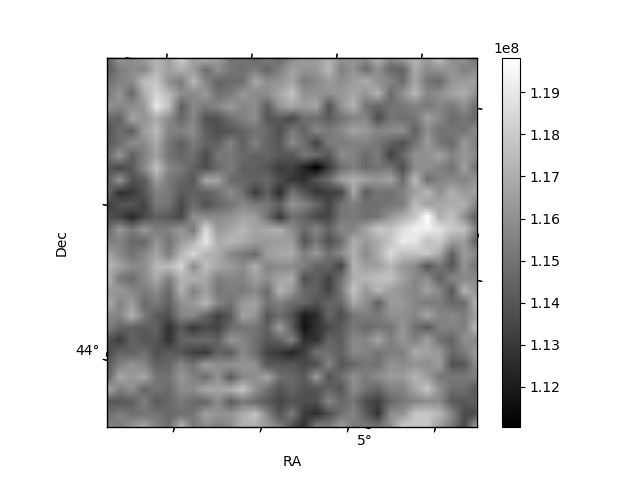
Quadrant B |
|---|---|---|---|
| Quadrant D | 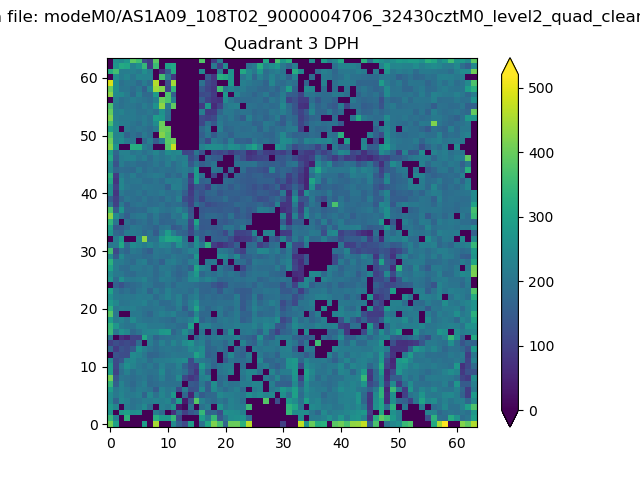 |
 |
Quadrant C |
| Plot type | Count rate plots | Images |
|---|---|---|
| Comparison with Poisson distribution Blue bars denote a histogram of data divided into 1 sec bins. Red curve is a Poisson curve with rate = median count rate of data. |
 |
 |
| Quadrant-wise count rates Data is divided into 100 sec bins |
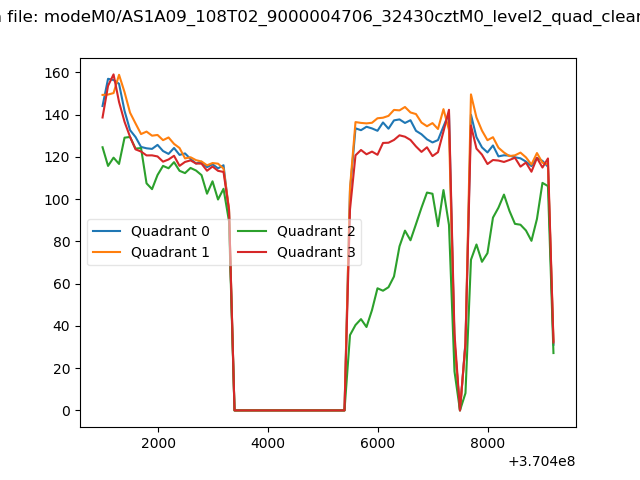 |
|
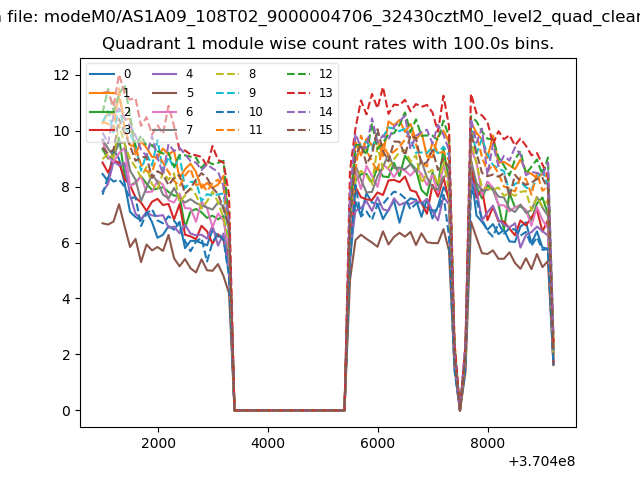
| Module-wise count rates for Quadrant A Data is divided into 100 sec bins |
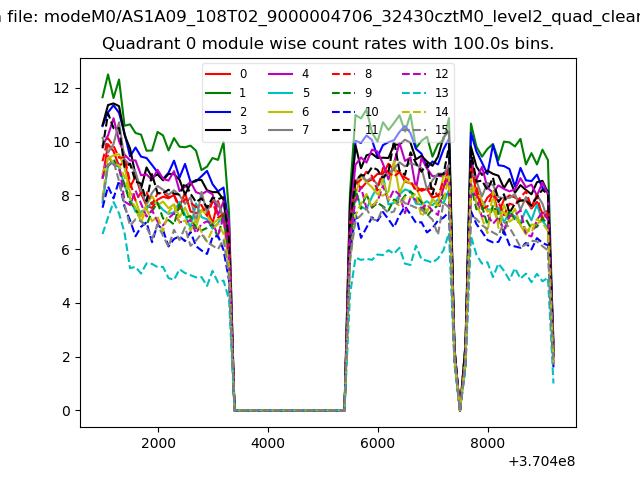 |
 |
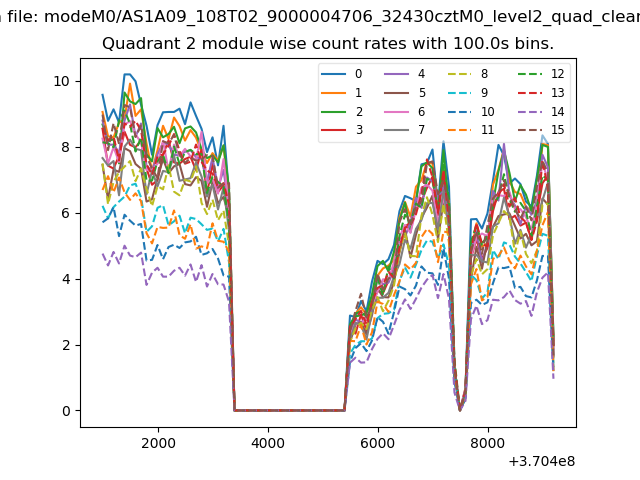
| Module-wise count rates for Quadrant B Data is divided into 100 sec bins |
 |
 |
| Module-wise count rates for Quadrant C Data is divided into 100 sec bins |
 |
 |
| Module-wise count rates for Quadrant D Data is divided into 100 sec bins |
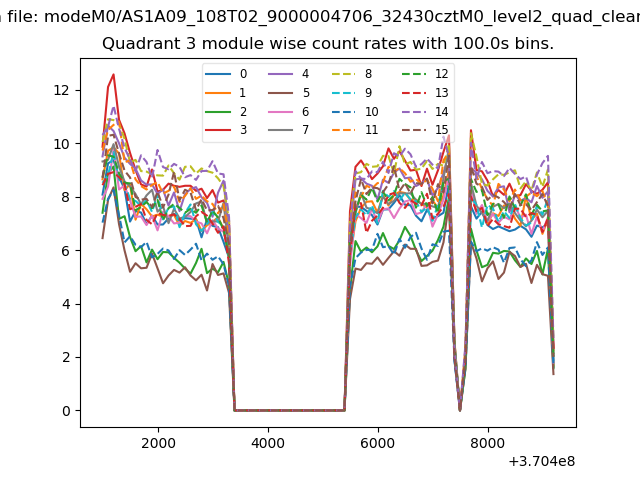 |
 |
| Parameter | Plot |
|---|---|
| CZT HV Monitor | 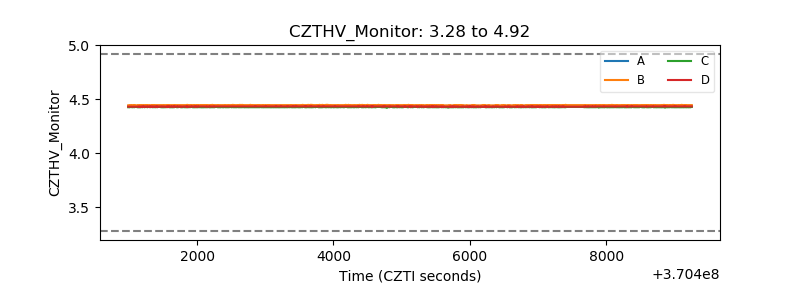 |
| D_VDD | 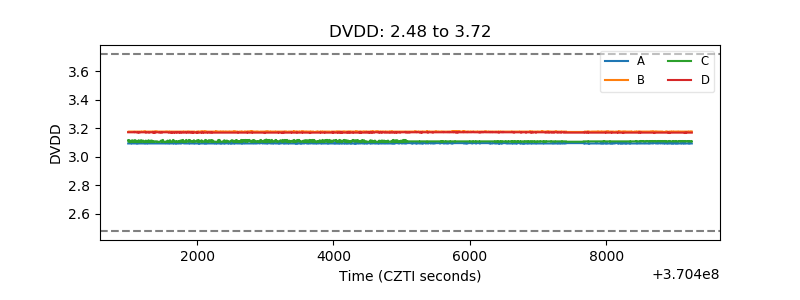 |
| Temperature 1 | 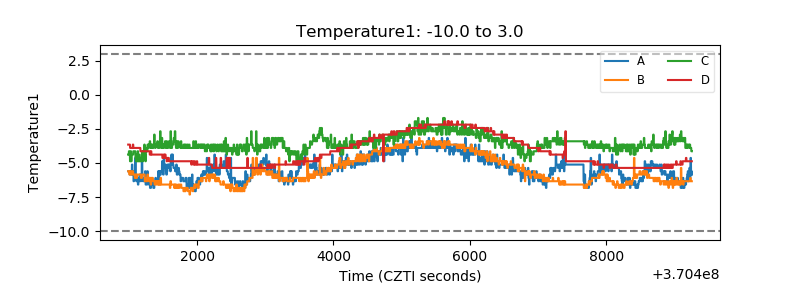 |
| Veto HV Monitor | 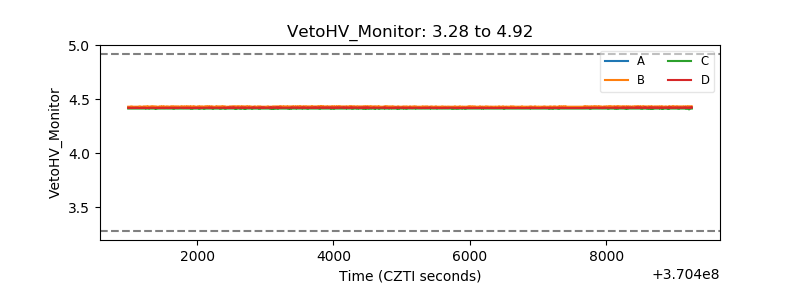 |
| Veto LLD | 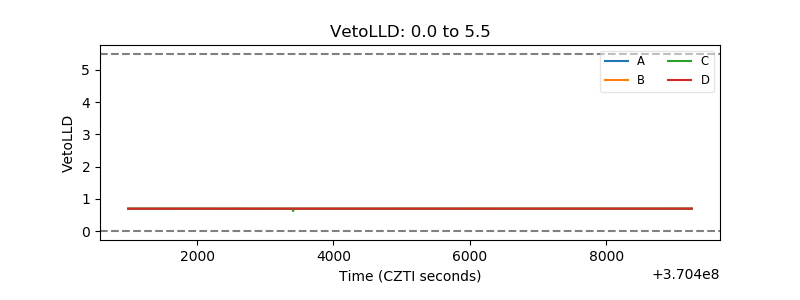 |
| Alpha Counter | 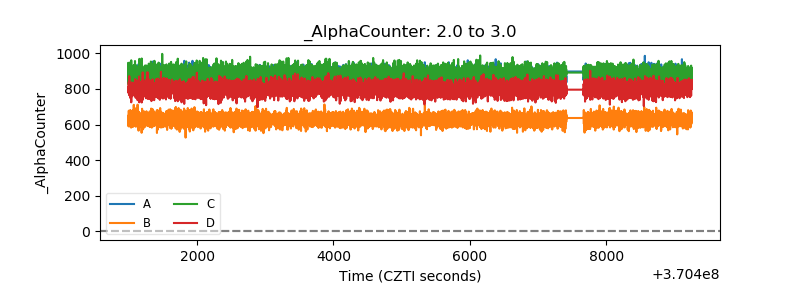 |
| _CPM_Rate | 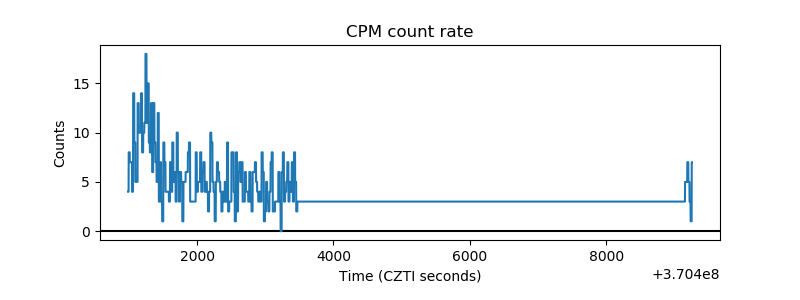 |
| CZT Counter | 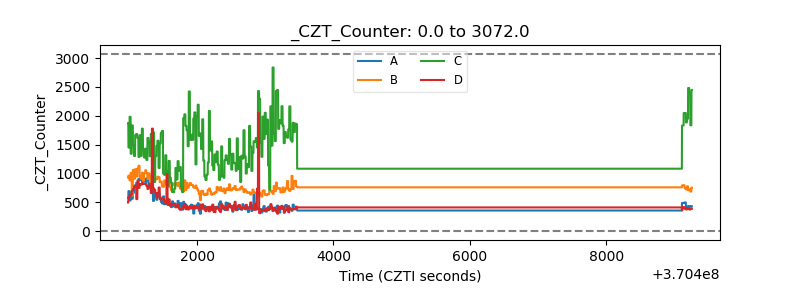 |
| +2.5 Volts monitor |  |
| +5 Volts monitor |  |
| _ROLL_ROT | 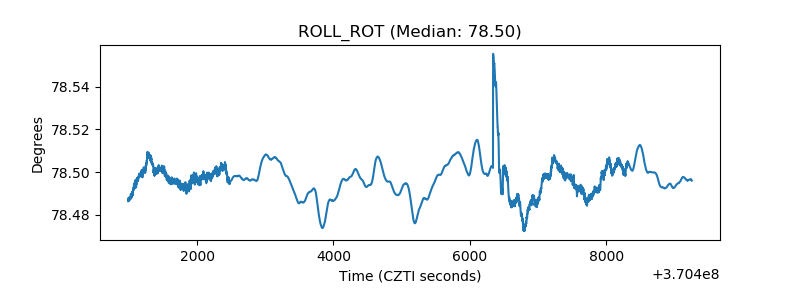 |
| _Roll_DEC | 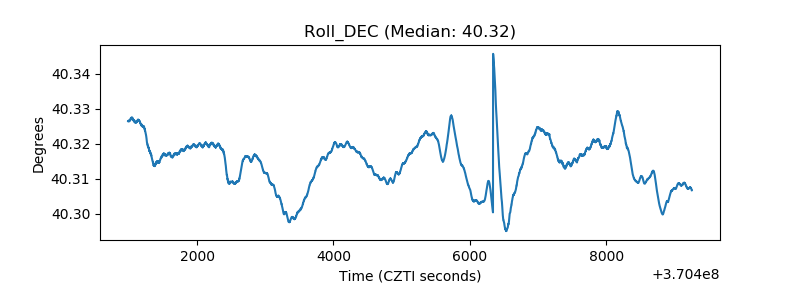 |
| _Roll_RA | 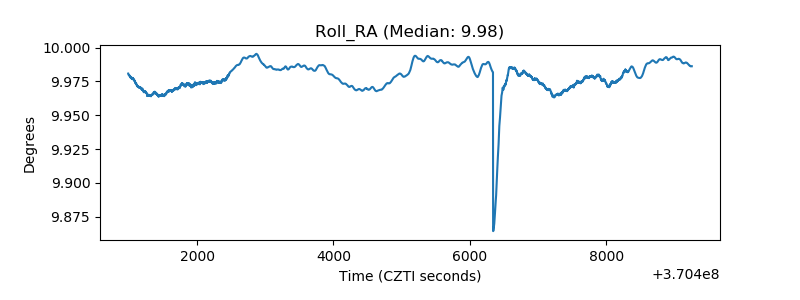 |
| Veto Counter | 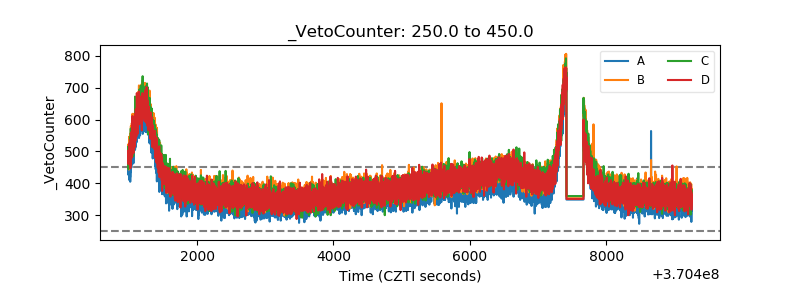 |