| Param | Original file | Final file |
|---|---|---|
| Filename | modeM0/AS1A09_108T02_9000004706_32434cztM0_level2.evt | modeM0/AS1A09_108T02_9000004706_32434cztM0_level2_quad_clean.evt |
| Size (bytes) | 576,342,720 | 68,400,000 |
| Size | 549.6 MB | 65.2 MB |
| Events in quadrant A | 3,299,279 | 408,139 |
| Events in quadrant B | 5,901,950 | 421,369 |
| Events in quadrant C | 3,880,439 | 390,837 |
| Events in quadrant D | 3,923,886 | 387,985 |
| Mode SS | |||
|---|---|---|---|
| Quadrant | BADHDUFLAG | Total packets | Discarded packets |
| A | 0 | 136 | 0 |
| B | 0 | 136 | 0 |
| C | 0 | 136 | 0 |
| D | 0 | 136 | 0 |
| Mode M9 | |||
|---|---|---|---|
| Quadrant | BADHDUFLAG | Total packets | Discarded packets |
| A | 0 | 13 | 0 |
| B | 0 | 13 | 0 |
| C | 0 | 13 | 0 |
| D | 0 | 14 | 0 |
| Mode M0 | |||
|---|---|---|---|
| Quadrant | BADHDUFLAG | Total packets | Discarded packets |
| A | 0 | 13935 | 3 |
| B | 0 | 22320 | 2 |
| C | 0 | 15624 | 2 |
| D | 0 | 16088 | 2 |
| Quadrant | Total seconds | Saturated seconds | Saturation percentage |
|---|---|---|---|
| A | 6631 | 45 | 0.678631% |
| B | 6631 | 197 | 2.970894% |
| C | 6631 | 210 | 3.166943% |
| D | 6631 | 56 | 0.844518% |
Noise dominated data is calculated using 1-second bins in cleaned event files. If a bin has >2000 counts, and if more than 50% of those come from <1% of pixels, then it is considered to be noise-dominated and hence unusable.
| Quadrant | # 1 sec bins | Bins with >0 counts | Bins with >2000 counts | High rate bins dominated by noise | Noise dominated (total time) | Noise dominated (detector-on time) | Marked lightcurve |
|---|---|---|---|---|---|---|---|
| A | 7686 | 6632 | 0 | 0 | 0.00% | 0.00% | 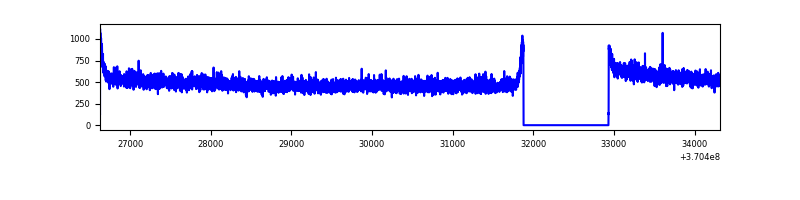 |
| B | 7686 | 6632 | 23 | 23 | 0.30% | 0.35% | 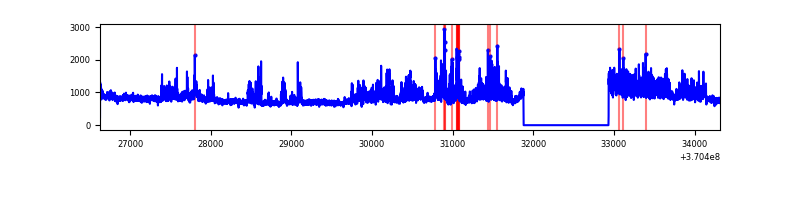 |
| C | 7686 | 6632 | 49 | 49 | 0.64% | 0.74% | 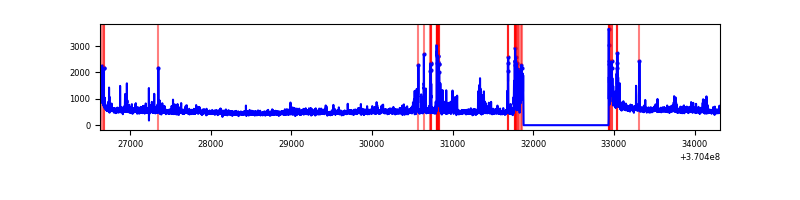 |
| D | 7686 | 6632 | 27 | 27 | 0.35% | 0.41% | 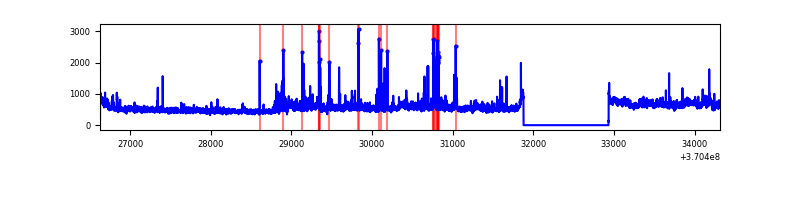 |
Top three noisy pixels from each quadrant. If the there are fewer than three noisy pixels in the level2.evt file, extra rows are filled as -1
| Pixel properties | Quadrant properties | ||||||
|---|---|---|---|---|---|---|---|
| Quadrant | DetID | PixID | Counts | Sigma | Mean | Median | Sigma |
| A | 13 | 254 | 11492 | 63.08 | 851 | 836 | 168.9 |
| A | 13 | 6 | 10818 | 59.09 | 851 | 836 | 168.9 |
| A | 3 | 137 | 8784 | 47.05 | 851 | 836 | 168.9 |
| B | 6 | 159 | 1744812 | 10826.38 | 840 | 817 | 161.1 |
| B | 4 | 80 | 858682 | 5325.46 | 840 | 817 | 161.1 |
| B | 12 | 111 | 20183 | 120.22 | 840 | 817 | 161.1 |
| C | 3 | 233 | 319689 | 1693.75 | 802 | 806 | 188.3 |
| C | 14 | 238 | 138377 | 730.71 | 802 | 806 | 188.3 |
| C | 10 | 22 | 94803 | 499.26 | 802 | 806 | 188.3 |
| D | 8 | 195 | 589892 | 3056.54 | 816 | 796 | 192.7 |
| D | 2 | 250 | 153276 | 791.15 | 816 | 796 | 192.7 |
| D | 12 | 1 | 33022 | 167.21 | 816 | 796 | 192.7 |
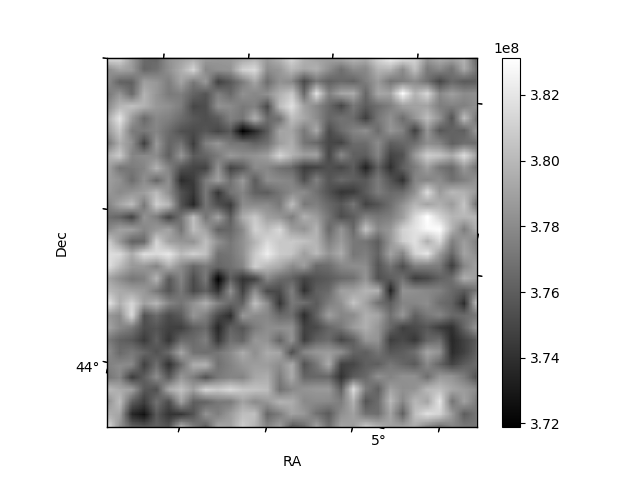
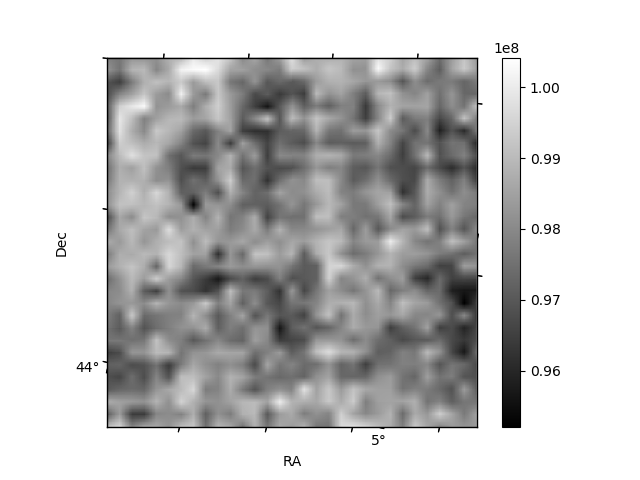
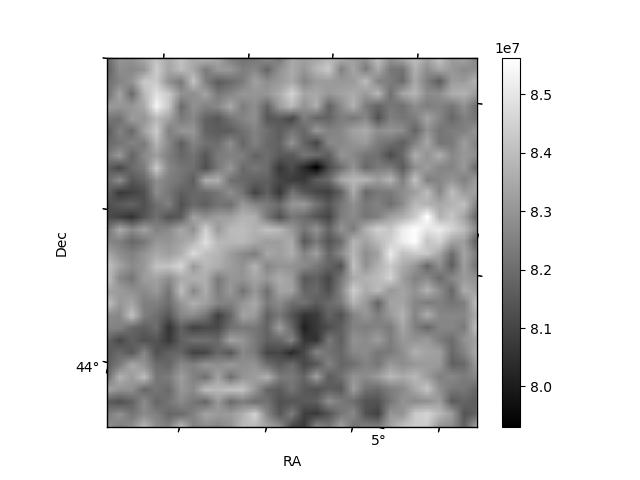
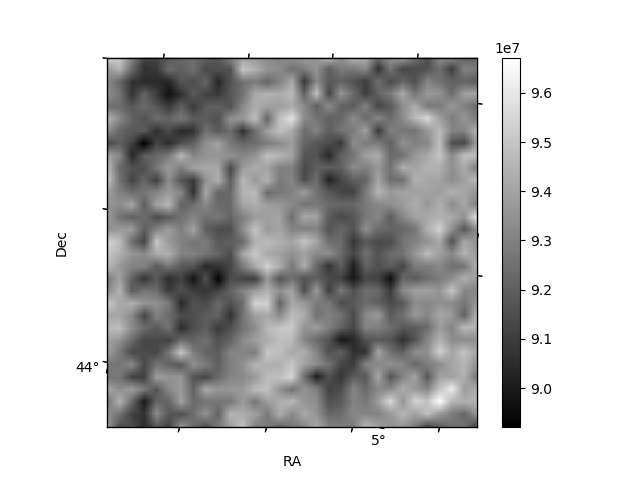
Histogram calculated using DETX and DETY for each event in the final _common_clean file
| Quadrant A | 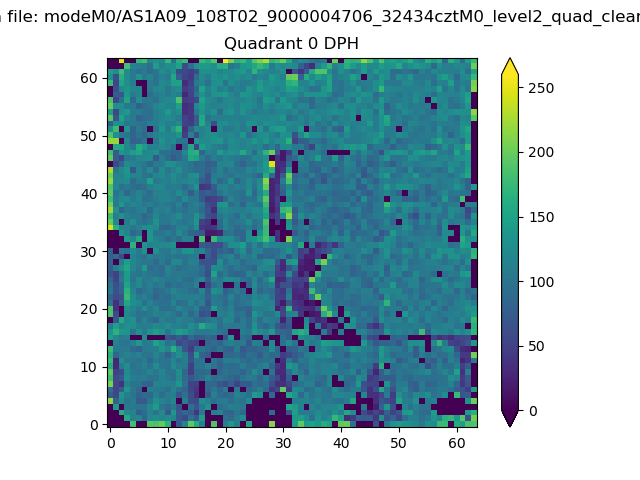 |
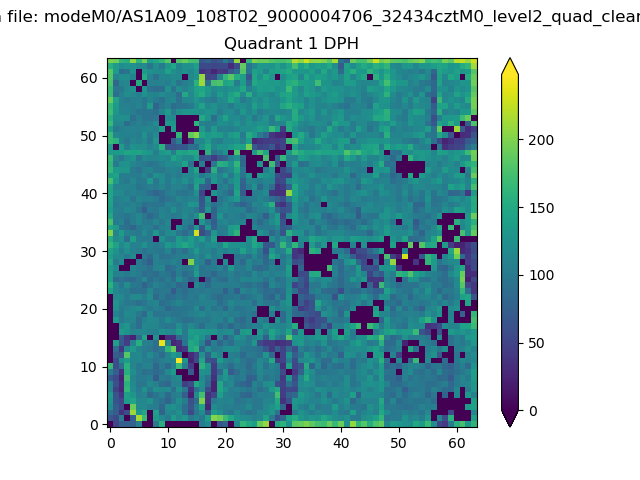 |
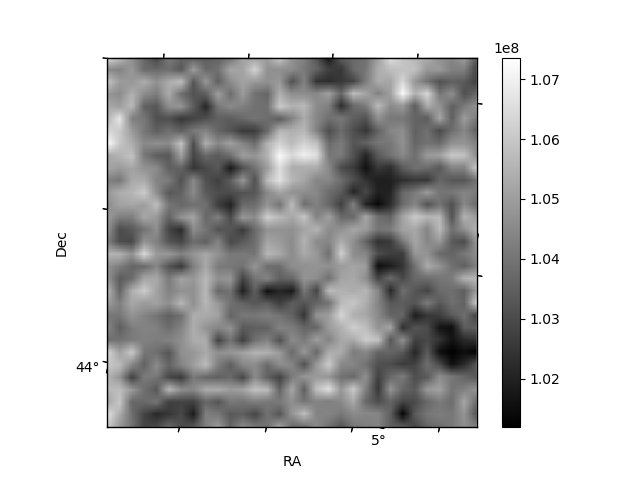
Quadrant B |
|---|---|---|---|
| Quadrant D | 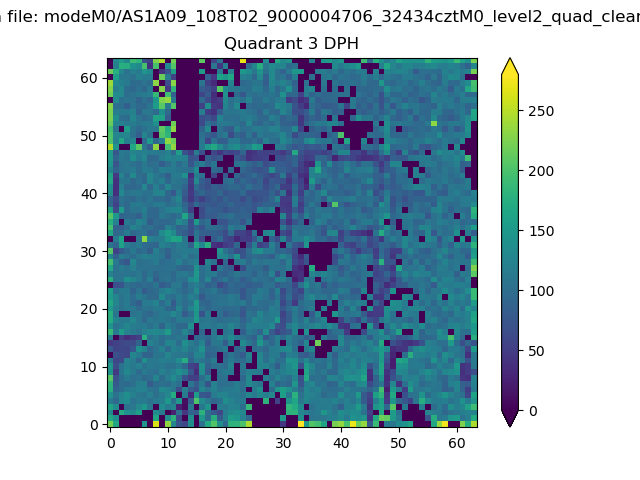 |
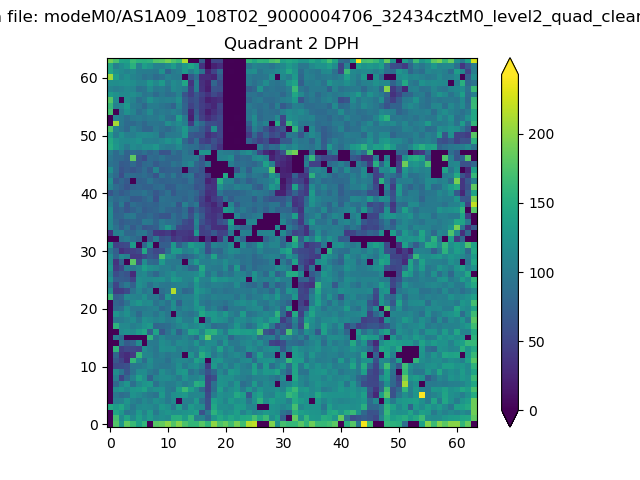 |
Quadrant C |
| Plot type | Count rate plots | Images |
|---|---|---|
| Comparison with Poisson distribution Blue bars denote a histogram of data divided into 1 sec bins. Red curve is a Poisson curve with rate = median count rate of data. |
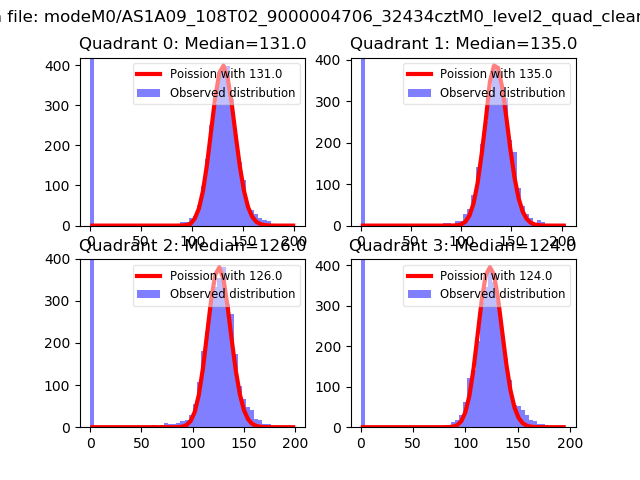 |
 |
| Quadrant-wise count rates Data is divided into 100 sec bins |
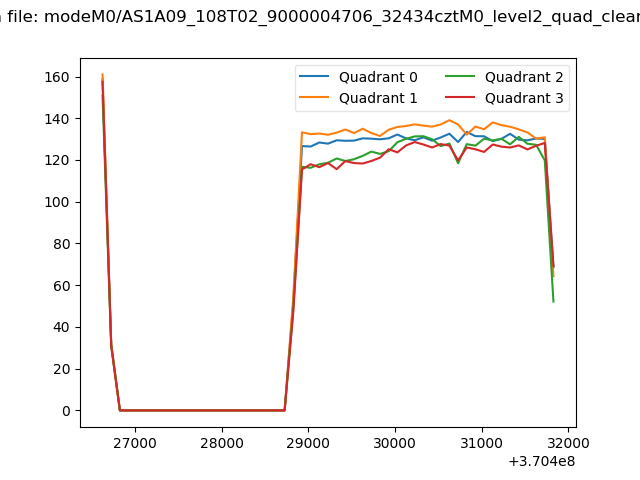 |
|
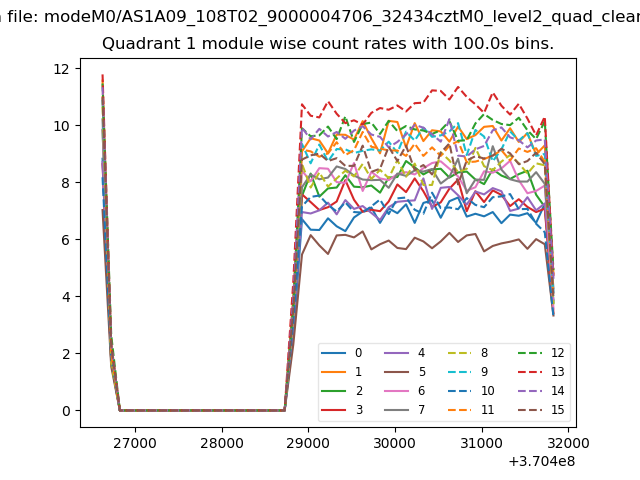
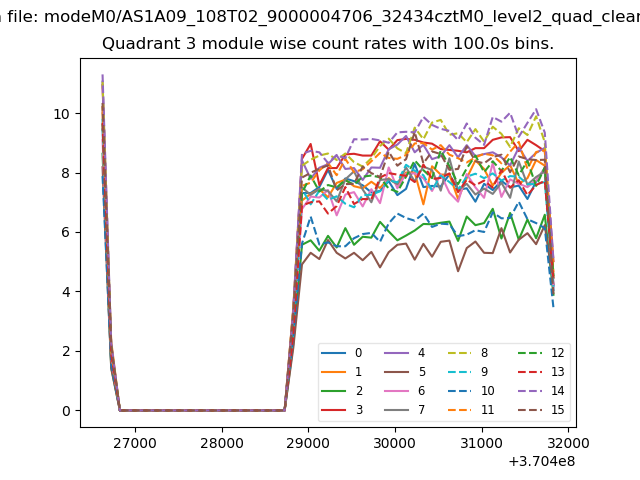
| Module-wise count rates for Quadrant A Data is divided into 100 sec bins |
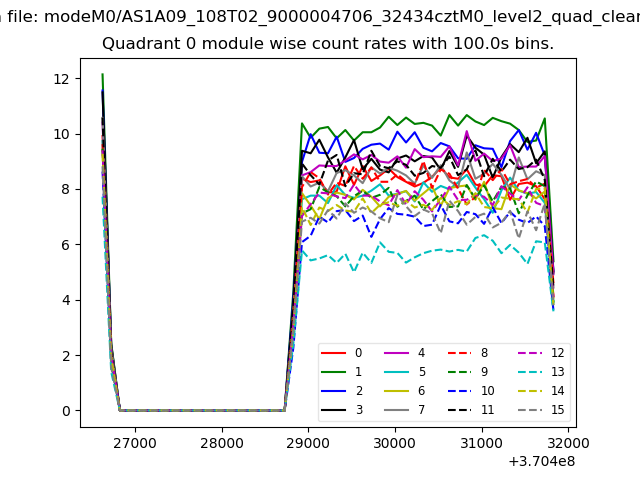 |
 |
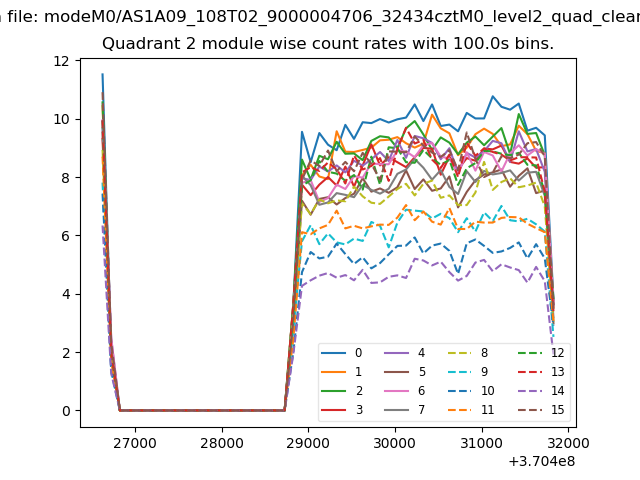
| Module-wise count rates for Quadrant B Data is divided into 100 sec bins |
 |
 |
| Module-wise count rates for Quadrant C Data is divided into 100 sec bins |
 |
 |
| Module-wise count rates for Quadrant D Data is divided into 100 sec bins |
 |
 |
| Parameter | Plot |
|---|---|
| CZT HV Monitor | 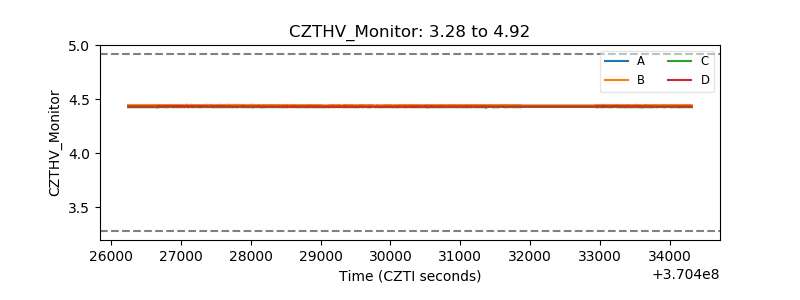 |
| D_VDD | 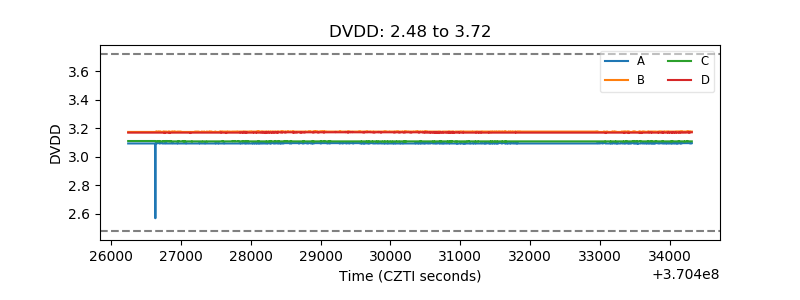 |
| Temperature 1 | 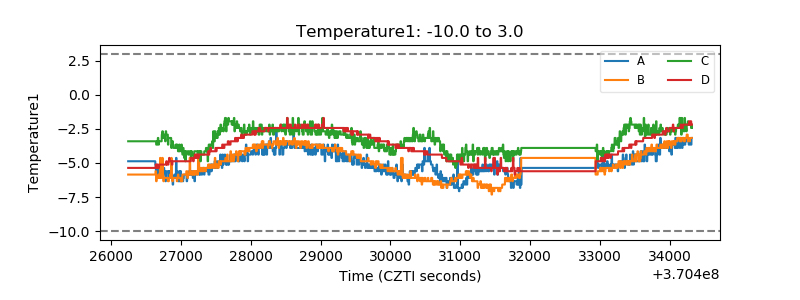 |
| Veto HV Monitor | 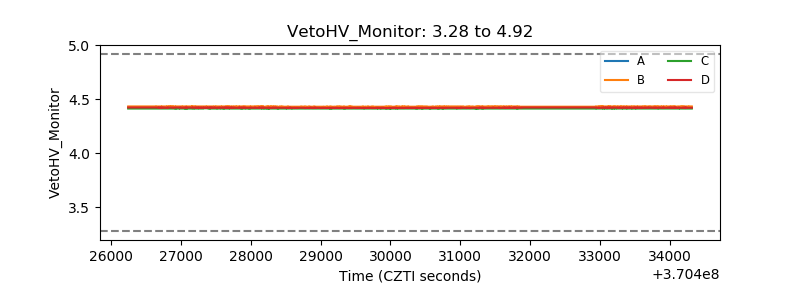 |
| Veto LLD | 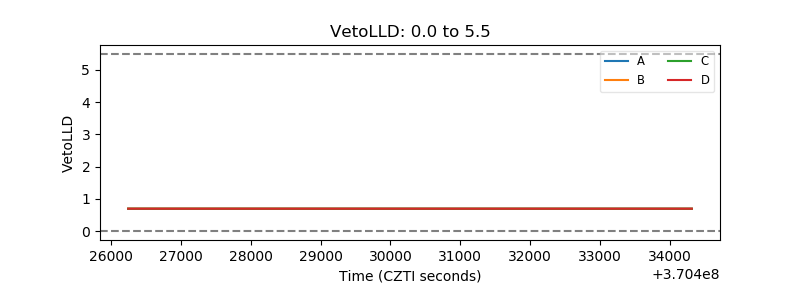 |
| Alpha Counter | 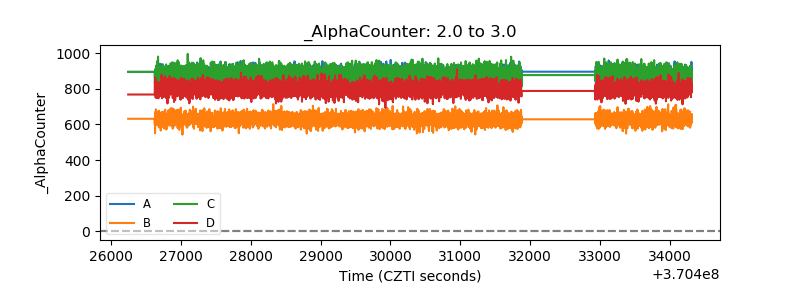 |
| _CPM_Rate | 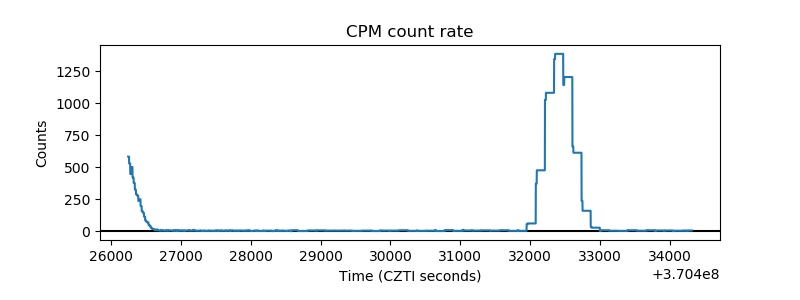 |
| CZT Counter | 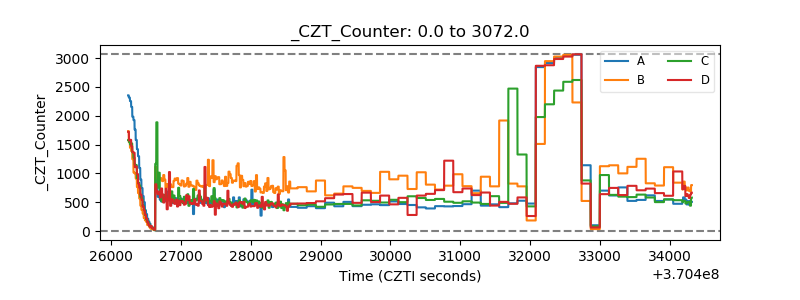 |
| +2.5 Volts monitor |  |
| +5 Volts monitor |  |
| _ROLL_ROT | 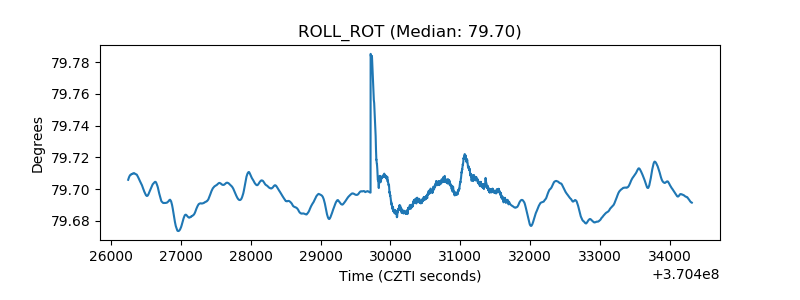 |
| _Roll_DEC | 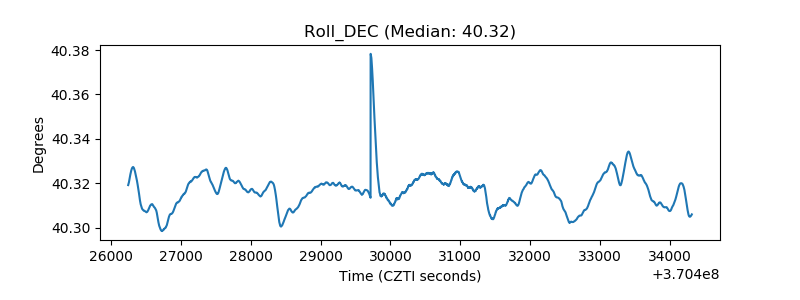 |
| _Roll_RA | 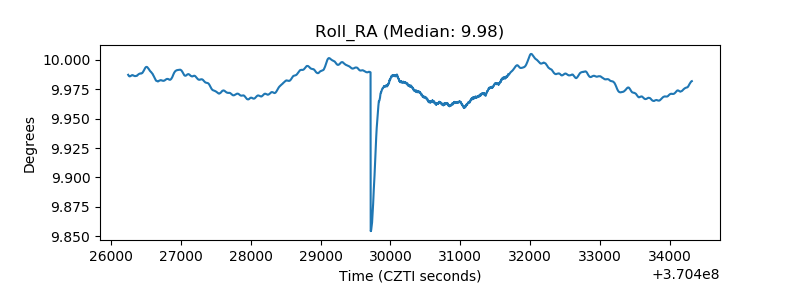 |
| Veto Counter | 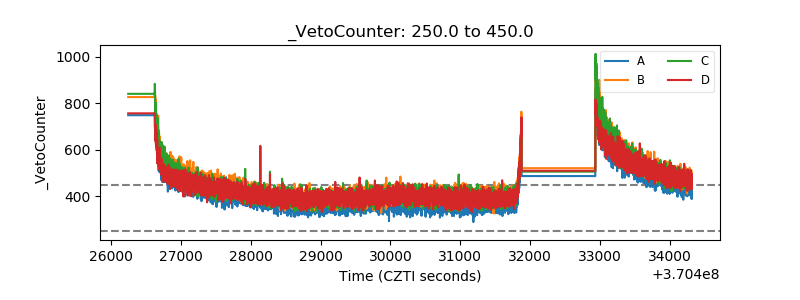 |