| Param | Original file | Final file |
|---|---|---|
| Filename | modeM0/AS1A09_108T02_9000004706_32437cztM0_level2.evt | modeM0/AS1A09_108T02_9000004706_32437cztM0_level2_quad_clean.evt |
| Size (bytes) | 636,264,000 | 92,586,240 |
| Size | 606.8 MB | 88.3 MB |
| Events in quadrant A | 3,575,268 | 602,299 |
| Events in quadrant B | 6,122,962 | 603,982 |
| Events in quadrant C | 4,090,232 | 584,352 |
| Events in quadrant D | 5,047,736 | 565,943 |
| Mode SS | |||
|---|---|---|---|
| Quadrant | BADHDUFLAG | Total packets | Discarded packets |
| A | 0 | 132 | 0 |
| B | 0 | 132 | 0 |
| C | 0 | 132 | 0 |
| D | 0 | 132 | 0 |
| Mode M9 | |||
|---|---|---|---|
| Quadrant | BADHDUFLAG | Total packets | Discarded packets |
| A | 0 | 24 | 0 |
| B | 0 | 24 | 0 |
| C | 0 | 24 | 0 |
| D | 0 | 24 | 0 |
| Mode M0 | |||
|---|---|---|---|
| Quadrant | BADHDUFLAG | Total packets | Discarded packets |
| A | 0 | 14882 | 3 |
| B | 0 | 22619 | 2 |
| C | 0 | 16397 | 2 |
| D | 0 | 19641 | 2 |
| Quadrant | Total seconds | Saturated seconds | Saturation percentage |
|---|---|---|---|
| A | 6410 | 123 | 1.918877% |
| B | 6410 | 521 | 8.127925% |
| C | 6410 | 445 | 6.942278% |
| D | 6410 | 141 | 2.199688% |
Noise dominated data is calculated using 1-second bins in cleaned event files. If a bin has >2000 counts, and if more than 50% of those come from <1% of pixels, then it is considered to be noise-dominated and hence unusable.
| Quadrant | # 1 sec bins | Bins with >0 counts | Bins with >2000 counts | High rate bins dominated by noise | Noise dominated (total time) | Noise dominated (detector-on time) | Marked lightcurve |
|---|---|---|---|---|---|---|---|
| A | 8825 | 6412 | 0 | 0 | 0.00% | 0.00% | 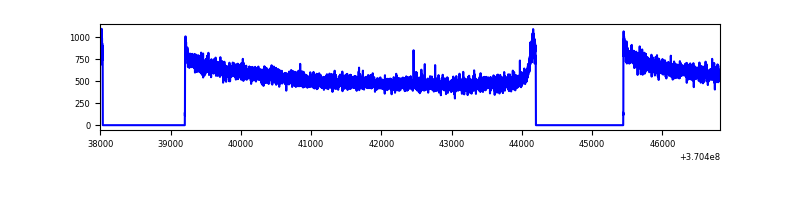 |
| B | 8825 | 6412 | 163 | 163 | 1.85% | 2.54% | 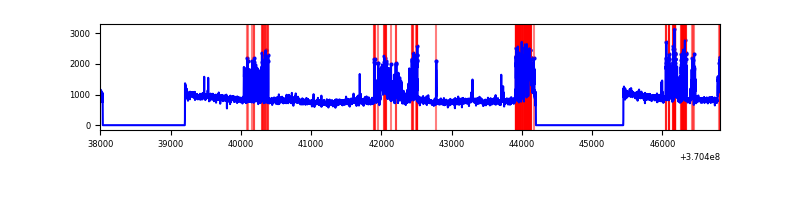 |
| C | 8825 | 6412 | 27 | 27 | 0.31% | 0.42% | 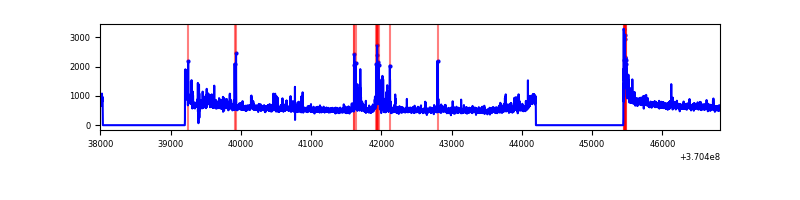 |
| D | 8825 | 6412 | 26 | 26 | 0.29% | 0.41% | 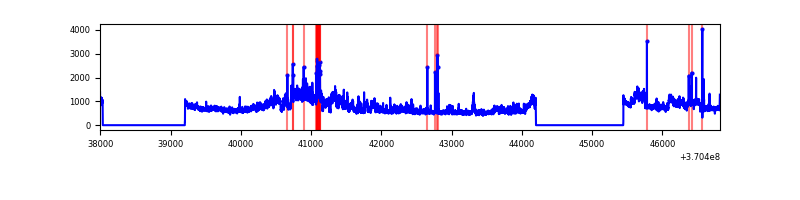 |
Top three noisy pixels from each quadrant. If the there are fewer than three noisy pixels in the level2.evt file, extra rows are filled as -1
| Pixel properties | Quadrant properties | ||||||
|---|---|---|---|---|---|---|---|
| Quadrant | DetID | PixID | Counts | Sigma | Mean | Median | Sigma |
| A | 13 | 6 | 16278 | 84.74 | 923 | 909 | 181.4 |
| A | 13 | 254 | 10599 | 53.43 | 923 | 909 | 181.4 |
| A | 3 | 137 | 8762 | 43.3 | 923 | 909 | 181.4 |
| B | 6 | 159 | 1597562 | 9633.81 | 893 | 874 | 165.7 |
| B | 4 | 80 | 1017904 | 6136.38 | 893 | 874 | 165.7 |
| B | 12 | 111 | 19726 | 113.75 | 893 | 874 | 165.7 |
| C | 14 | 238 | 206017 | 1021.18 | 870 | 880 | 200.9 |
| C | 10 | 22 | 142508 | 705.03 | 870 | 880 | 200.9 |
| C | 0 | 10 | 108547 | 535.97 | 870 | 880 | 200.9 |
| D | 8 | 195 | 1478020 | 7058.76 | 894 | 873 | 209.3 |
| D | 2 | 250 | 62858 | 296.2 | 894 | 873 | 209.3 |
| D | 1 | 47 | 49795 | 233.78 | 894 | 873 | 209.3 |
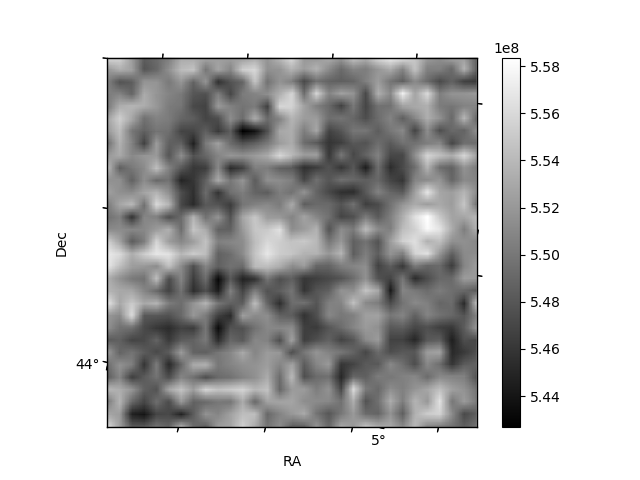
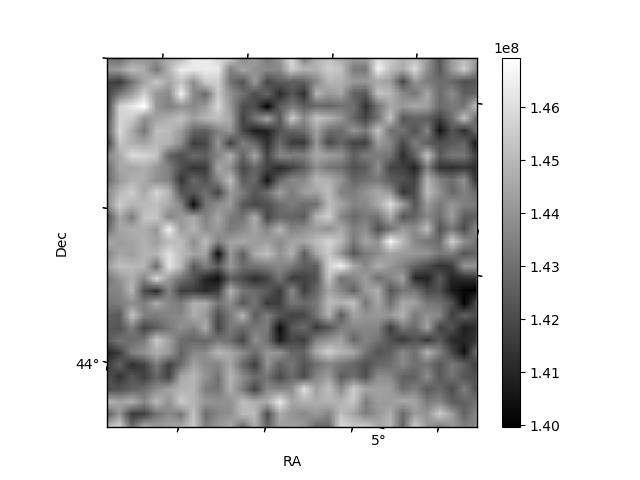
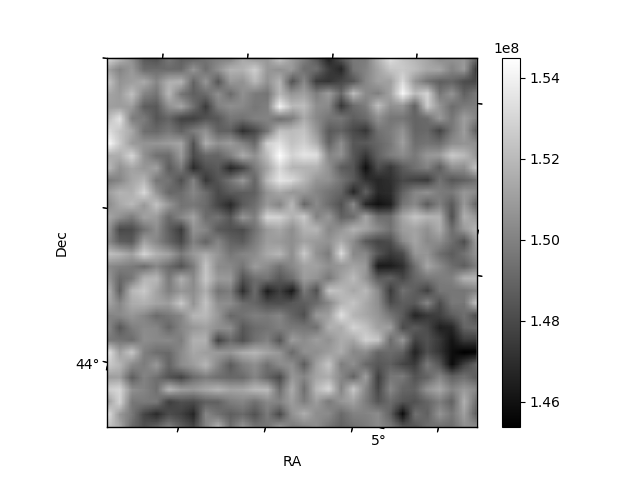
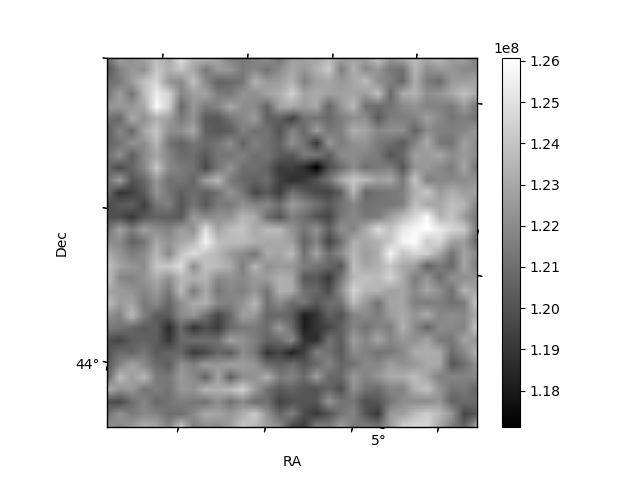
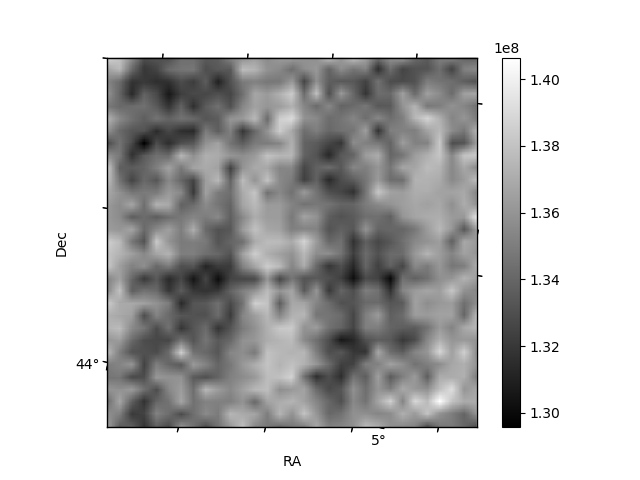
Histogram calculated using DETX and DETY for each event in the final _common_clean file
| Quadrant A | 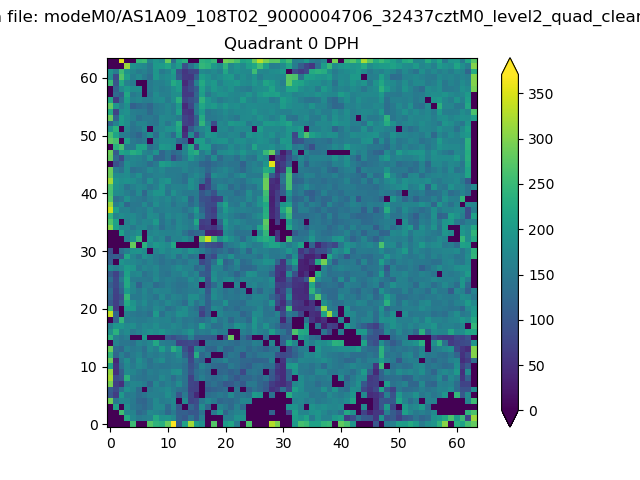 |
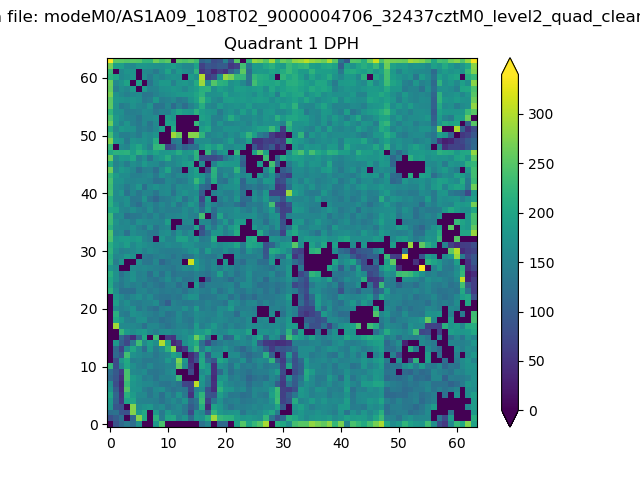 |
Quadrant B |
|---|---|---|---|
| Quadrant D | 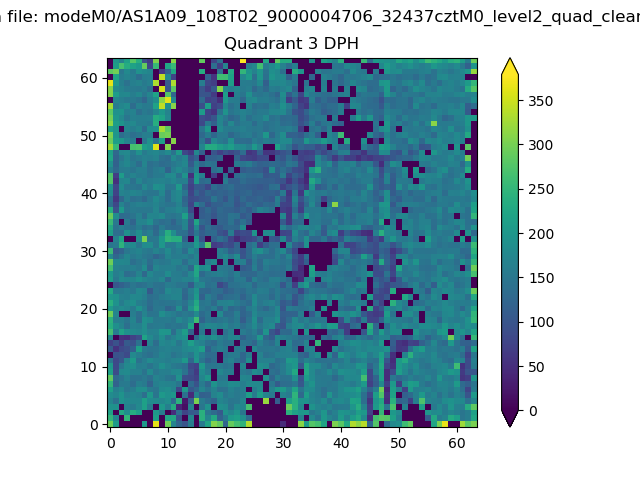 |
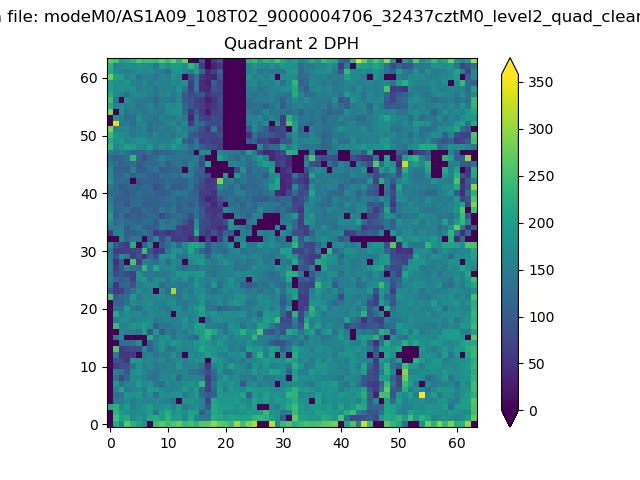 |
Quadrant C |
| Plot type | Count rate plots | Images |
|---|---|---|
| Comparison with Poisson distribution Blue bars denote a histogram of data divided into 1 sec bins. Red curve is a Poisson curve with rate = median count rate of data. |
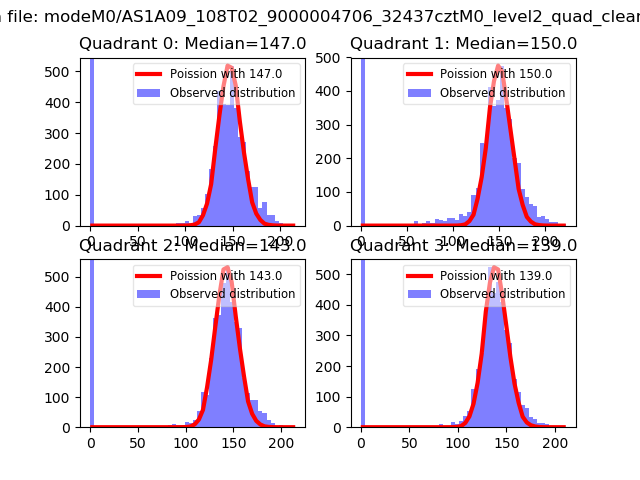 |
 |
| Quadrant-wise count rates Data is divided into 100 sec bins |
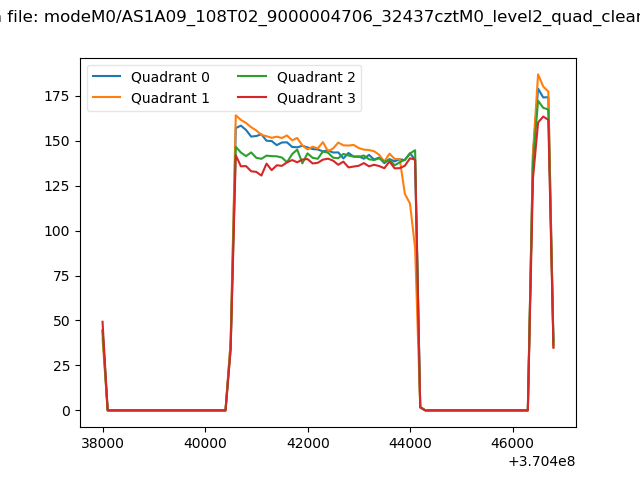 |
|
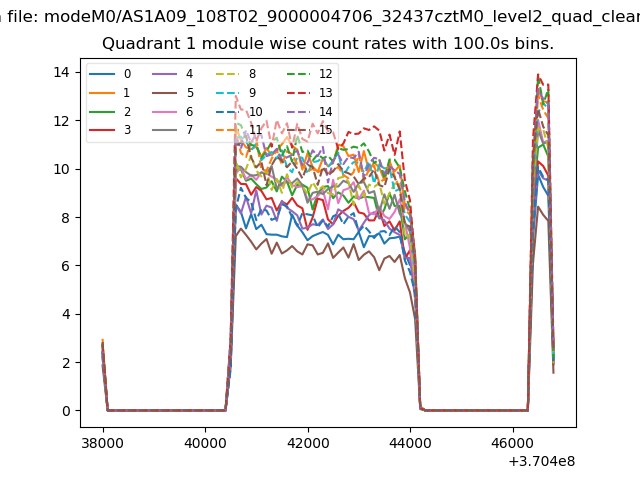
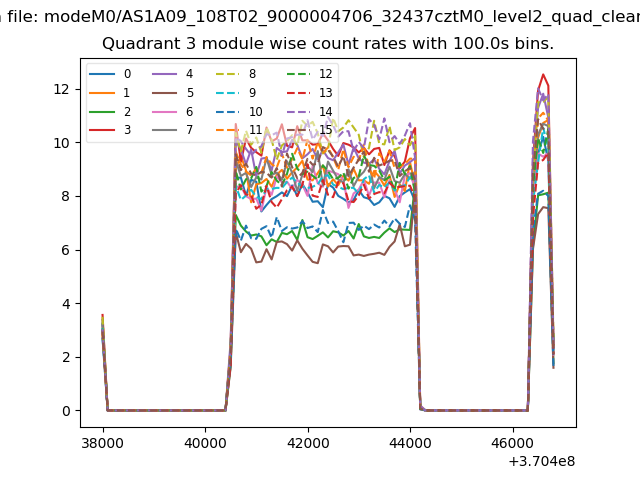
| Module-wise count rates for Quadrant A Data is divided into 100 sec bins |
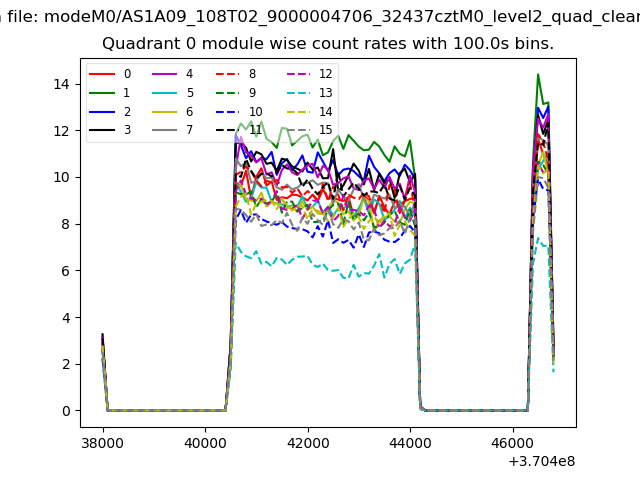 |
 |
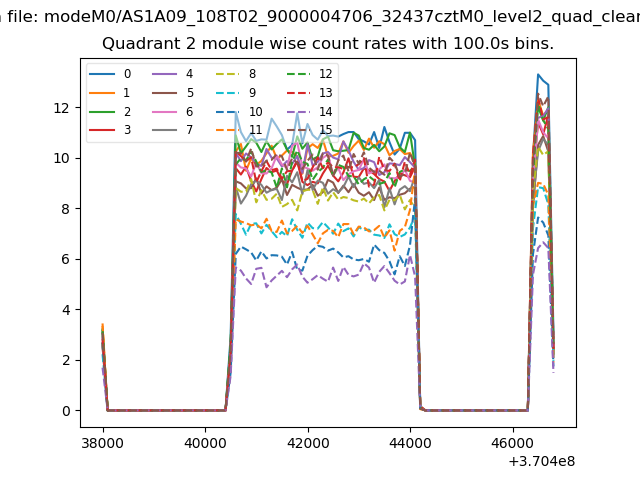
| Module-wise count rates for Quadrant B Data is divided into 100 sec bins |
 |
 |
| Module-wise count rates for Quadrant C Data is divided into 100 sec bins |
 |
 |
| Module-wise count rates for Quadrant D Data is divided into 100 sec bins |
 |
 |
| Parameter | Plot |
|---|---|
| CZT HV Monitor | 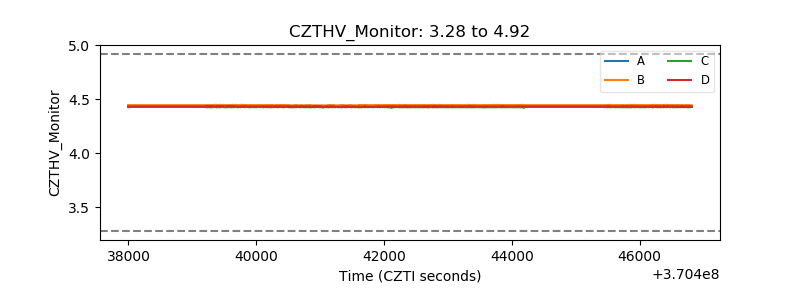 |
| D_VDD | 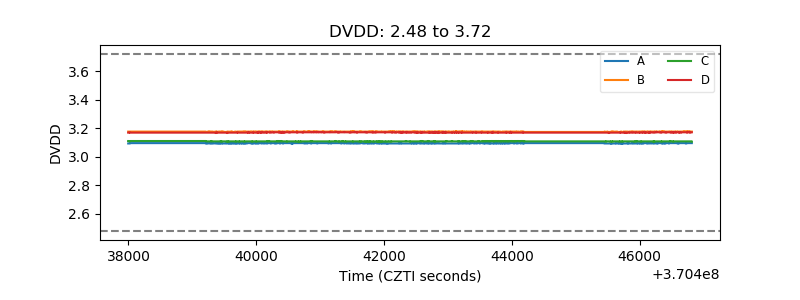 |
| Temperature 1 | 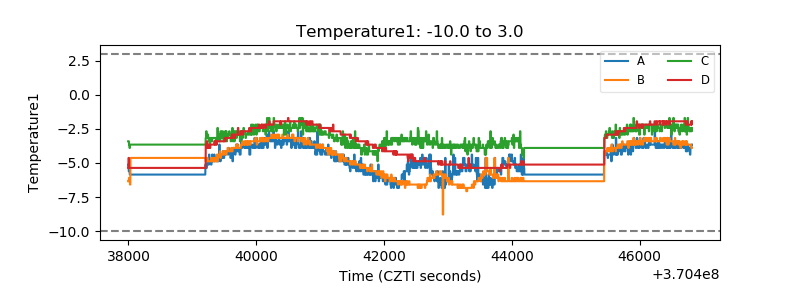 |
| Veto HV Monitor | 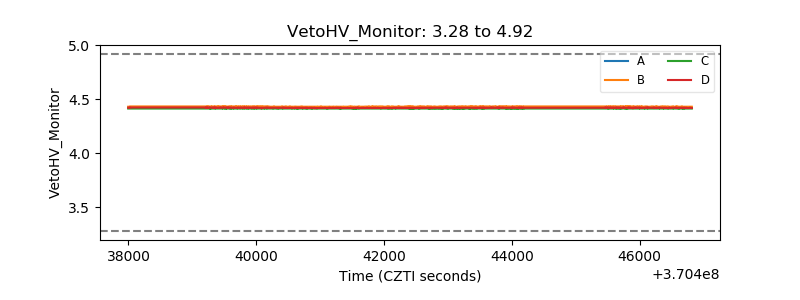 |
| Veto LLD |  |
| Alpha Counter | 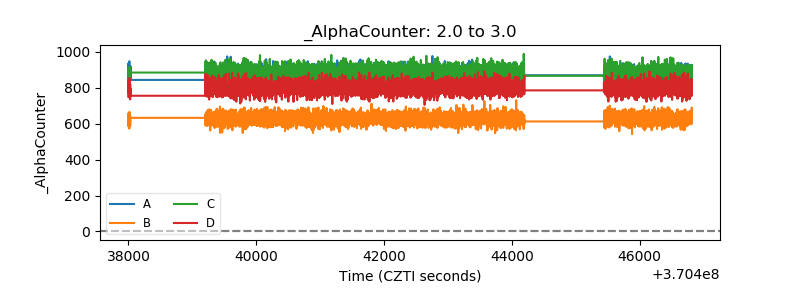 |
| _CPM_Rate | 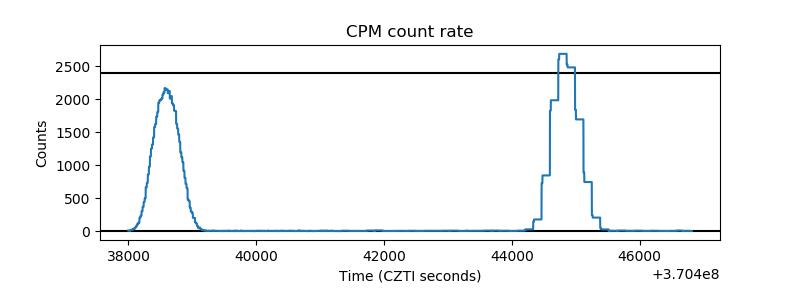 |
| CZT Counter | 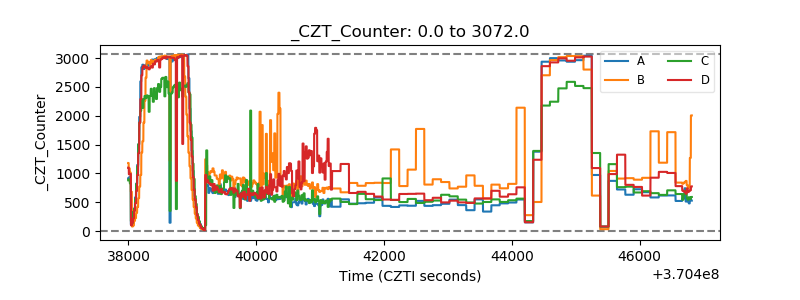 |
| +2.5 Volts monitor | 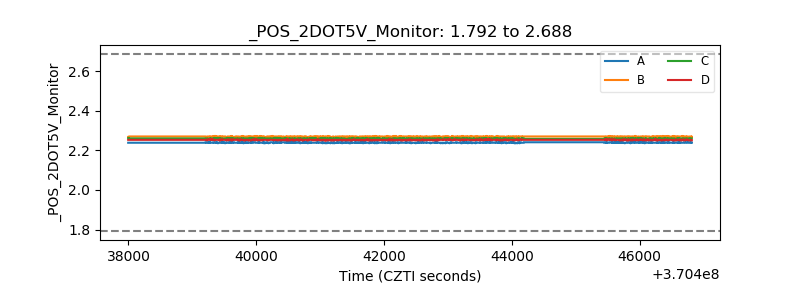 |
| +5 Volts monitor | 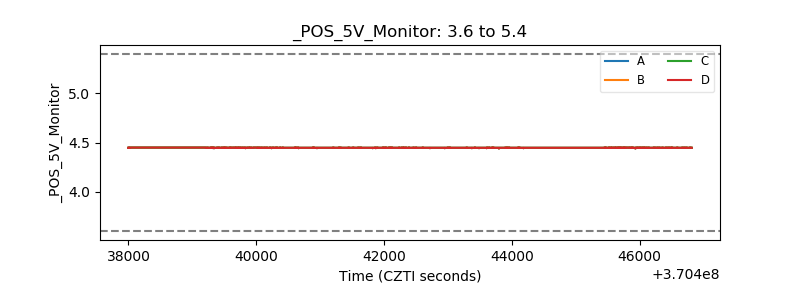 |
| _ROLL_ROT | 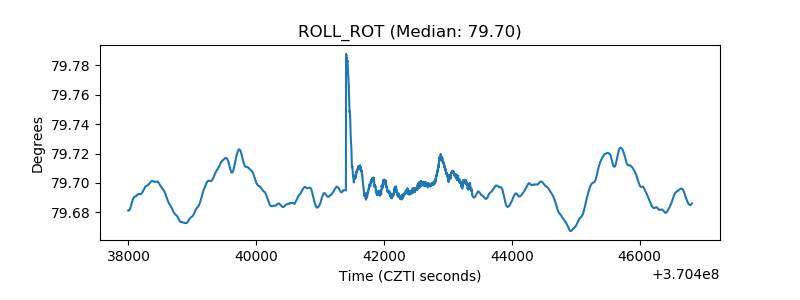 |
| _Roll_DEC | 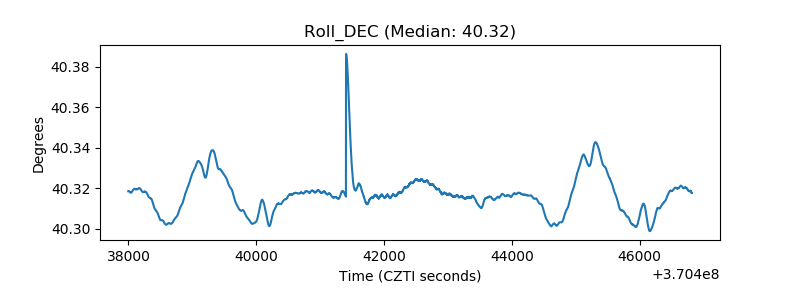 |
| _Roll_RA | 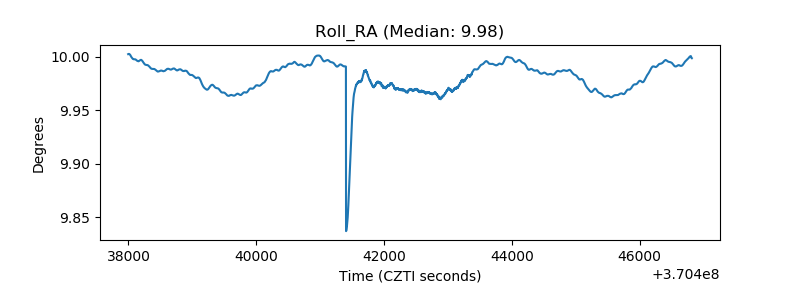 |
| Veto Counter | 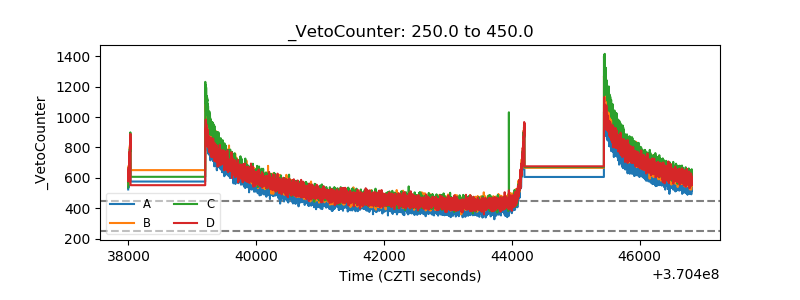 |