| Param | Original file | Final file |
|---|---|---|
| Filename | modeM0/AS1A09_108T02_9000004706_32438cztM0_level2.evt | modeM0/AS1A09_108T02_9000004706_32438cztM0_level2_quad_clean.evt |
| Size (bytes) | 237,214,080 | 32,745,600 |
| Size | 226.2 MB | 31.2 MB |
| Events in quadrant A | 1,349,089 | 211,763 |
| Events in quadrant B | 2,243,494 | 215,231 |
| Events in quadrant C | 1,533,727 | 204,519 |
| Events in quadrant D | 1,903,470 | 196,958 |
| Mode SS | |||
|---|---|---|---|
| Quadrant | BADHDUFLAG | Total packets | Discarded packets |
| A | 0 | 46 | 0 |
| B | 0 | 46 | 0 |
| C | 0 | 46 | 0 |
| D | 0 | 46 | 0 |
| Mode M9 | |||
|---|---|---|---|
| Quadrant | BADHDUFLAG | Total packets | Discarded packets |
| A | 0 | 10 | 0 |
| B | 0 | 10 | 0 |
| C | 0 | 10 | 0 |
| D | 0 | 11 | 0 |
| Mode M0 | |||
|---|---|---|---|
| Quadrant | BADHDUFLAG | Total packets | Discarded packets |
| A | 0 | 5556 | 1 |
| B | 0 | 8235 | 1 |
| C | 0 | 6173 | 1 |
| D | 0 | 7320 | 1 |
| Quadrant | Total seconds | Saturated seconds | Saturation percentage |
|---|---|---|---|
| A | 2249 | 20 | 0.889284% |
| B | 2249 | 195 | 8.670520% |
| C | 2249 | 104 | 4.624277% |
| D | 2249 | 34 | 1.511783% |
Noise dominated data is calculated using 1-second bins in cleaned event files. If a bin has >2000 counts, and if more than 50% of those come from <1% of pixels, then it is considered to be noise-dominated and hence unusable.
| Quadrant | # 1 sec bins | Bins with >0 counts | Bins with >2000 counts | High rate bins dominated by noise | Noise dominated (total time) | Noise dominated (detector-on time) | Marked lightcurve |
|---|---|---|---|---|---|---|---|
| A | 2249 | 2249 | 0 | 0 | 0.00% | 0.00% | 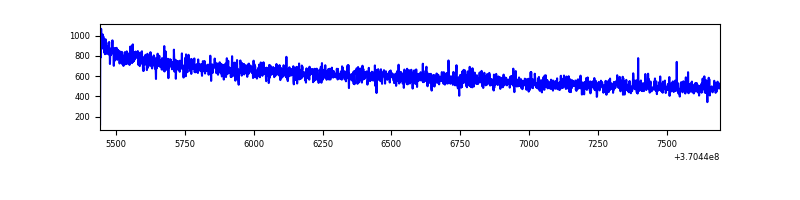 |
| B | 2249 | 2249 | 70 | 70 | 3.11% | 3.11% | 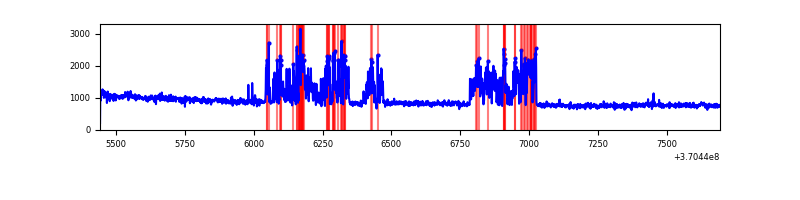 |
| C | 2249 | 2249 | 15 | 15 | 0.67% | 0.67% | 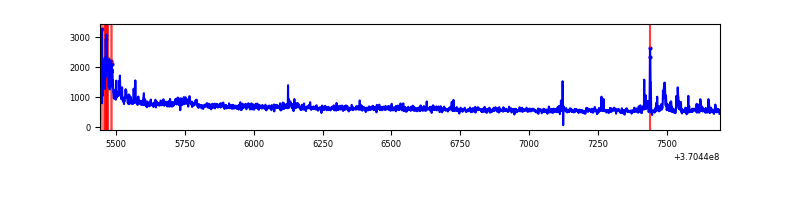 |
| D | 2249 | 2249 | 19 | 19 | 0.84% | 0.84% | 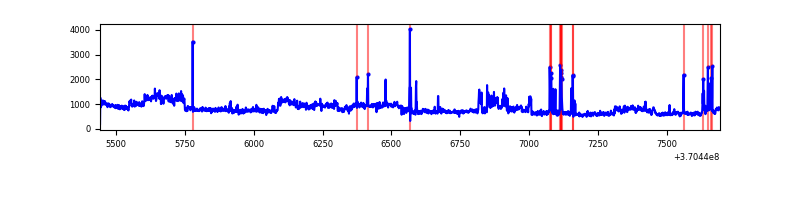 |
Top three noisy pixels from each quadrant. If the there are fewer than three noisy pixels in the level2.evt file, extra rows are filled as -1
| Pixel properties | Quadrant properties | ||||||
|---|---|---|---|---|---|---|---|
| Quadrant | DetID | PixID | Counts | Sigma | Mean | Median | Sigma |
| A | 13 | 6 | 3627 | 47.7 | 349 | 344 | 68.8 |
| A | 13 | 254 | 3451 | 45.14 | 349 | 344 | 68.8 |
| A | 3 | 137 | 3058 | 39.43 | 349 | 344 | 68.8 |
| B | 6 | 159 | 511464 | 8050.53 | 339 | 331 | 63.5 |
| B | 4 | 80 | 405626 | 6383.54 | 339 | 331 | 63.5 |
| B | 12 | 111 | 7108 | 106.74 | 339 | 331 | 63.5 |
| C | 0 | 10 | 75083 | 964.54 | 332 | 335 | 77.5 |
| C | 14 | 238 | 62408 | 800.98 | 332 | 335 | 77.5 |
| C | 10 | 22 | 38477 | 492.18 | 332 | 335 | 77.5 |
| D | 8 | 195 | 505148 | 6263.29 | 339 | 333 | 80.6 |
| D | 1 | 47 | 76202 | 941.31 | 339 | 333 | 80.6 |
| D | 2 | 250 | 24622 | 301.36 | 339 | 333 | 80.6 |
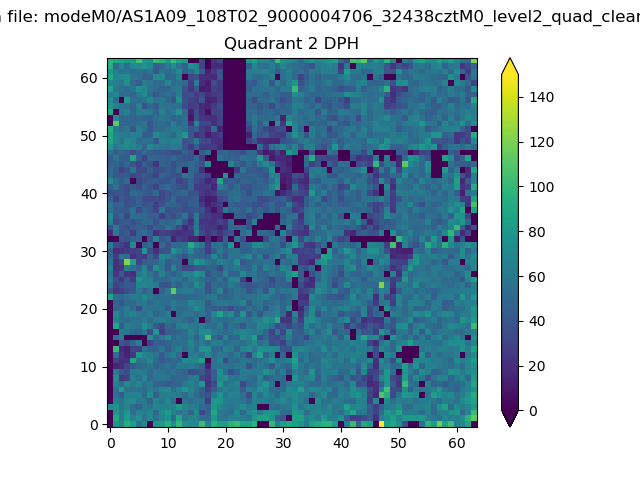
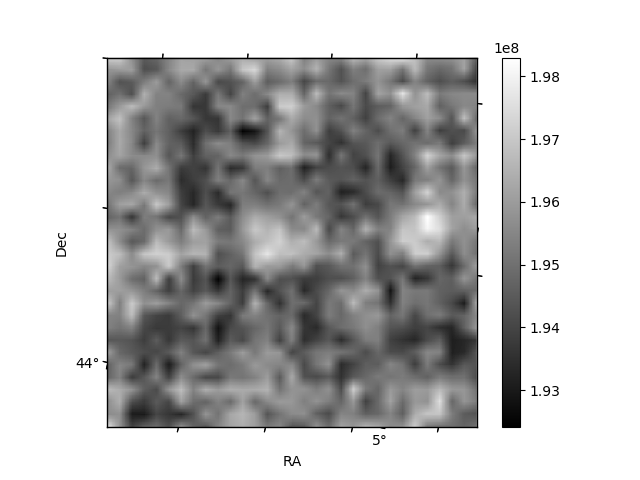
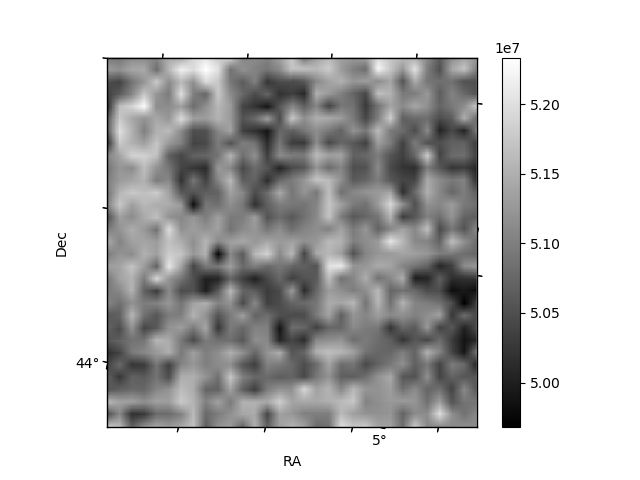
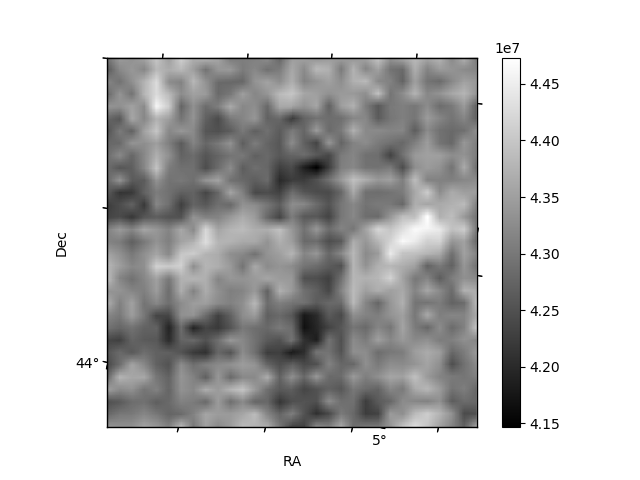
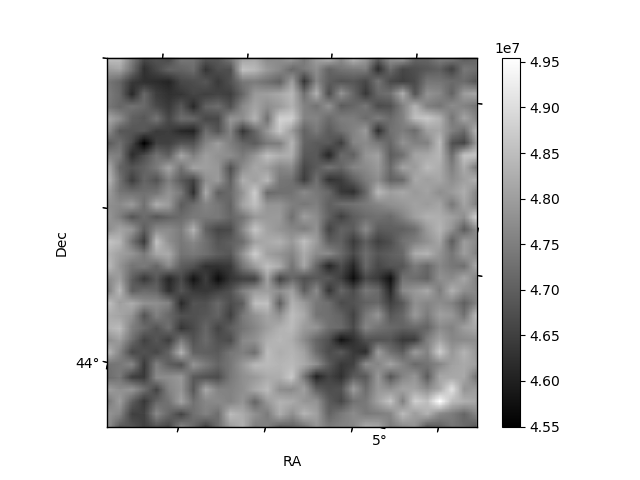
Histogram calculated using DETX and DETY for each event in the final _common_clean file
| Quadrant A | 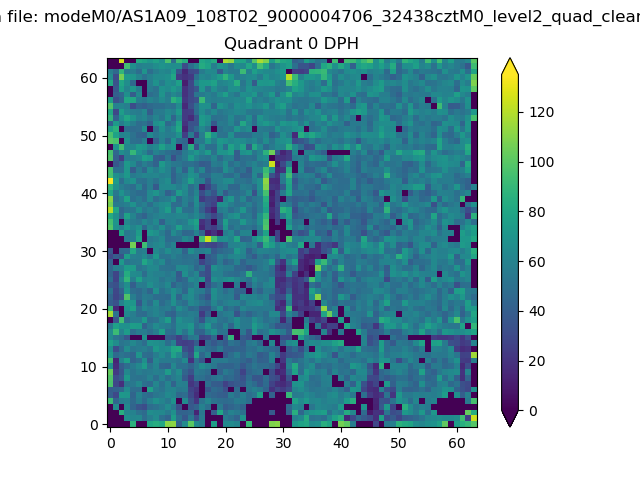 |
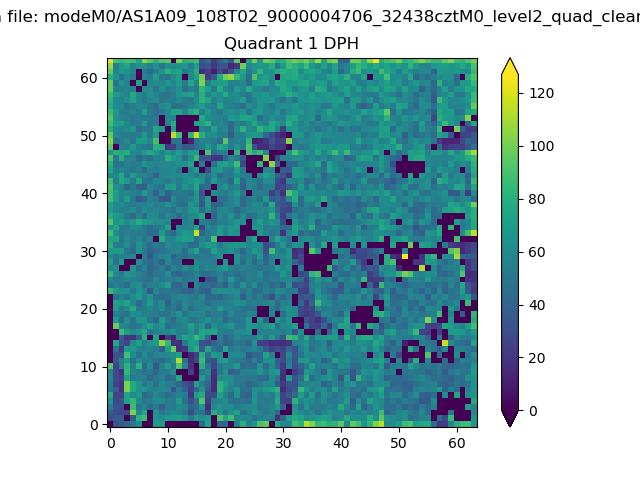 |
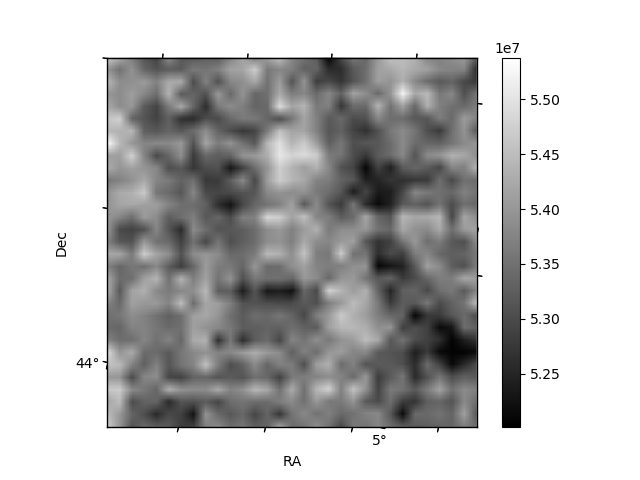
Quadrant B |
|---|---|---|---|
| Quadrant D | 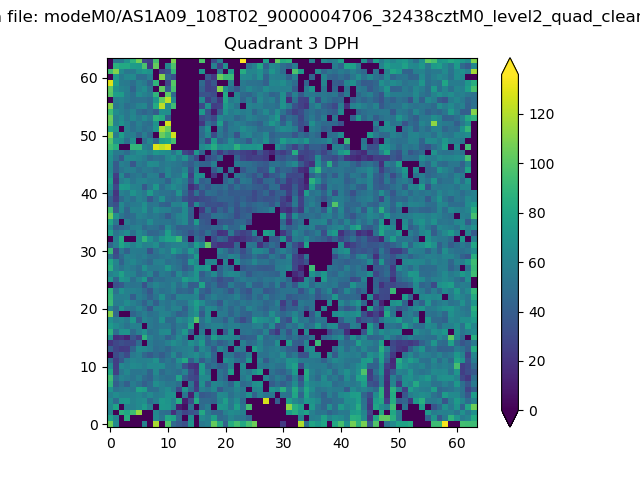 |
 |
Quadrant C |
| Plot type | Count rate plots | Images |
|---|---|---|
| Comparison with Poisson distribution Blue bars denote a histogram of data divided into 1 sec bins. Red curve is a Poisson curve with rate = median count rate of data. |
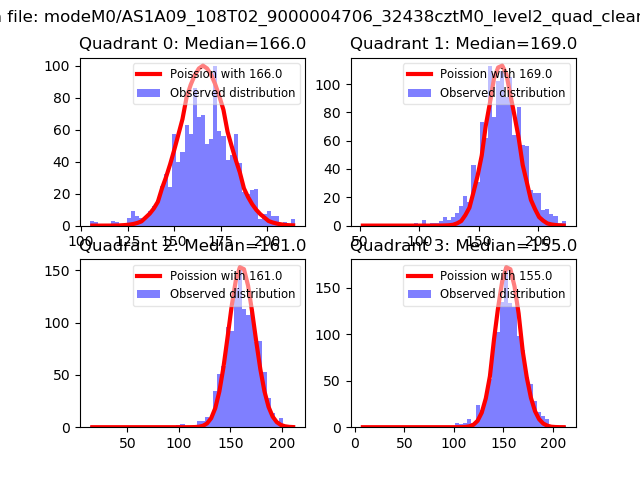 |
 |
| Quadrant-wise count rates Data is divided into 100 sec bins |
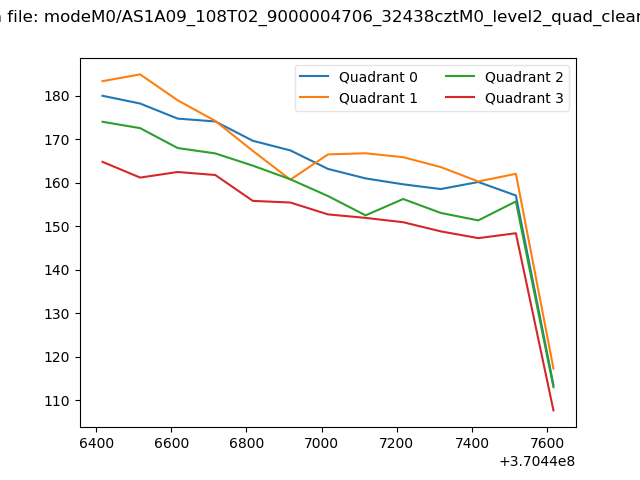 |
|
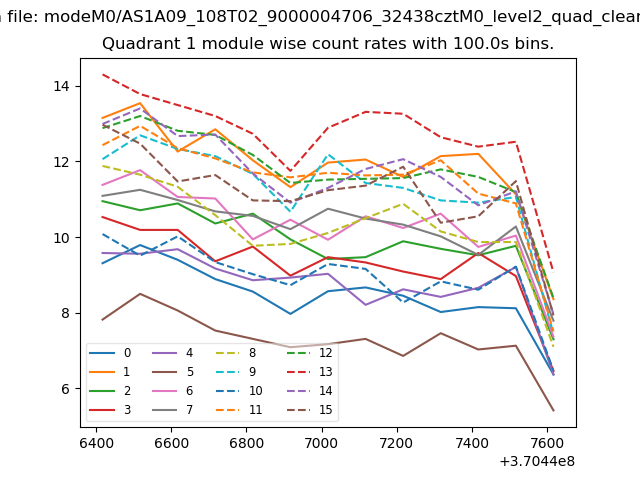
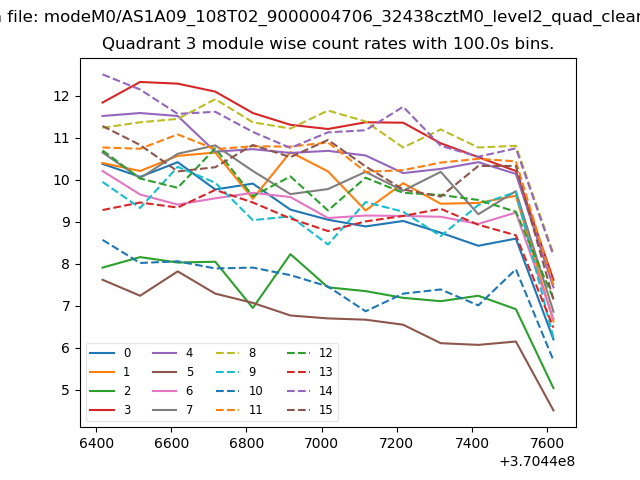
| Module-wise count rates for Quadrant A Data is divided into 100 sec bins |
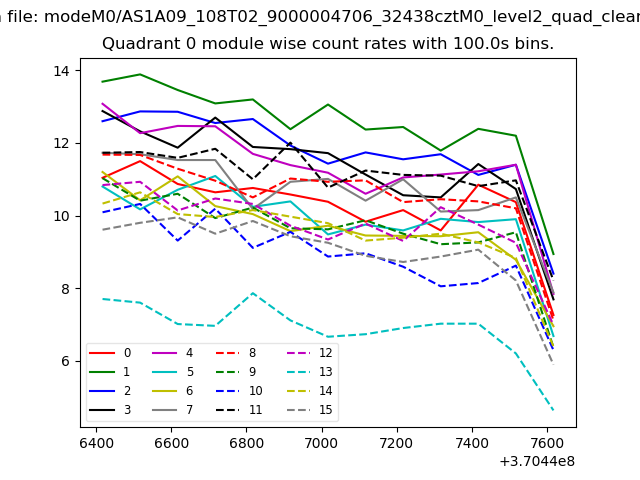 |
 |
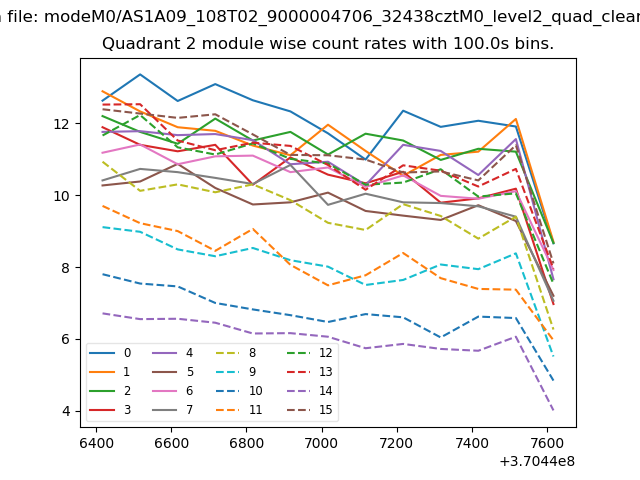
| Module-wise count rates for Quadrant B Data is divided into 100 sec bins |
 |
 |
| Module-wise count rates for Quadrant C Data is divided into 100 sec bins |
 |
 |
| Module-wise count rates for Quadrant D Data is divided into 100 sec bins |
 |
 |
| Parameter | Plot |
|---|---|
| CZT HV Monitor | 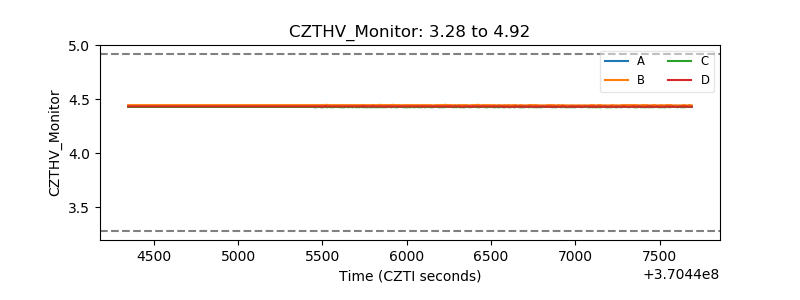 |
| D_VDD | 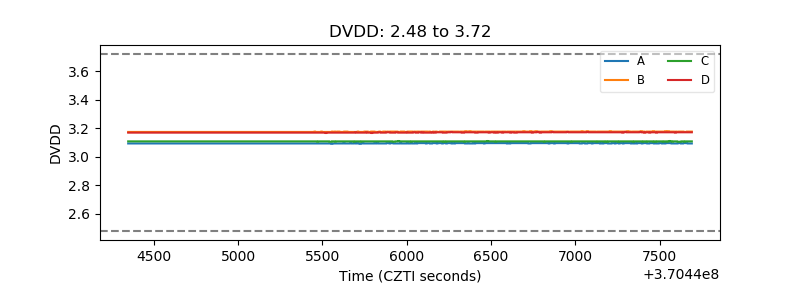 |
| Temperature 1 | 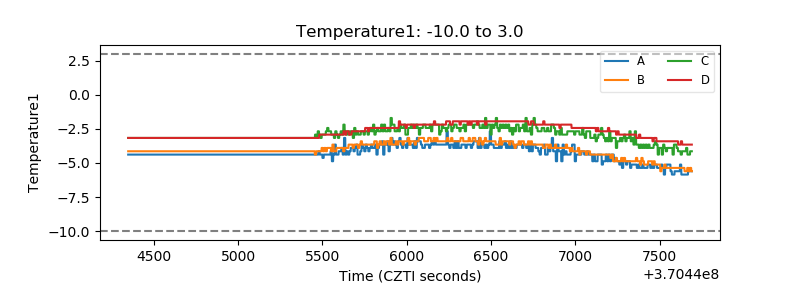 |
| Veto HV Monitor | 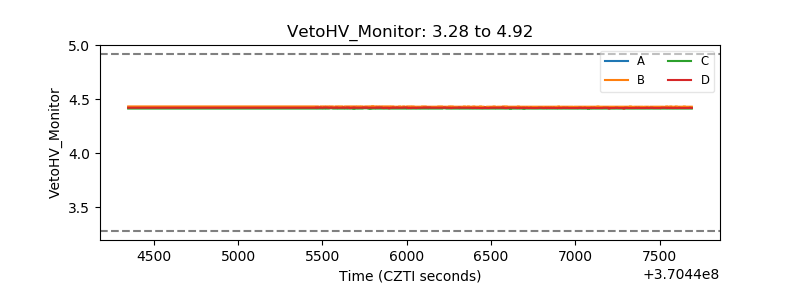 |
| Veto LLD | 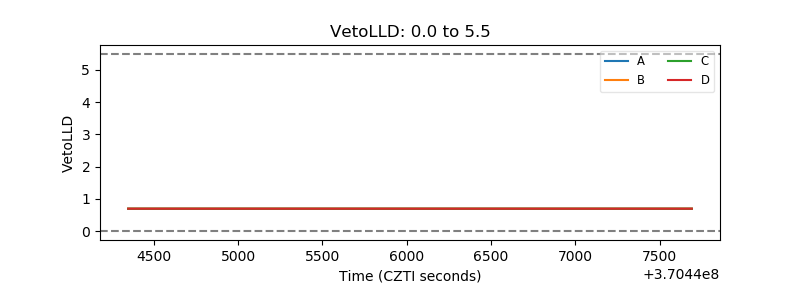 |
| Alpha Counter | 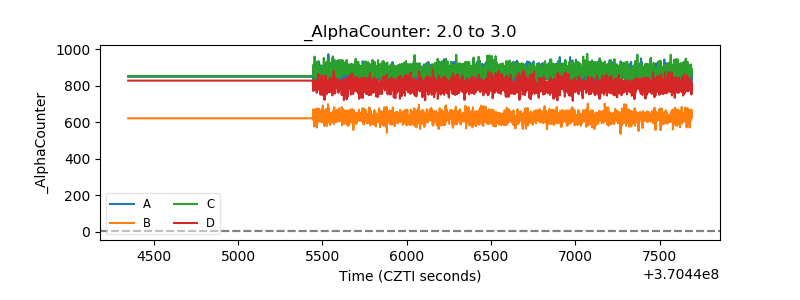 |
| _CPM_Rate | 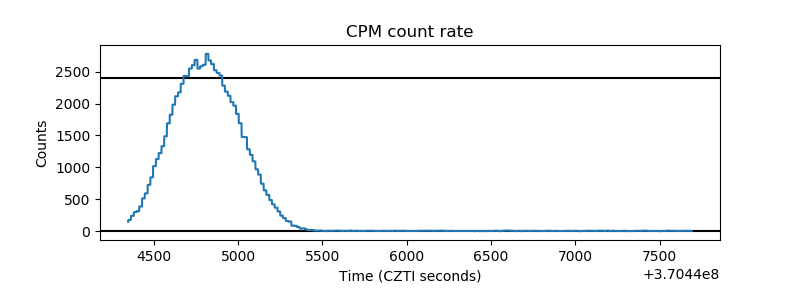 |
| CZT Counter | 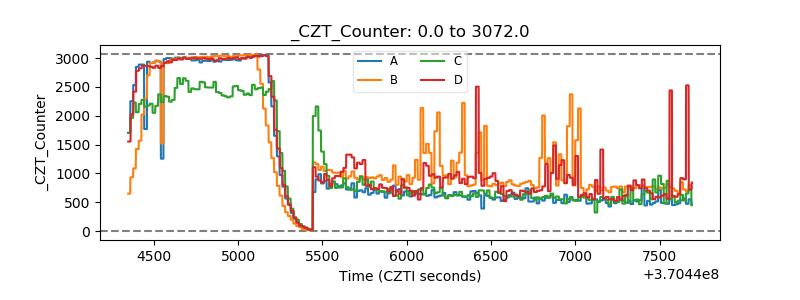 |
| +2.5 Volts monitor | 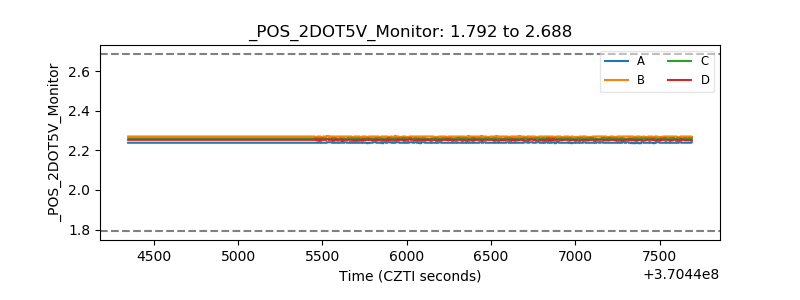 |
| +5 Volts monitor |  |
| _ROLL_ROT | 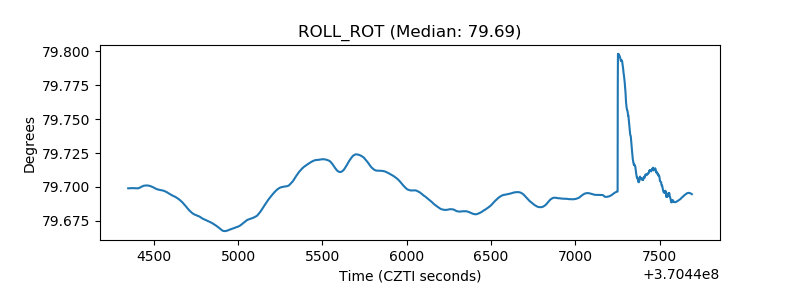 |
| _Roll_DEC | 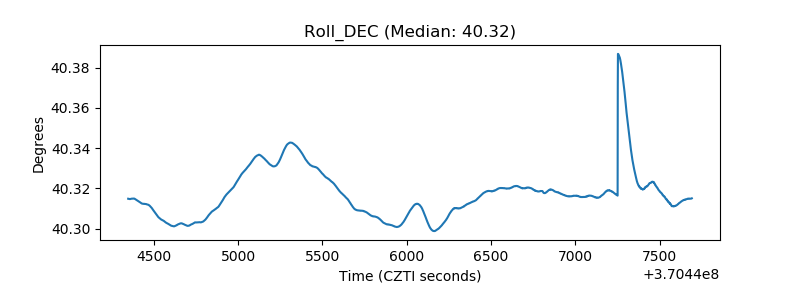 |
| _Roll_RA | 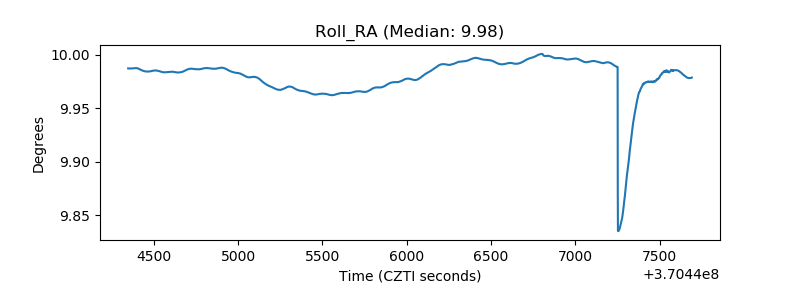 |
| Veto Counter | 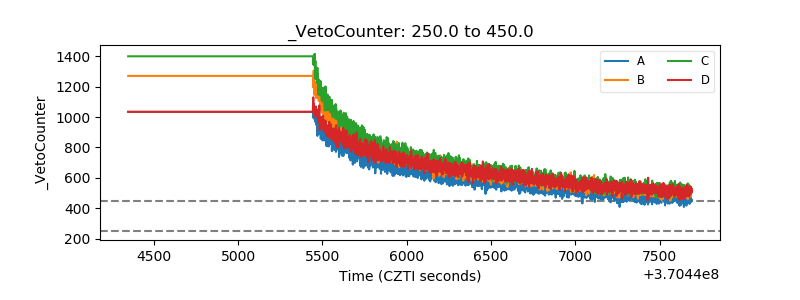 |