| Param | Original file | Final file |
|---|---|---|
| Filename | modeM0/AS1C06_002T06_9000004708cztM0_level2.fits | modeM0/AS1C06_002T06_9000004708cztM0_level2_quad_clean.evt |
| Size (bytes) | 74,669,760 | 28,342,080 |
| Size | 71.2 MB | 27.0 MB |
| Events in quadrant A | 485,862 | 102,058 |
| Events in quadrant B | 426,106 | 92,505 |
| Events in quadrant C | 471,842 | 97,189 |
| Events in quadrant D | 405,888 | 93,461 |
| Mode SS | |||
|---|---|---|---|
| Quadrant | BADHDUFLAG | Total packets | Discarded packets |
| A | 0 | 140 | 0 |
| B | 0 | 140 | 0 |
| C | 0 | 140 | 0 |
| D | 0 | 140 | 0 |
| Mode M0 | |||
|---|---|---|---|
| Quadrant | BADHDUFLAG | Total packets | Discarded packets |
| A | 0 | 14452 | 0 |
| B | 0 | 28681 | 0 |
| C | 0 | 15459 | 0 |
| D | 0 | 19578 | 0 |
| Mode M9 | |||
|---|---|---|---|
| Quadrant | BADHDUFLAG | Total packets | Discarded packets |
| A | 0 | 21 | 0 |
| B | 0 | 20 | 0 |
| C | 0 | 20 | 0 |
| D | 0 | 20 | 0 |
| Quadrant | Total seconds | Saturated seconds | Saturation percentage |
|---|---|---|---|
| A | 6768 | 75 | 1.108156% |
| B | 6768 | 1098 | 16.223404% |
| C | 6768 | 224 | 3.309693% |
| D | 6768 | 410 | 6.057920% |
Noise dominated data is calculated using 1-second bins in cleaned event files. If a bin has >2000 counts, and if more than 50% of those come from <1% of pixels, then it is considered to be noise-dominated and hence unusable.
| Quadrant | # 1 sec bins | Bins with >0 counts | Bins with >2000 counts | High rate bins dominated by noise | Noise dominated (total time) | Noise dominated (detector-on time) | Marked lightcurve |
|---|---|---|---|---|---|---|---|
| A | 8113 | 6768 | 0 | 0 | 0.00% | 0.00% | 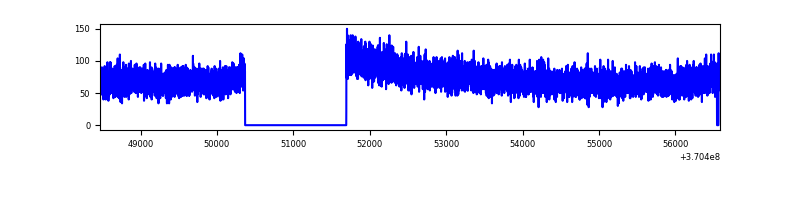 |
| B | 8113 | 6768 | 0 | 0 | 0.00% | 0.00% | 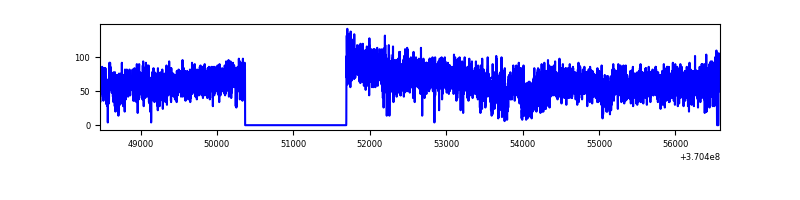 |
| C | 8113 | 6768 | 0 | 0 | 0.00% | 0.00% |  |
| D | 8113 | 6768 | 0 | 0 | 0.00% | 0.00% | 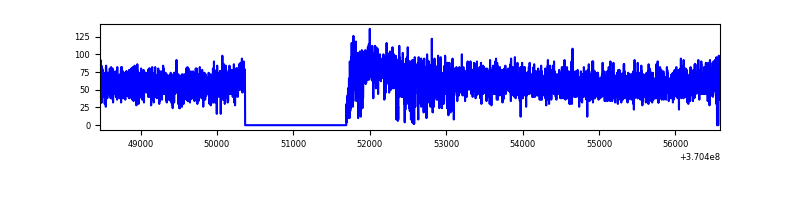 |
Top three noisy pixels from each quadrant. If the there are fewer than three noisy pixels in the level2.evt file, extra rows are filled as -1
| Pixel properties | Quadrant properties | ||||||
|---|---|---|---|---|---|---|---|
| Quadrant | DetID | PixID | Counts | Sigma | Mean | Median | Sigma |
| A | 0 | 29 | 494 | 11.36 | 126 | 121 | 32.8 |
| A | 9 | 19 | 375 | 7.74 | 126 | 121 | 32.8 |
| A | 7 | 110 | 373 | 7.68 | 126 | 121 | 32.8 |
| B | 2 | 9 | 361 | 10.3 | 113 | 109 | 24.5 |
| B | 5 | 128 | 295 | 7.61 | 113 | 109 | 24.5 |
| B | 2 | 8 | 294 | 7.56 | 113 | 109 | 24.5 |
| C | 1 | 81 | 365 | 7.36 | 125 | 119 | 33.4 |
| C | 1 | 80 | 326 | 6.19 | 125 | 119 | 33.4 |
| C | 3 | 126 | 321 | 6.04 | 125 | 119 | 33.4 |
| D | 6 | 38 | 317 | 6.63 | 116 | 106 | 31.8 |
| D | 6 | 231 | 313 | 6.51 | 116 | 106 | 31.8 |
| D | 15 | 46 | 286 | 5.66 | 116 | 106 | 31.8 |
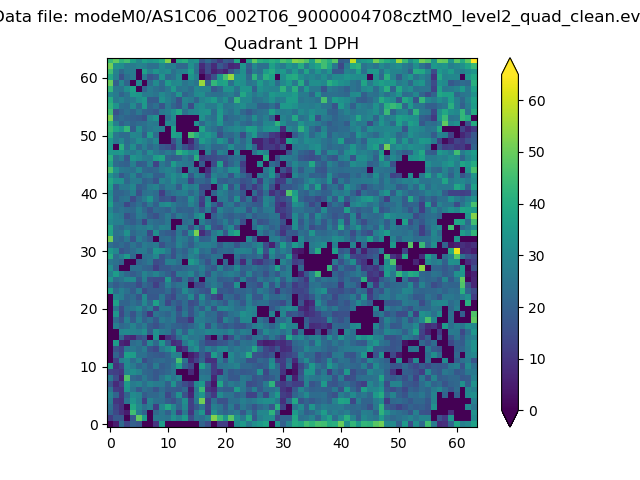
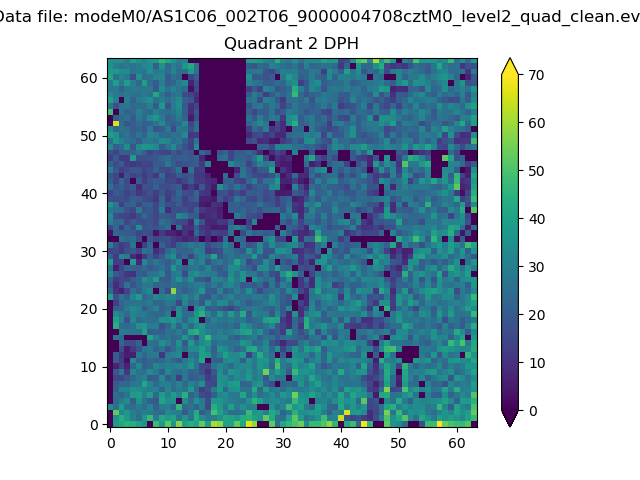
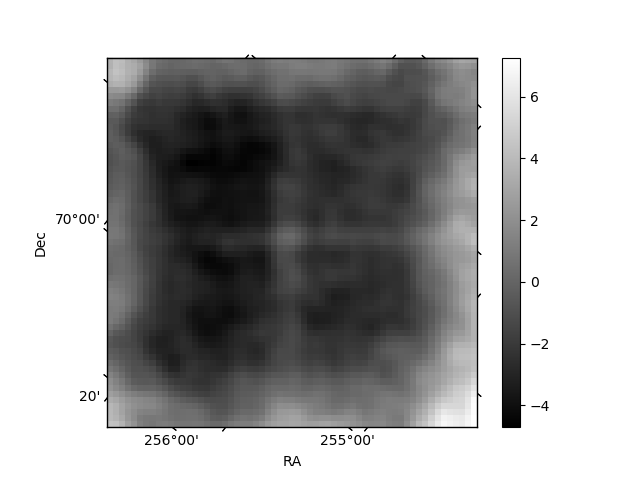
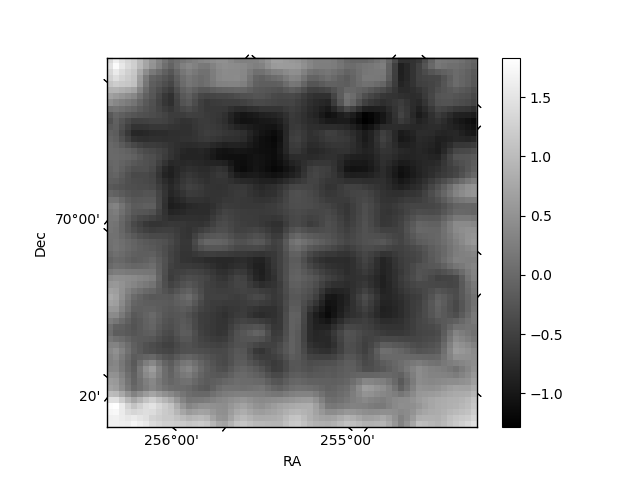
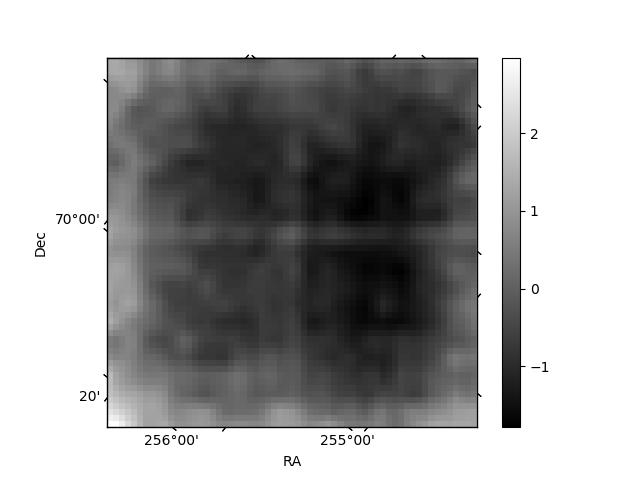
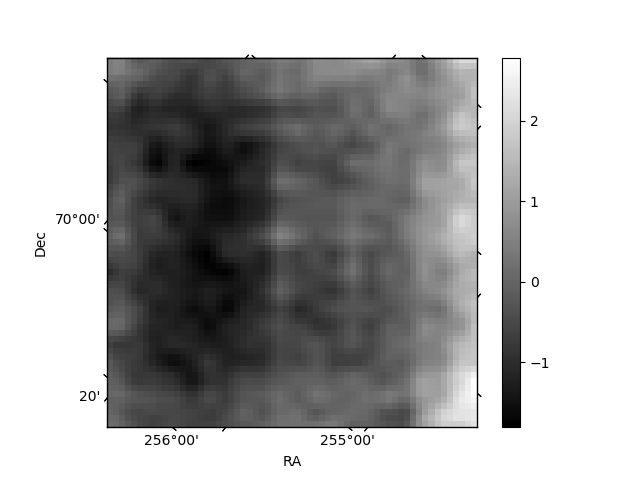
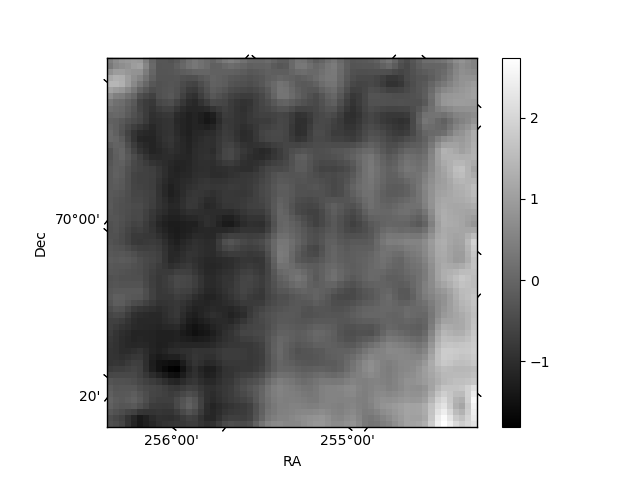
Histogram calculated using DETX and DETY for each event in the final _common_clean file
| Quadrant A | 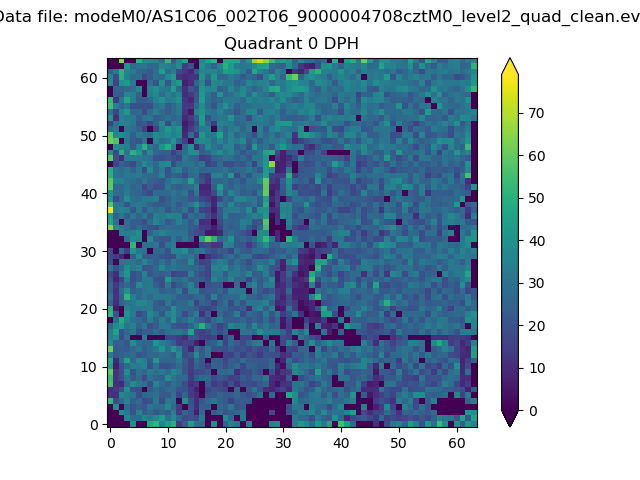 |
 |
Quadrant B |
|---|---|---|---|
| Quadrant D | 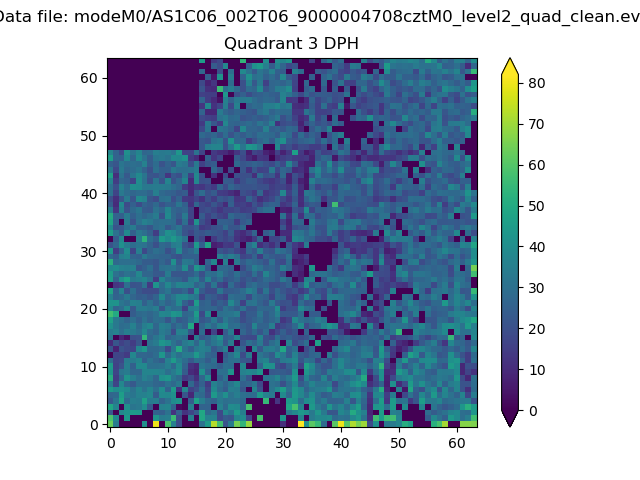 |
 |
Quadrant C |
| Plot type | Count rate plots | Images |
|---|---|---|
| Comparison with Poisson distribution Blue bars denote a histogram of data divided into 1 sec bins. Red curve is a Poisson curve with rate = median count rate of data. |
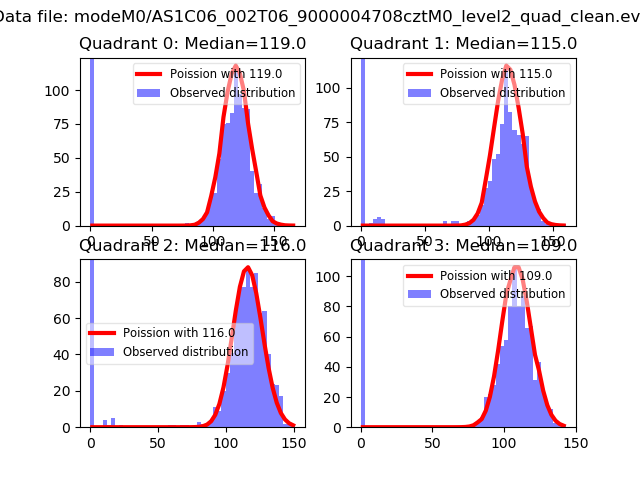 |
 |
| Quadrant-wise count rates Data is divided into 100 sec bins |
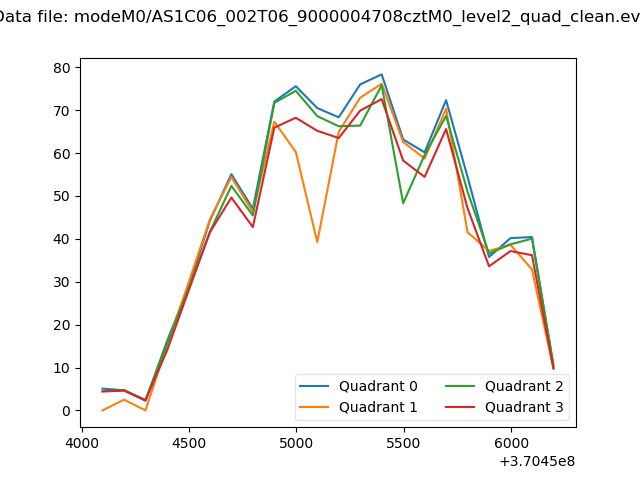 |
|
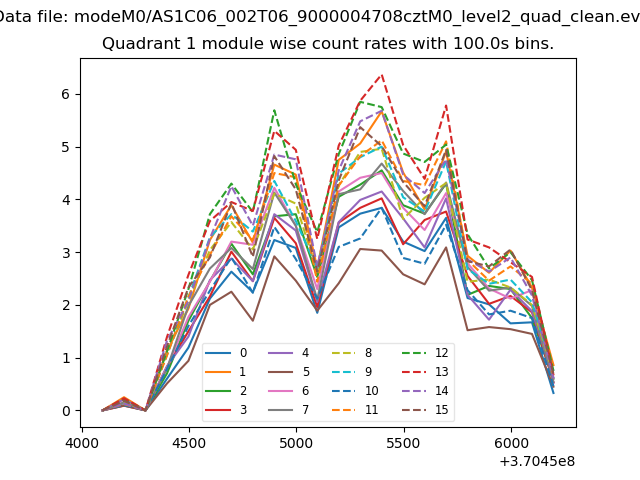
| Module-wise count rates for Quadrant A Data is divided into 100 sec bins |
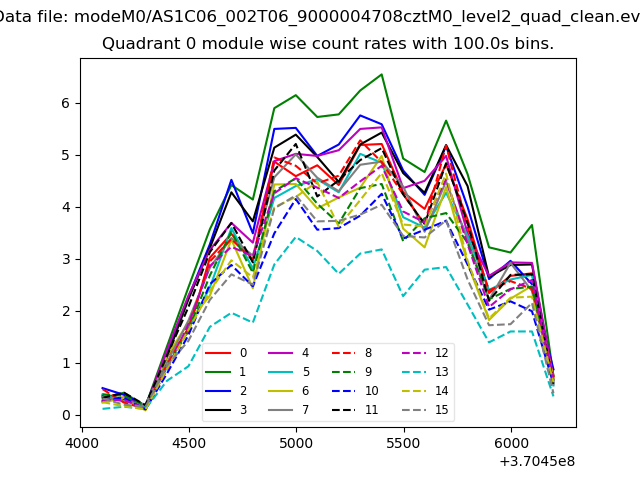 |
 |
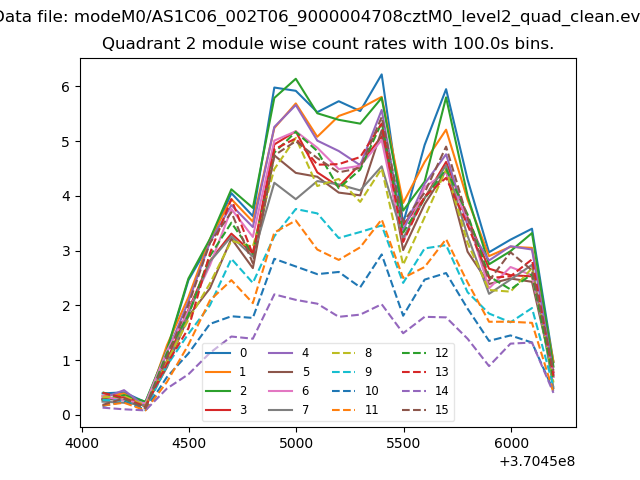
| Module-wise count rates for Quadrant B Data is divided into 100 sec bins |
 |
 |
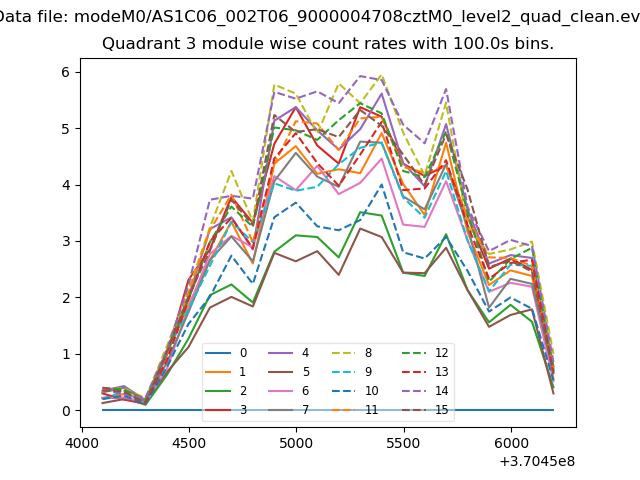
| Module-wise count rates for Quadrant C Data is divided into 100 sec bins |
 |
 |
| Module-wise count rates for Quadrant D Data is divided into 100 sec bins |
 |
 |
| Parameter | Plot |
|---|---|
| CZT HV Monitor | 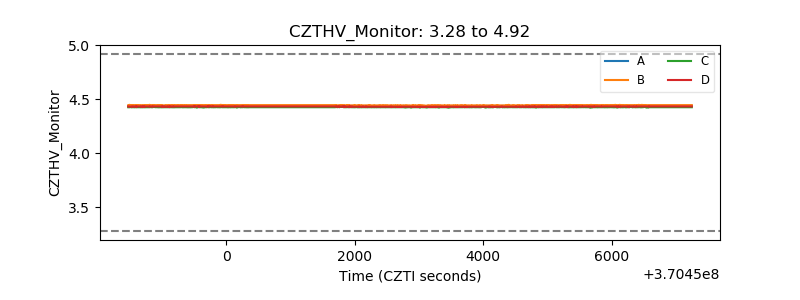 |
| D_VDD | 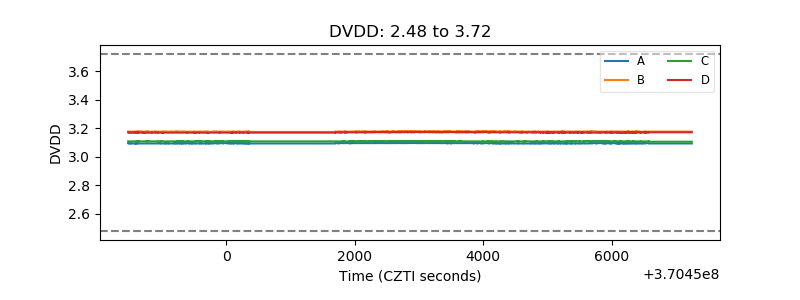 |
| Temperature 1 | 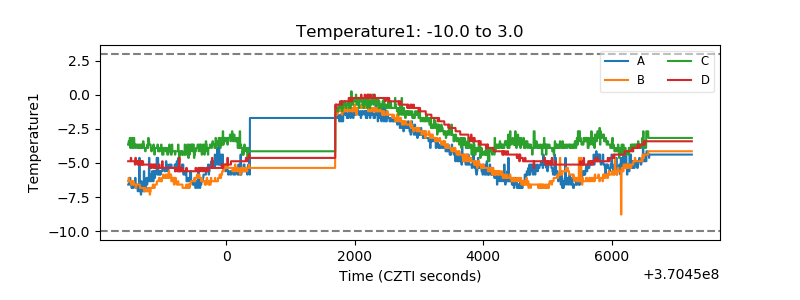 |
| Veto HV Monitor | 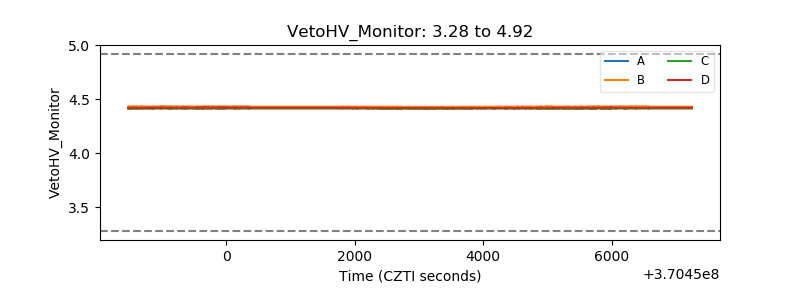 |
| Veto LLD | 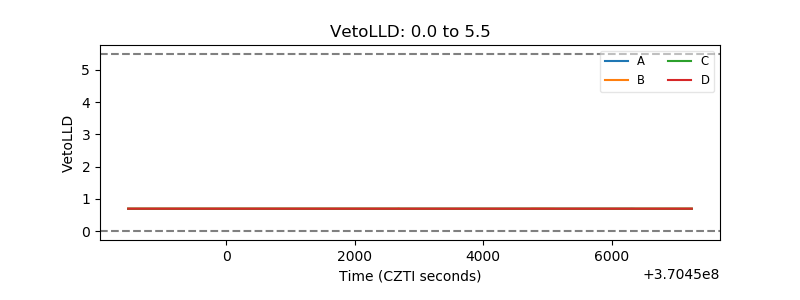 |
| Alpha Counter | 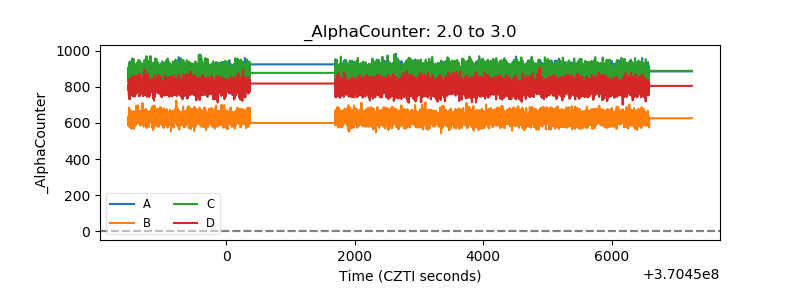 |
| _CPM_Rate | 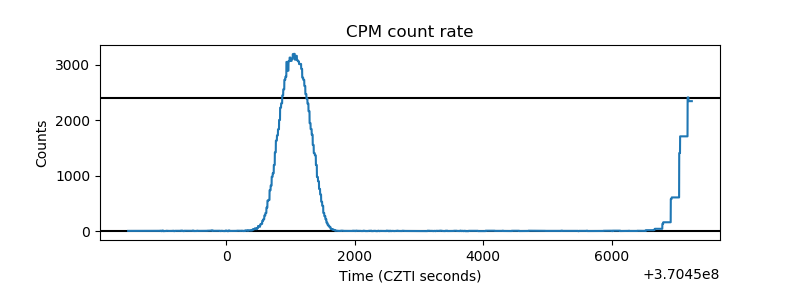 |
| CZT Counter | 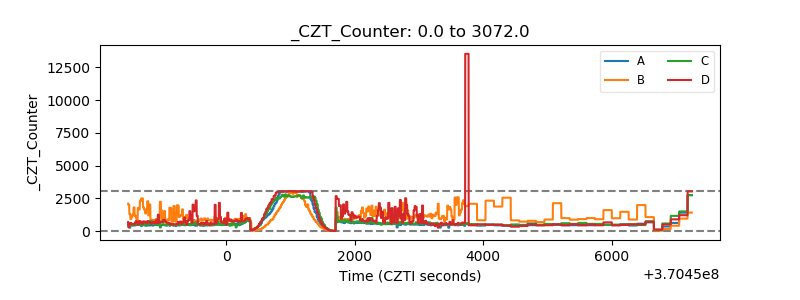 |
| +2.5 Volts monitor | 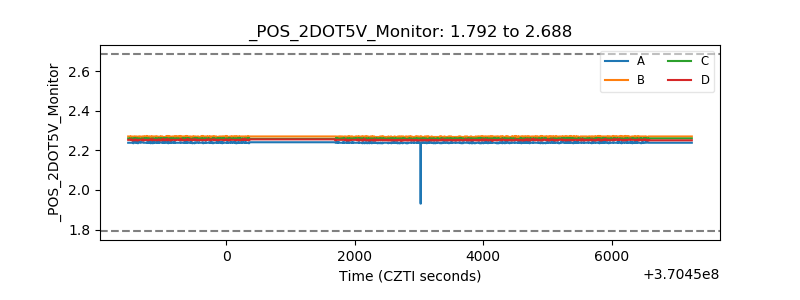 |
| +5 Volts monitor | 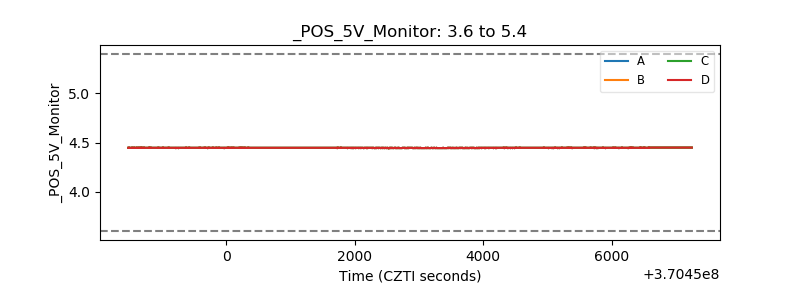 |
| _ROLL_ROT | 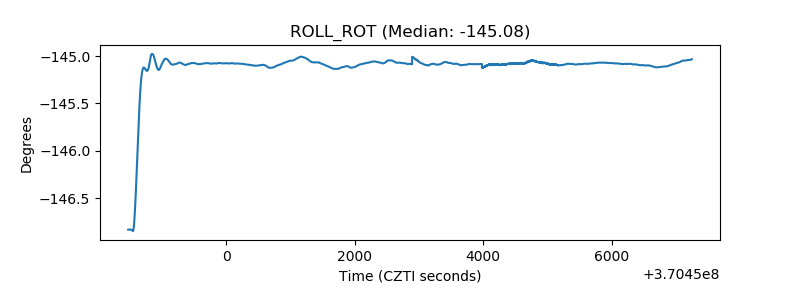 |
| _Roll_DEC | 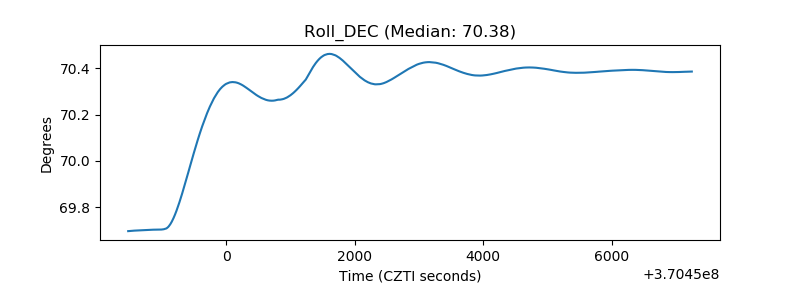 |
| _Roll_RA | 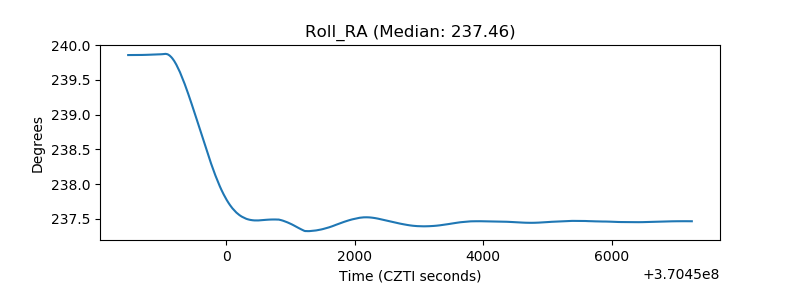 |
| Veto Counter | 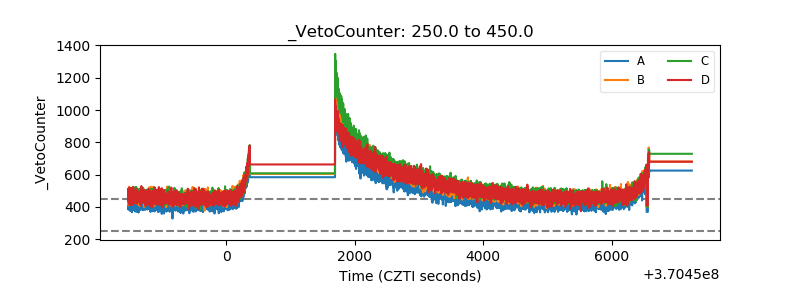 |