| Param | Original file | Final file |
|---|---|---|
| Filename | modeM0/AS1C06_002T06_9000004708_32438cztM0_level2.evt | modeM0/AS1C06_002T06_9000004708_32438cztM0_level2_quad_clean.evt |
| Size (bytes) | 365,987,520 | 75,818,880 |
| Size | 349.0 MB | 72.3 MB |
| Events in quadrant A | 1,805,421 | 535,062 |
| Events in quadrant B | 3,790,107 | 520,903 |
| Events in quadrant C | 1,978,444 | 521,581 |
| Events in quadrant D | 3,281,448 | 479,992 |
| Mode SS | |||
|---|---|---|---|
| Quadrant | BADHDUFLAG | Total packets | Discarded packets |
| A | 0 | 70 | 0 |
| B | 0 | 70 | 0 |
| C | 0 | 70 | 0 |
| D | 0 | 70 | 0 |
| Mode M0 | |||
|---|---|---|---|
| Quadrant | BADHDUFLAG | Total packets | Discarded packets |
| A | 0 | 7479 | 2 |
| B | 0 | 13559 | 1 |
| C | 0 | 8033 | 1 |
| D | 0 | 12123 | 1 |
| Mode M9 | |||
|---|---|---|---|
| Quadrant | BADHDUFLAG | Total packets | Discarded packets |
| A | 0 | 13 | 0 |
| B | 0 | 13 | 0 |
| C | 0 | 13 | 0 |
| D | 0 | 13 | 0 |
| Quadrant | Total seconds | Saturated seconds | Saturation percentage |
|---|---|---|---|
| A | 3358 | 50 | 1.488982% |
| B | 3358 | 345 | 10.273973% |
| C | 3358 | 104 | 3.097082% |
| D | 3358 | 383 | 11.405599% |
Noise dominated data is calculated using 1-second bins in cleaned event files. If a bin has >2000 counts, and if more than 50% of those come from <1% of pixels, then it is considered to be noise-dominated and hence unusable.
| Quadrant | # 1 sec bins | Bins with >0 counts | Bins with >2000 counts | High rate bins dominated by noise | Noise dominated (total time) | Noise dominated (detector-on time) | Marked lightcurve |
|---|---|---|---|---|---|---|---|
| A | 4683 | 3359 | 0 | 0 | 0.00% | 0.00% | 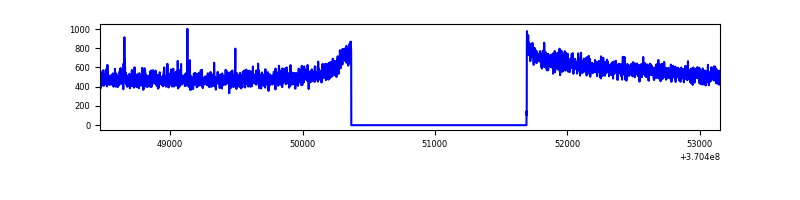 |
| B | 4683 | 3359 | 152 | 152 | 3.25% | 4.53% | 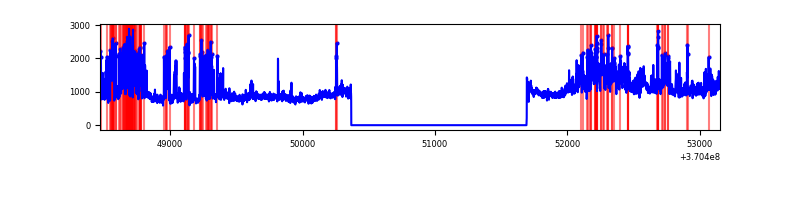 |
| C | 4683 | 3359 | 6 | 6 | 0.13% | 0.18% | 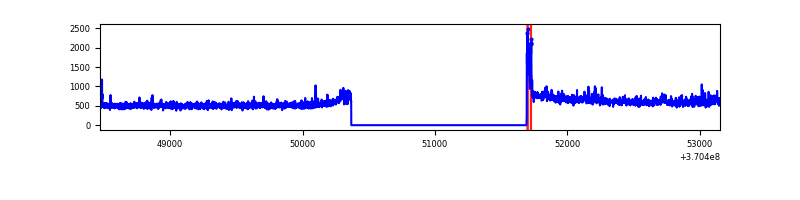 |
| D | 4683 | 3359 | 260 | 260 | 5.55% | 7.74% | 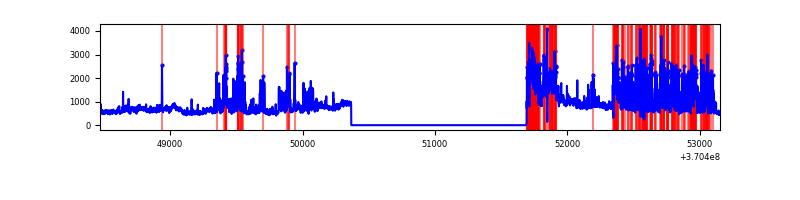 |
Top three noisy pixels from each quadrant. If the there are fewer than three noisy pixels in the level2.evt file, extra rows are filled as -1
| Pixel properties | Quadrant properties | ||||||
|---|---|---|---|---|---|---|---|
| Quadrant | DetID | PixID | Counts | Sigma | Mean | Median | Sigma |
| A | 12 | 16 | 6069 | 60.78 | 465 | 457 | 92.3 |
| A | 13 | 254 | 5898 | 58.93 | 465 | 457 | 92.3 |
| A | 13 | 6 | 4527 | 44.08 | 465 | 457 | 92.3 |
| B | 6 | 159 | 957670 | 11579.08 | 450 | 439 | 82.7 |
| B | 4 | 80 | 865126 | 10459.63 | 450 | 439 | 82.7 |
| B | 0 | 190 | 106179 | 1279.08 | 450 | 439 | 82.7 |
| C | 14 | 238 | 80405 | 773.2 | 449 | 453 | 103.4 |
| C | 14 | 67 | 69153 | 664.38 | 449 | 453 | 103.4 |
| C | 0 | 10 | 41379 | 395.79 | 449 | 453 | 103.4 |
| D | 8 | 195 | 573492 | 5727.11 | 432 | 423 | 100.1 |
| D | 12 | 233 | 364328 | 3636.78 | 432 | 423 | 100.1 |
| D | 12 | 218 | 358447 | 3578.01 | 432 | 423 | 100.1 |
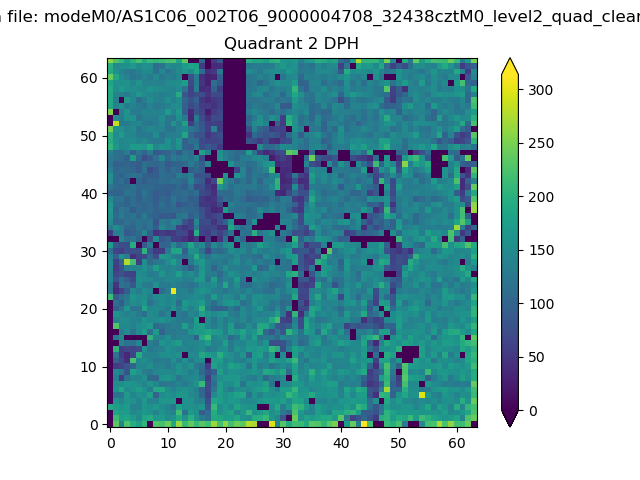
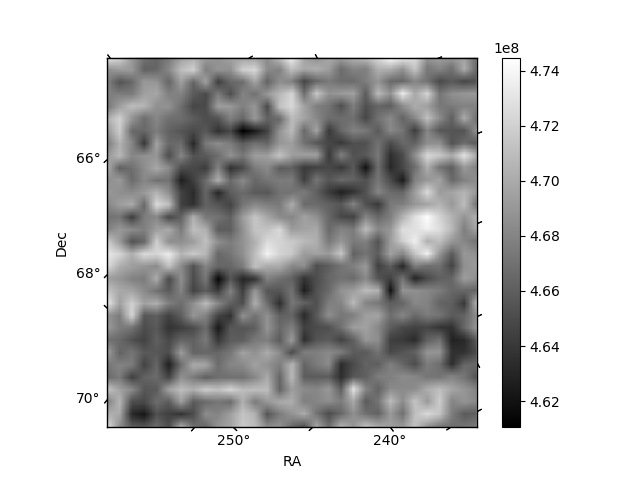
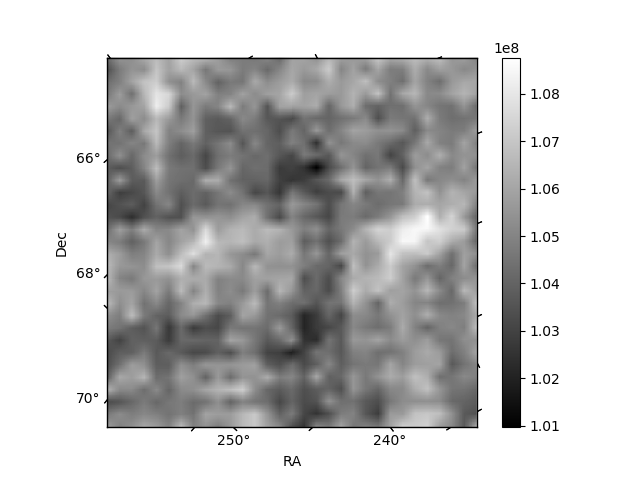
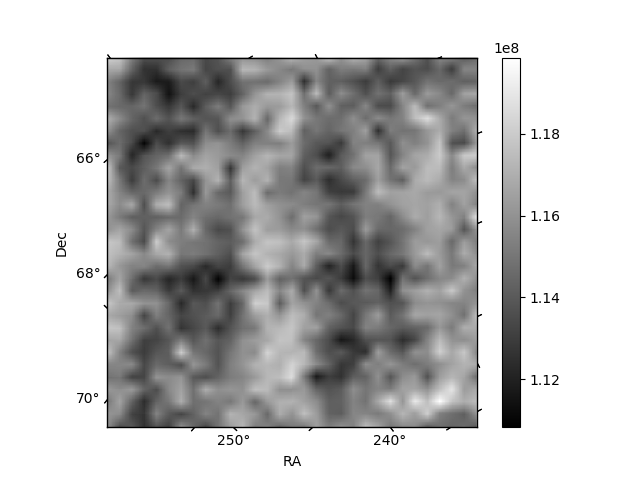
Histogram calculated using DETX and DETY for each event in the final _common_clean file
| Quadrant A | 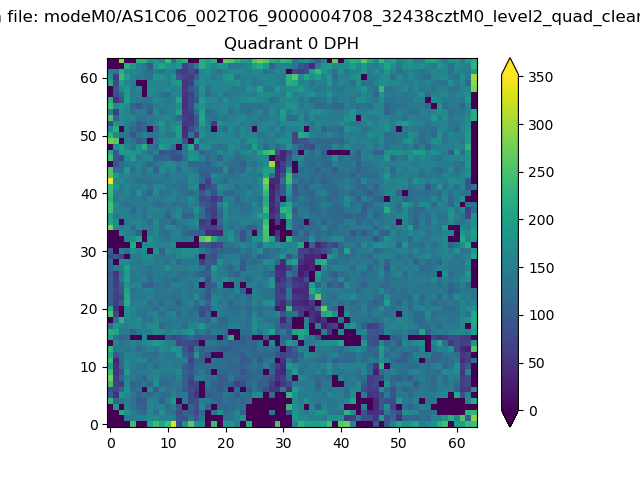 |
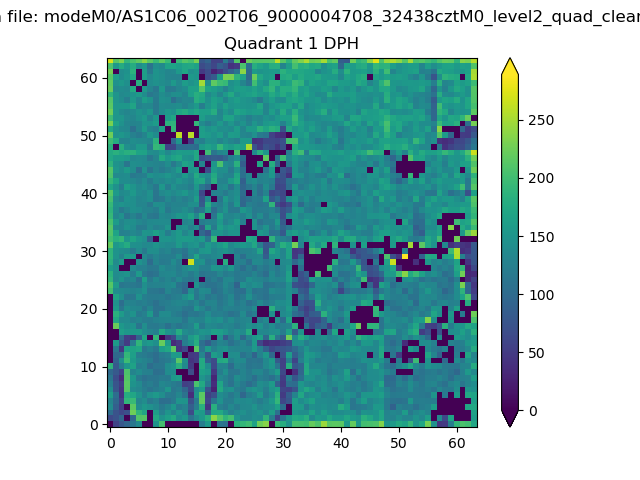 |
Quadrant B |
|---|---|---|---|
| Quadrant D | 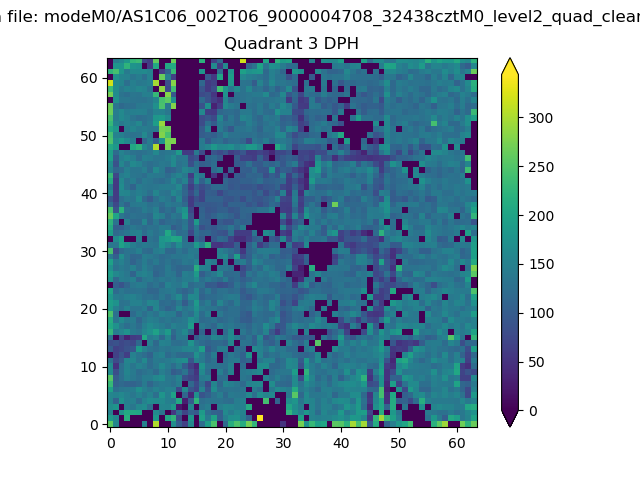 |
 |
Quadrant C |
| Plot type | Count rate plots | Images |
|---|---|---|
| Comparison with Poisson distribution Blue bars denote a histogram of data divided into 1 sec bins. Red curve is a Poisson curve with rate = median count rate of data. |
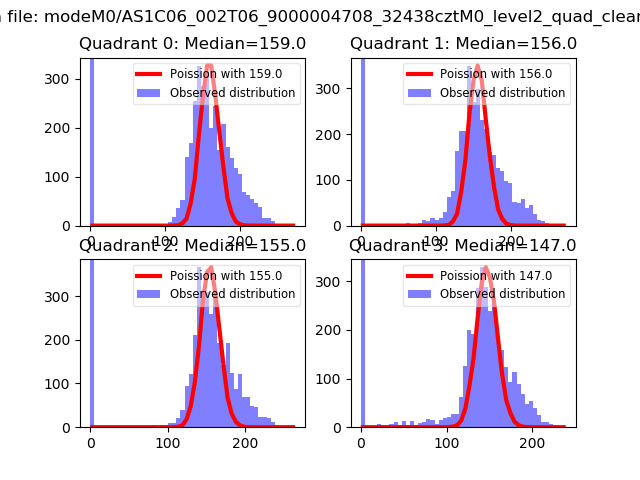 |
 |
| Quadrant-wise count rates Data is divided into 100 sec bins |
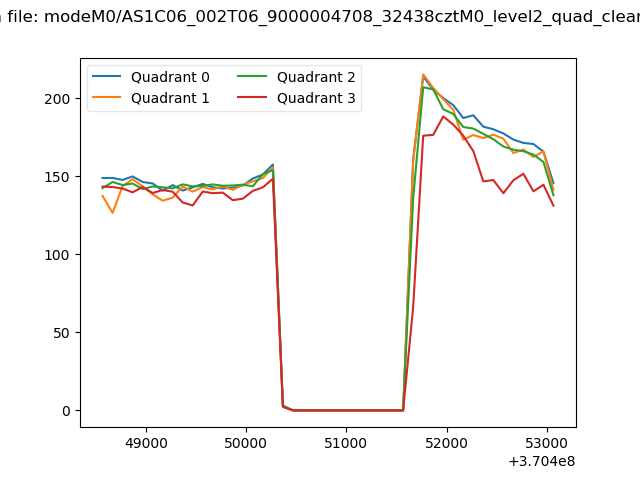 |
|
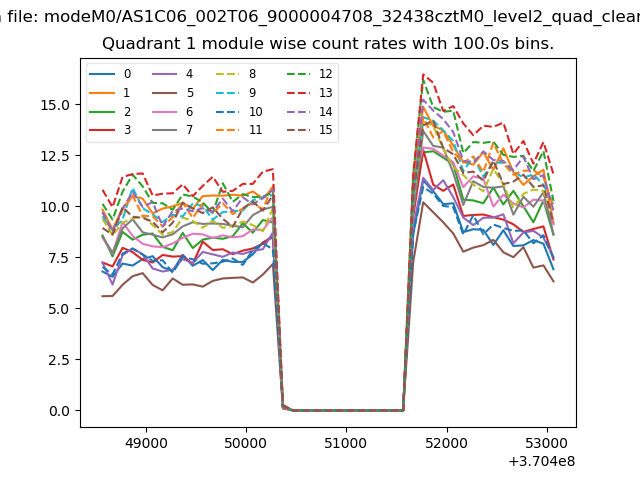
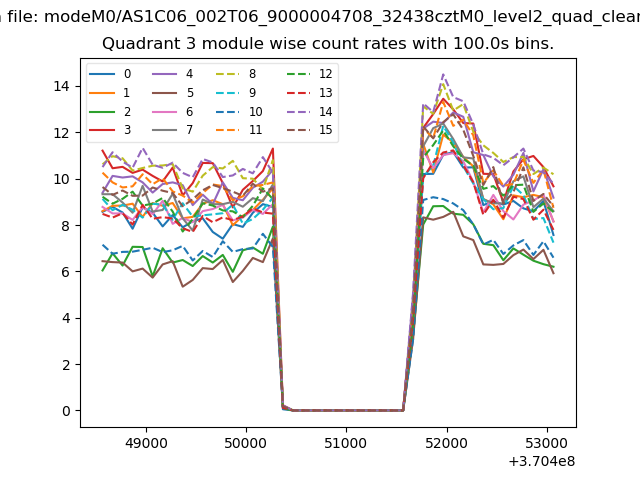
| Module-wise count rates for Quadrant A Data is divided into 100 sec bins |
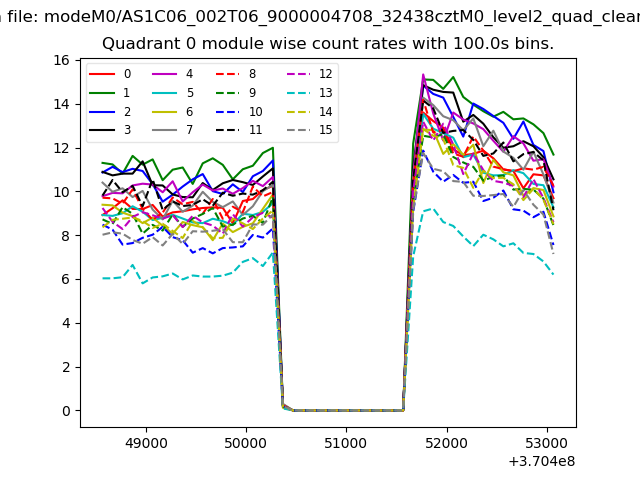 |
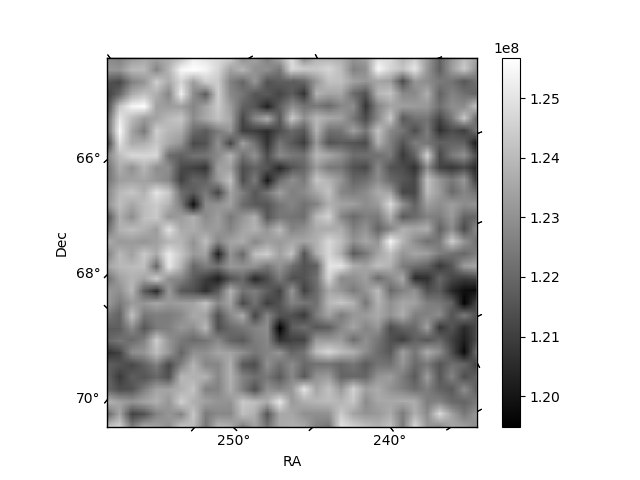 |
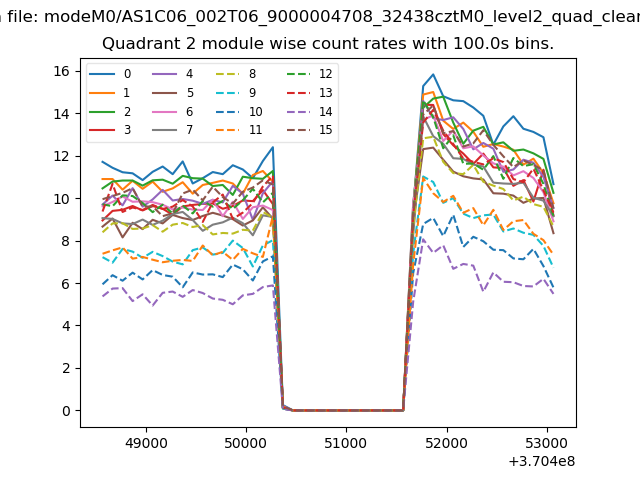
| Module-wise count rates for Quadrant B Data is divided into 100 sec bins |
 |
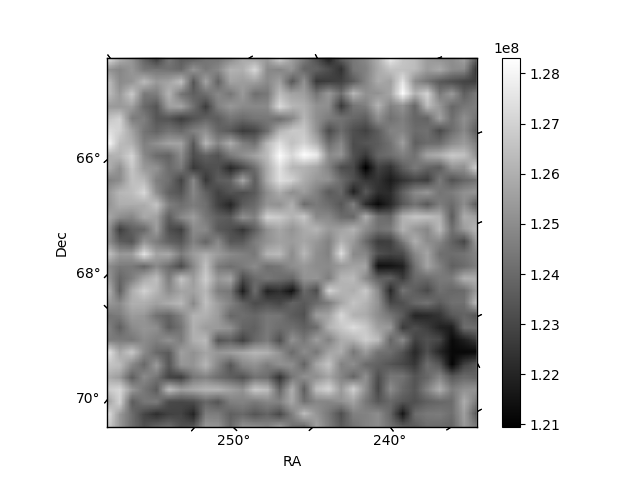 |
| Module-wise count rates for Quadrant C Data is divided into 100 sec bins |
 |
 |
| Module-wise count rates for Quadrant D Data is divided into 100 sec bins |
 |
 |
| Parameter | Plot |
|---|---|
| CZT HV Monitor | 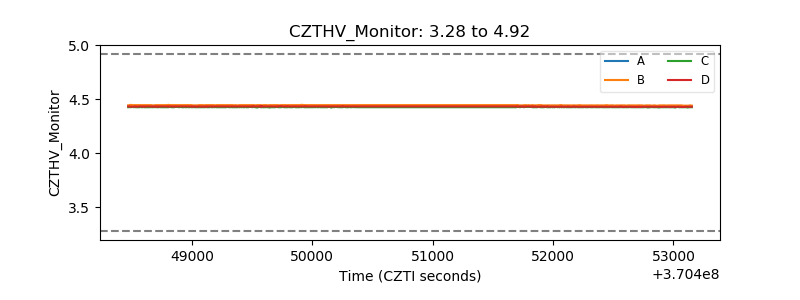 |
| D_VDD | 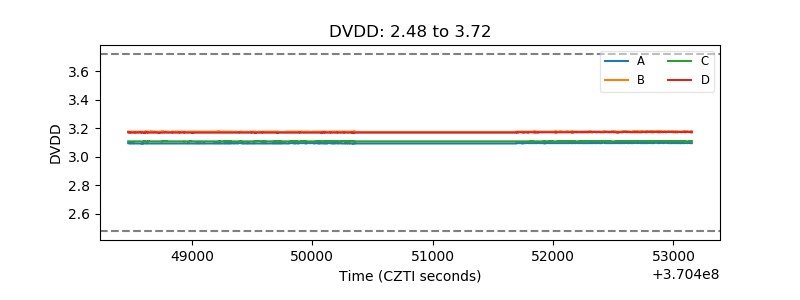 |
| Temperature 1 | 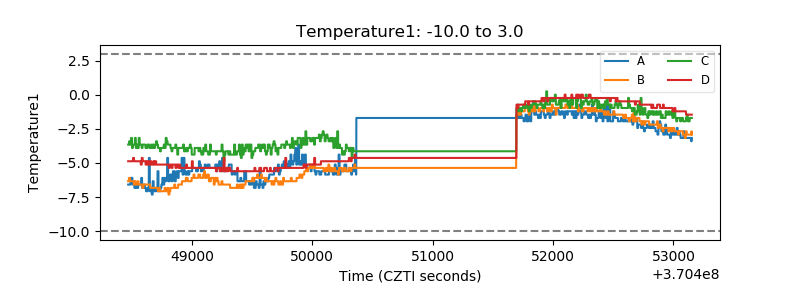 |
| Veto HV Monitor | 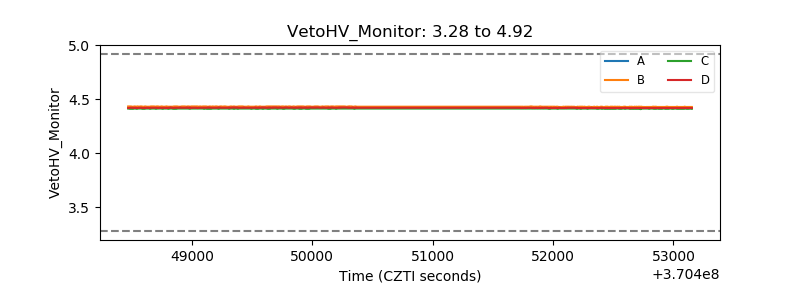 |
| Veto LLD | 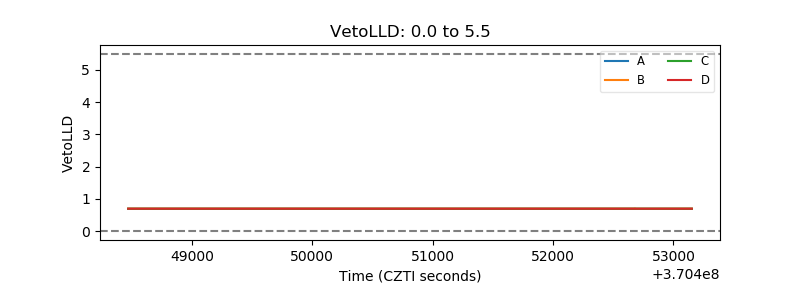 |
| Alpha Counter | 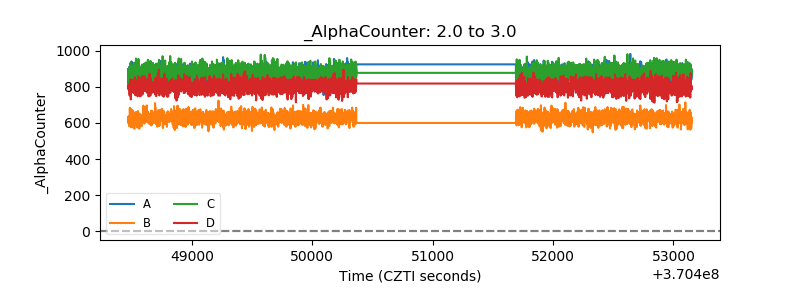 |
| _CPM_Rate | 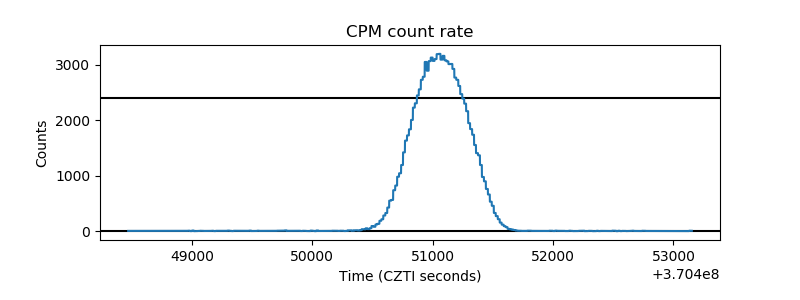 |
| CZT Counter | 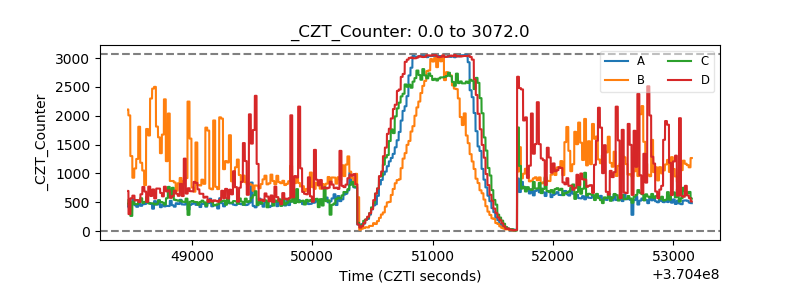 |
| +2.5 Volts monitor | 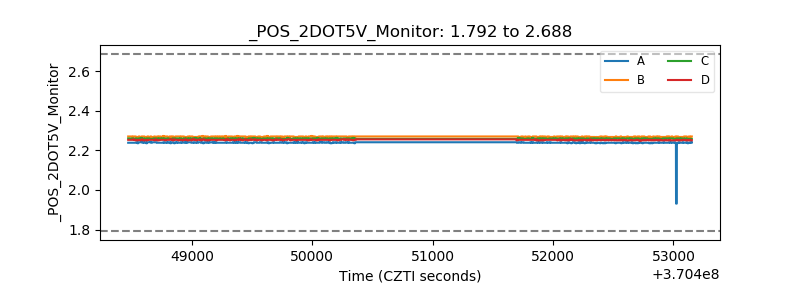 |
| +5 Volts monitor | 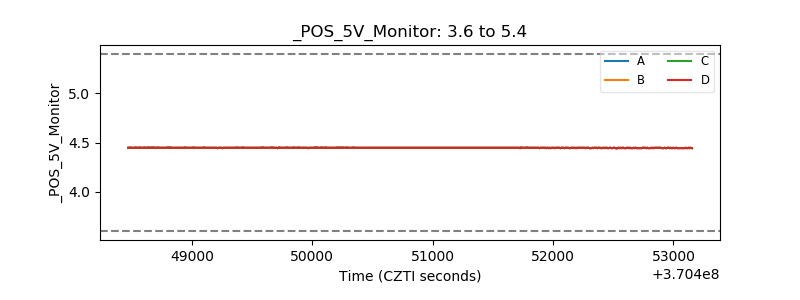 |
| _ROLL_ROT | 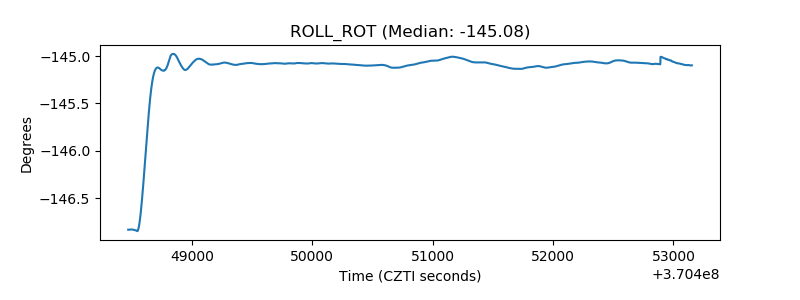 |
| _Roll_DEC | 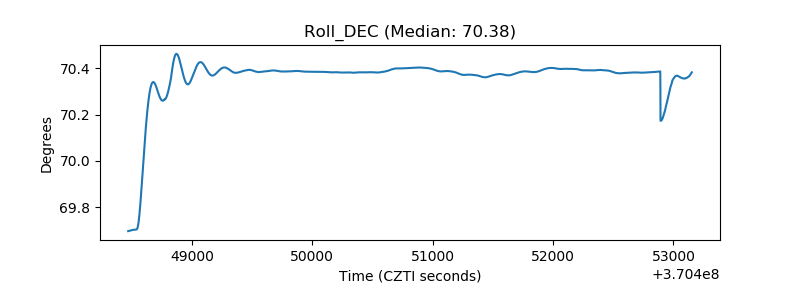 |
| _Roll_RA | 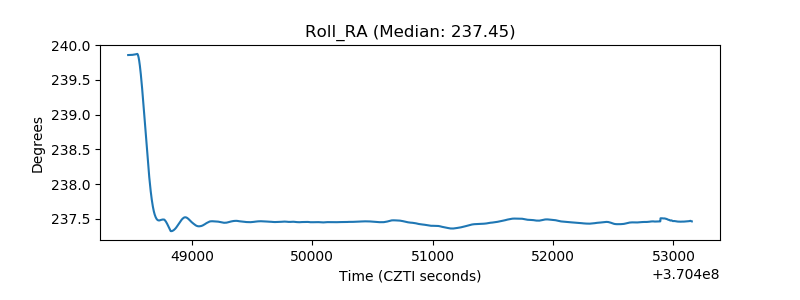 |
| Veto Counter | 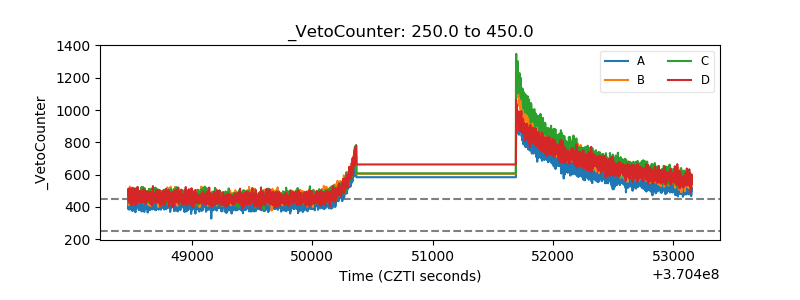 |